
Does the Migration to GitHub Relate to Internal Software Quality?
Riccardo Roveda
1
, Francesca Arcelli Fontana
1
, Claudia Raibulet
1
, Marco Zanoni
1
and Federico Rampazzo
2
University of Milano-Bicocca, Milano, Italy
Keywords:
Quality Metrics, Code Smells, Migration To GitHub, Trend Analysis.
Abstract:
Software development is more and more influenced by the usage of FLOSS (Free, Libre and Open Source
Software) projects. These software projects are developed in web collaborative environments hosted on web
platforms, called code forges. Many code forges exist, with different capabilities. GitHub is perhaps the largest
code forge available, and many projects have been migrated from different code forges to GitHub. Given its
success, we want to understand if its adoption has effect on the projects’ internal quality. To consider objective
measures of internal quality, we apply four known tools performing static analysis to extract metrics and code
anomalies. These data is extracted on six versions of six FLOSS projects, and compared to understand if the
migration to GitHub had any consistent effect over any of the considered measures.
1 INTRODUCTION
Open source software development is receiving a con-
tinuously increasing interest across different com-
munities, e.g., the industry, public administration
and research institutions. After the advent of cloud
computing, FLOSS projects are often used to build
commercial services or software packages. FLOSS
projects are developed in web collaborative environ-
ments hosted on web platforms, called code forges.
Many code forges exist, with different capabilities.
Currently, GitHub seems to be the most powerful
code forge in the internet, and surely the largest one
(currently more than 54M repositories). Its aim is to
provide open collaborative software development and
support to “build software better, together
1
”.GitHub
has gained also the attention of the academic world.
There are several proposals which aim to extend
and improve its functionality (e.g., recover commit
branch from origin (Michaud et al., 2016) or propose
a code reviewer recommendation technique (Rahman
et al., 2016)) or its usage, e.g., analyze the collabora-
tion among the developers after the migration of the
projects to GitHub (Dias et al., 2016) or investigate
the factors influencing the popularity of the projects
in GitHub (Borges et al., 2016). GitHub has been also
introduced in software engineering courses (Feliciano
et al., 2016; Zagalsky et al., 2015).
1
https://github.com/
In this paper, we aim to comprehend if the mi-
gration to GitHub has actual effects on projects, from
the point of view of some source code characteristics.
We describe the experimentation we did by analyzing
six projects. Three of them moved from Sourceforge
2
to GitHub, while the other three did not migrate to
GitHub. Sourceforge with respect to GitHub is more
oriented to the sharing facilities than to the collabo-
rative ones and currently collects more than 460.000
projects. The projects belong to three different do-
mains: code analysis, web crawler and ORM (Object-
Relational Mapping). We have compared the mi-
grated projects with the ones not migrated, to analyze
if the new collaborative development platform could
enhance also the internal quality of the software. We
check also if the domain of the projects has an impact
on our analysis. Obviously, software quality enhance-
ment can be evaluated in many different ways. In this
work, we consider only some software quality met-
rics, code anomalies, as code smells (Fowler, 1999),
and the violations of best-practice coding rules. All
of these measures are extracted using tools for source
code static analysis: Understand, inFusion, FindBugs,
and SonarQube. To guide our experiment, we define
two research questions:
RQ1 Does the migration to GitHub relate to the in-
ternal quality of software projects?
RQ2 Are internal quality trends related to other as-
2
http://sourceforge.net/
Roveda, R., Fontana, F., Raibulet, C., Zanoni, M. and Rampazzo, F.
Does the Migration to GitHub Relate to Inter nal Software Quality?.
DOI: 10.5220/0006367402930300
In Proceedings of the 12th International Conference on Evaluation of Novel Approaches to Software Engineering (ENASE 2017), pages 293-300
ISBN: 978-989-758-250-9
Copyright © 2017 by SCITEPRESS – Science and Technology Publications, Lda. All rights reserved
293

pects, as the projects’ domain?
To answer the questions, we detect quality mea-
sures trends over six versions of six projects, and
compare the trends appearing in migrated or non-
migrated projects (RQ1) and in the different do-
mains (RQ2). The trend analysis has been per-
formed through the Mann-Kendall test, applied to
each quality indicator. From our results, it appears
that, considering also some peculiarities of the ex-
tracted data, no significant difference exists in trends
across migration/non-migration and domain factors.
The rest of the paper is organized as follows. Sec-
tion 2 introduces the related work. Section 3 describes
the experiment setup. Section 4 our main results. Sec-
tion 5 deals with the threats to validity. Section 6 con-
cludes and outlines future developments.
2 RELATED WORK
For what concerns quality analysis related to GitHub,
we found some recent works in the literature.
In (Jarczyk et al., 2014), the authors investigate if
there are any significant correlations between project
quality and the characteristics of the team members
using GitHub. To this aim, they defined two metrics,
one reflecting projects popularity, and one reflecting
the quality of support offered by team members to
users, obtained using survival analysis techniques ap-
plied to issues reported by users.
In (Yu et al., 2014), the authors analyze the suit-
ability of GitHub to support distributed software de-
velopment. They review different kinds of version
control systems and study the dynamics of GitHub,
i.e., its ability and scalability to process different re-
quests and to provide different services to different
GitHub projects and users.
In (Vasilescu et al., 2014), the authors found em-
pirical evidence of continuous integration in a social-
coding world from GitHub. They discovered that in
projects older than two years and projects with not too
many contributors, pull request are much more likely
to result in successful builds than direct commits.
In (Vendome et al., 2015), the authors performed
an empirical study to quantitatively and qualitatively
investigate when and why developer change software
licenses. They identify licenses changes in 1,731,828
commits, representing the entire history of 16,221
Java projects hosted on GitHub.
In (Alexandre Decan et al., 2016), the authors
explore how the use of GitHub influences the R
ecosystem, for the distribution of packages and for
inter-repository package dependency management.
They show that many R packages hosted on GitHub
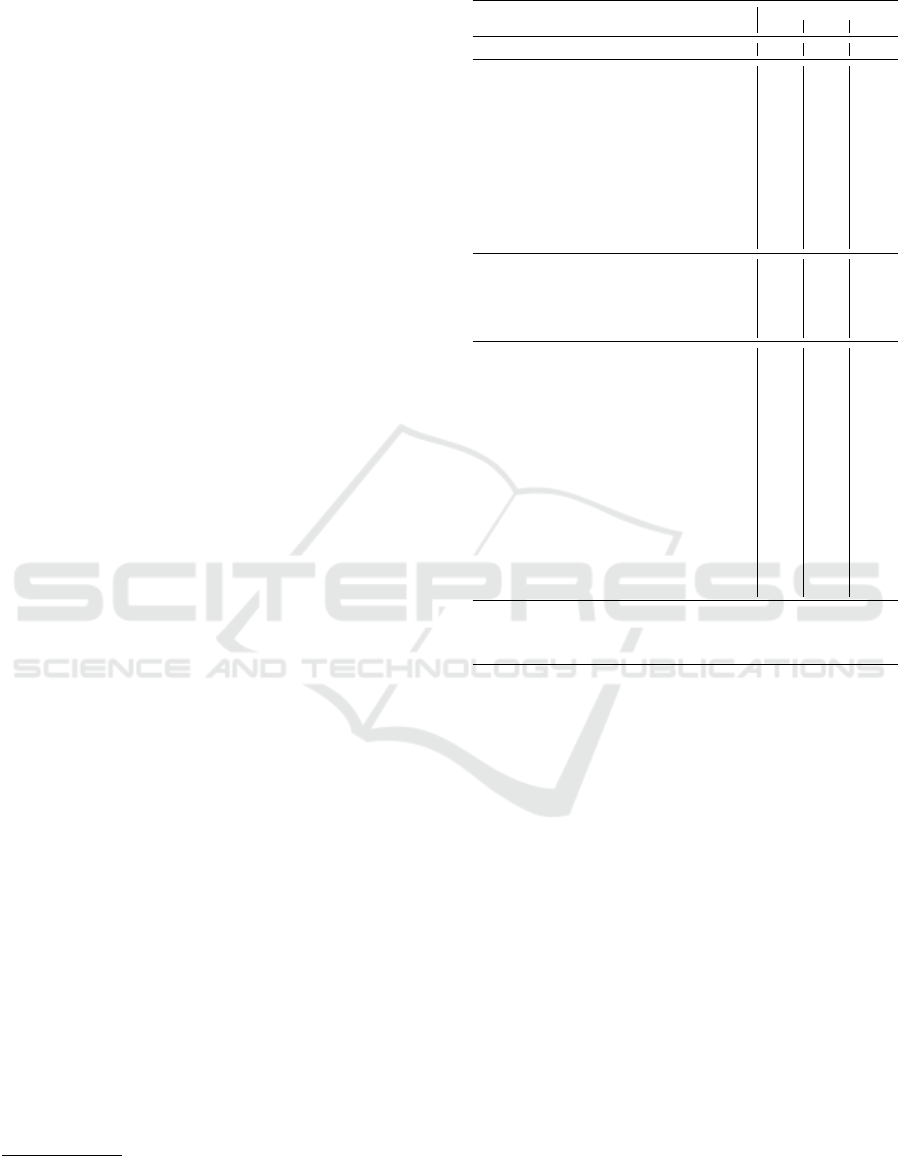
Table 1: Summary characteristics of the systems.
System Version Date CF NOP NOC LOC
CODE ANALYSIS
Checkstyle
1
: Coding
standard
checker
5.3 2010-10-19 SF 22 360 23,045
5.5 2011-11-05 SF 22 364 23,369
5.6 2012-09-18 SF 22 364 23,416
5.7 2014-02-03 GH 22 368 23,891
5.8 2014-10-05 GH 22 380 25,727
6.14.1 2015-12-30 GH 24 482 28,056
Classycle
2
:
Dependency
analyser and checker
1.1.1 2005-06-05 SF 7 82 3,936
1.3.1 2007-05-12 SF 7 87 4,503
1.3.3 2008-05-24 SF 7 92 4,658
1.4 2011-04-10 SF 7 100 5,007
1.4.1 2012-09-10 SF 7 101 5,057
1.4.2 2014-11-01 SF 7 104 5,117
WEB CRAWLER
Heritrix
3
:
Extensible,
web-scale,
qualitative,
web-crawler
2.0.2 2008-11-08 SF 14 168 14,791
3.0.0 2009-12-05 SF 17 184 15,272
3.1.0 2011-10-21 SF 17 175 15,226
3.1.1 2012-08-08 GH 17 175 15,366
3.2.0 2014-01-11 GH 18 184 15,367
Master 2016-01-21 GH 18 181 15,318
Web
Harvest
4
:
Web data
extraction
tool
0.26 2006-09-28 SF 11 104 4,090
0.261 2006-10-12 SF 11 104 4,090
0.3 2006-10-27 SF 11 104 4,126
0.5 2007-01-16 SF 12 108 4,416
1.0 2007-10-17 SF 15 248 10,977
2.0 2010-02-17 SF 18 355 19,090
ORM
Hibernate
5
:
Idiomatic
persistence
for Java and
DB
3.0.1 2007-06-29 SF 51 969 69,557
3.5.0 2010-03-31 SF 166 2,448 107,972
3.6.0 CR2 2010-09-29 SF 173 2,677 132,295
3.6.0 F 2010-10-13 GH 173 2,678 132,751
3.6.2 F 2011-03-10 GH 173 2,699 133,771
5.0.5 2015-12-03 GH 189 3,148 213,094
OrmLite
6
:
Lightweight
Object
Relational
Mapping
4.22 2011-05-19 SF 11 156 8,527
4.29 2011-10-25 SF 11 161 10,287
4.37 2012-03-21 SF 11 160 11,241
4.41 2012-06-06 SF 11 167 11,729
4.48 2013-12-16 SF 11 177 12,699
4.49 S 2015-02-18 SF 11 193 13,307
Legend GH: GitHub; SF: Sourceforge.
1
http://checkstyle.sourceforge.net/
2
http://classycle.sourceforge.net/
3
https://webarchive.jira.com/wiki/display/Heritrix
4
http://web-harvest.sourceforge.net/
5
http://hibernate.org/orm/
6
http://ormlite.com/
have inter-repository dependency problems prohibit-
ing their automatic installation.
3 EXPERIMENT SETUP
For this experiment, we selected six projects from
three domains, reported in Table 1: Code Analysis,
Web Crawler, ORM. The table reports also the an-
alyzed versions (and the respective date), the cor-
responding code forge (CF), number of packages
(NOP), classes (NOC) and lines of code (LOC).
Moreover, projects have been chosen to be compile-
ready and with binaries, to avoid errors during the
analysis made by the tools. The projects are written
in Java and the analyzed versions are available at their
respective code forge.
ENASE 2017 - 12th International Conference on Evaluation of Novel Approaches to Software Engineering
294
In each domain, one project migrated to GitHub.
We selected six versions of each project. For the mi-
grated projects, three versions are before and three
are after the migration. In this way, we have more
chances to understand if the differences among ver-
sions are related to the migration or if they originate
from the natural evolution of the projects. In fact, se-
lecting only one version (before and after migration)
may lead to inaccurate conclusions.
For the extraction of quality indicators we applied
different tools. We applied Understand
3
(UN) to ex-
tract 19 metrics. We extracted 19 code smells (Lanza
and Marinescu, 2006) using inFusion (IF), and vi-
olations to coding rules using FindBugs
4
(FB) and
SonarQube
5
(SQ). Code smells are synthoms of code
or design problems that can be removed through
refactoring (Fowler, 1999). In this paper, we refer to
issues for SonarQube results, and to bugs for Find-
Bugs results, for brevity. For FB, we consider the To-
tal number of bugs detected in each version. As for
SQ, we consider the number of issues detected in each
severity level (Info, Minor, Major, Critical, Blocker)
and the Total number of detected issues. Refer to Ta-
ble 2 for the complete list of quality indicators.
On each version, we extract the quality indicators.
For each indicator, we then compare the results of the
six versions, at each level of granularity, e.g., pack-
age, class.
To understand if indicators had a significant trend,
we represent the six versions of the analyzed projects
as six points in a time series, and apply the Mann-
Kendall test, in the implementation provided by the
R “Kendall” package. To compute trends, we con-
sider metric values and the number of code smells, is-
sues and bugs at each granularity. Table 3 reports the
detectable trends and the settings we applied (Aziz
et al., 2003) to associate the statistic values to trends.
The trends extracted on the considered quality indi-
cators are an estimation of the trend in the quality of
the project. Since the considered quality indicators
have higher values when the quality is poorer, the ex-
tracted trends have to be read with inverse meaning:
an increasing trend is a signal of decreasing quality,
and viceversa. The trends are: Increasing, Decreas-
ing and Stable. If a trend is not recognised we named
this case No Trend.
Table 2 reports, for each project, the measured
trends for all measures. It is evident the prevalence
of no trend outcomes (–). To address our research
questions we provide a focused analysis, comparing
1) projects which migrated or not to GitHub, and
3
https://scitools.com/
4
http://findbugs.sourceforge.net/
5
http://www.sonarqube.org/
Table 2: Trends extracted on all projects.
Trends by project
Tool Name G CH CL HI OR HE WE
FB Total s I – – S – I
IF Blob class c D D – – I –
IF Blob operation m – D – D – –
IF Data class c – D D – I D
IF Data clumps m – D – – – D
IF Distorted Hierarchy c S S – S S S
IF External duplication m – S – – – D*
IF Feature envy m – S D S – –
IF God class c – S – S – I*
IF Intensive coupling m S S – S – –
IF Internal duplication m S S – S – I*
IF Refused parent bequest c S S D* S – I*
IF Schizophrenic class c S S D S S –
IF Sibling duplication m S S – S S S
IF Tradition breaker c S S – S S S
SQ Blocker s – – S D* I* I*
SQ Critical s – – I – S I
SQ Major s S I* I I – I
SQ Minor s – I I I S I
SQ Info s D* – I – S D
SQ Total s – I* I I S I
UN CountClassBase c – I D – – –
UN CountClassCoupled c I I* D – I I
UN CountClassDerived c – – D – D D*
UN CountDeclInstanceMethod c I – D I – I
UN CountDeclInstanceVariable c I – D – – I*
UN CountDeclInstanceVariable f I – D* I* – I*
UN CountDeclInstanceVariable p I I S I D –
UN CountDeclMethodAll c – – D I I I
UN CountOutput m – – – D – I
UN CountPath m – – S – – I
UN MaxInheritanceTree c – – D I* I I*
UN MaxNesting c – – D – – –
UN MaxNesting f I I* D* – I –
UN MaxNesting m – – – – D I
UN MaxNesting p – – – I – –
UN PercentLackOfCohesion c I D S – – I
UN SumCyclomatic c I – D I – I
UN SumCyclomatic f I – – I – I
UN SumCyclomatic p I I S I S –
Legend G: Granularity; m: Method; c: Class; p: Package; s: System; f: File;
Projects: CH: Checkstyle; CL: Classycle; HI: Hibernate; OR: OrmLite;
HE: Heritrix; WE: WebHarvest.
2) the domains of the projects.
In Table 4, we report the counts of each trend on
the different project domains, while in Table 5 we re-
port the counts on projects migrated to GitHub and the
ones that did not migrate. In both tables, code smells
are grouped according to their granularity (class or
method), and metrics are grouped based on the quality
dimension they refer to (Cohesion, Coupling, Com-
plexity, Size) (Chidamber and Kemerer, 1994).
4 RESULTS
In the following, we discuss the results we obtained
regarding metrics, code smells, bugs and issues. With
respct to the domain of the projects, ORM projects
have increasing trends mainly on issues and metrics.
Increasing trends of code smells are registered only
for Crawler projects. Higher numbers of decreasing
trends are registered for metrics of ORM projects.
Does the Migration to GitHub Relate to Internal Software Quality?
295
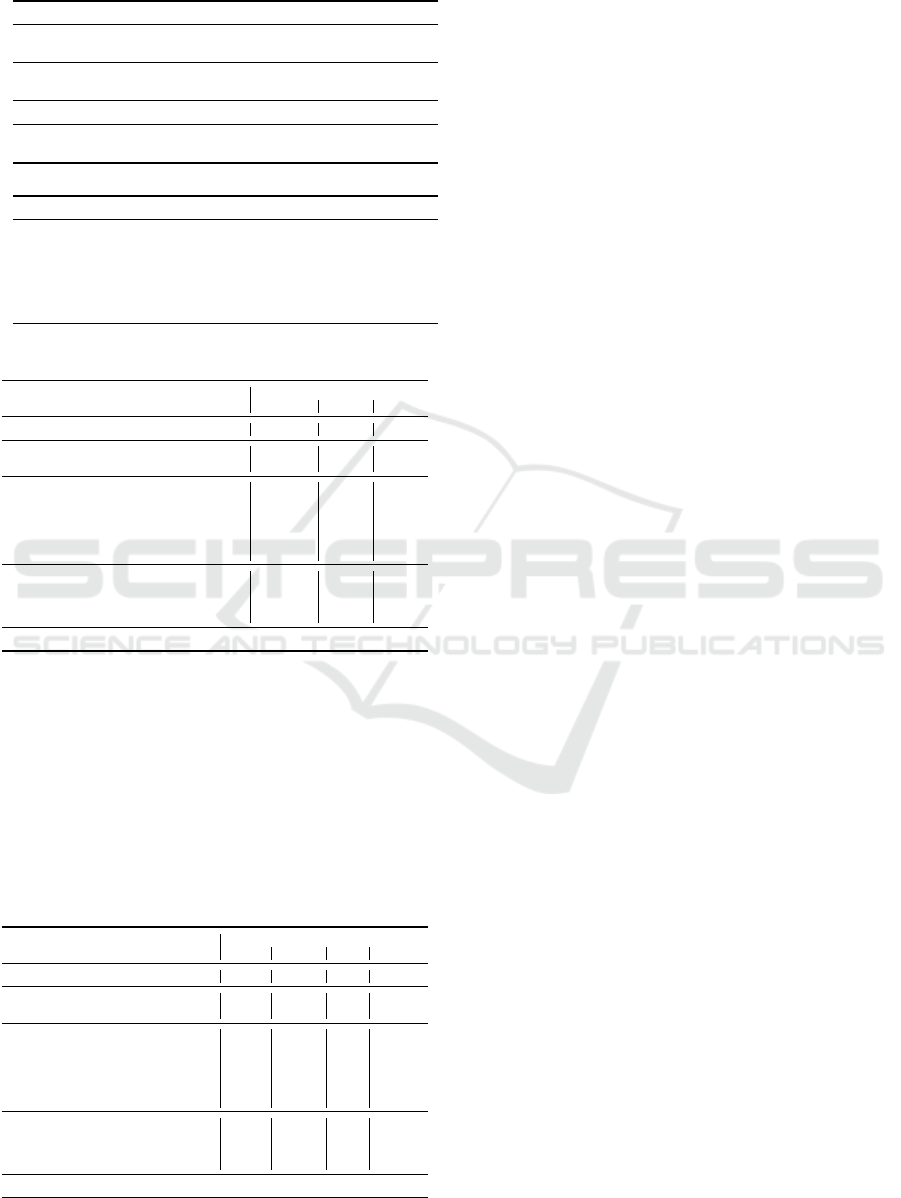
Table 3: Mann-Kendall test setup.
(a) Statistical metrics of time series trend
Trend Statistic Confidence in Trend
I: Increasing S > 0 (sl ≤ 0.05)
I*: Probably Increasing S > 0 (0.05 ≤ sl ≤ 0.1)
–: No Trend S > 0 (sl ≥ 0.10)
–: No Trend S ≤ 0 (sl ≥ 0.10 ∩COV ≥ 1)
S: Stable S ≤ 0 (COV < 1 ∩ sl ≥ 0.1)
D: Decreasing S < 0 (sl ≤ 0.05)
D*: Probably Decreasing S < 0 (0.05 ≤ sl ≤ 0.1)
(b) Legend for statistical notation of trend definition
Variable Description Formula
sl two-sided p-value
S Kendall Score
D denominator
tau Kendalls tau statistic tau = S/D
varS variance of S
average average of the series
COV covariance varS/average
Table 4: Trends summary by domain.
Analysis Crawler ORM
Type Grouped by I D S – I D S – I D S –
Bug Total 1 0 0 1 1 0 0 1 0 0 1 1
Code smell Class 0 3 10 3 4 1 5 6 0 3 0 6
Code smell Method 0 2 7 3 1 2 2 7 0 1 0 8
Issue Blocker 0 0 0 2 2 0 0 0 0 0 0 0
Issue Critical 0 0 0 2 1 0 1 0 1 0 1 1
Issue Major 0 0 1 0 1 0 0 1 2 0 2 0
Issue Minor 1 0 0 1 1 0 1 0 2 0 2 0
Issue Info 0 1 0 1 0 1 1 0 1 0 1 1
Issue Total 0 0 0 1 1 0 1 0 2 0 2 0
Metric Cohesion 1 1 0 0 1 0 0 1 0 0 0 1
Metric Coupling 2 0 0 5 3 2 0 3 0 4 0 4
Metric Complexity 5 0 0 12 7 1 1 9 4 3 5 7
Metric Size 5 0 0 5 5 1 0 4 3 3 4 1
Legend I: Increase; D: Decrease; S: Stable; –: No Trend.
4.1 Metrics Evaluation
Increasing trends are overall higher in projects not mi-
grated to GitHub, and are nearly double in the case of
Coupling, Complexity and Size metrics. Metrics de-
creasing trends are higher in migrated projects, conse-
quently. Stable metrics trends exist only for migrated
Table 5: Trends summary for migrated vs non-migrated
projects.
Increase Decrease Stable No Trend
Type Grouped by M ¬M M ¬M M ¬M M ¬M
Bug Total 1 1 0 0 0 1 2 1
Code smell Class 2 2 5 3 7 14 10 5
Code smell Method 0 1 0 5 4 8 14 4
Issue Blocker 1 1 0 1 1 0 1 1
Issue Critical 1 1 0 0 1 0 1 2
Issue Major 1 3 0 0 1 0 1 0
Issue Minor 1 3 0 0 1 0 1 0
Issue Info 1 0 1 1 1 0 0 2
Issue Total 1 3 0 0 1 0 1 0
Metric Cohesion 1 1 0 1 1 0 1 1
Metric Coupling 2 4 4 2 0 0 6 6
Metric Complexity 6 12 5 0 3 0 13 15
Metric Size 5 9 5 0 1 0 4 6
Legend M: Migrated; ¬M: not Migrated.
projects for cohesion, complexity and size quality di-
mensions.
From Table 4, we found few differences, mostly in
the ORM domain, which displays decreasing trends.
This is caused by Hibernate, which is the only
project that presents a decreasing trend for all met-
rics. Checkstyle had the opposite result. These two
projects both migrated to GitHub. In addition, Hi-
bernate and OrmLite belong to the same domain, but
still have opposite trends. Checkstyle and Classycle
register an increasing trend for all the metrics, with
the exception of PercentLackOfCohesion in Classy-
cle. Both projects display an increasing trend for size
metrics. Heritrix does not have a unique trend for
its metrics. In particular, there is no trend in its size
metrics. Heritrix and WebHarvest trends look similar,
with a difference in the MaxNesting metric at method
level, where the two projects have opposite trends.
4.2 Code Smells Evaluation
From Table 2, we can see the high number of stable
and no trend results. Checkstyle and Classycle (both
in the Analysis domain) have comparable trends for
the same code smells. The same behavior is present
among Heritrix and WebHarvest, but it presents an
increasing trend for Data Class in Heritrix, while a
decreasing trend is registered for WebHarvest. Hiber-
nate has a decreasing presence of code smells, and
behaves opposite than the other projects and in par-
ticular from OrmLite, which belongs to the same do-
main.
4.3 Issues Evaluation
We observed a decreasing trend of Blocker issues
only for OrmLite and a decreasing trend of Info is-
sue in Checkstyle and WebHarvest. It is important to
outline that, in both Tables 4–5, a significant number
of issues display an increasing trend. This increase is
contributed especially by Classycle, Hibernate, Orm-
Lite and WebHarvest.
4.4 Bugs Evaluation
Bugs display a recognizable trend in only few cases.
The total number of bugs increase for Checkstyle and
WebHarvest. No decrease trend has been found in
our dataset. Migration does not affect consistently the
trends in the number of detected bugs.
ENASE 2017 - 12th International Conference on Evaluation of Novel Approaches to Software Engineering
296

5 THREATS TO VALIDITY
In our analysis, we have considered 3 projects mi-
grated to GitHub in different domains. For each of
them, we have considered 6 releases. Since the sam-
ple is not large, this represents a possible threat to ex-
ternal validity. We have also selected one project for
each domain that did not migrate to GitHub. Finding
non-migrated projects is difficult, and they are usually
small or not maintained, but in future analysis we aim
to significantly increase bith the number of projects
and domains. As a threat to internal validity, we can
consider the selection of the versions to be analyzed.
The selection of 6 versions lets us measure the evolu-
tion (regarding the measured features) the project had
before and after switching to the new platform, but it
could be less accurate than considering the whole re-
lease history or every commit of the project’s reposi-
tory. Moreover, we have not considered several other
factors that can have an impact on the validity of our
works, as the number of people added or removed
from the projects, possible changes in the architec-
ture or the development processes and in the adoption
of different approached to release planning.
6 CONCLUSIONS AND FUTURE
WORK
In this paper, we evaluate different quality measures
on six projects. Three projects out of six migrated to
GitHub. We want to verify if GitHub allows to build
software of better quality, taking into account differ-
ent quality indicators.
We can observe that no consistent improvement
nor deterioration occurred in the different projects,
suggesting that perhaps the new platform does not
have a particular effect on the internal quality of
source code. In fact, our analyses reported some
hints, e.g., metrics decreased more in non-migrated
projects, and code smells are mostly stable or without
trend. These hints are explained by some peculiari-
ties in the datasets. First, Hibernate received a major
release that increased the overall quality of the code,
due to some large restructuring of the project. This
led to the extraction of decreasing trends in metrics.
Second, code smells detection resulted in low density
of code smells on most projects. This is the cause of
the high number of stable trends for code smells, i.e.,
the number of code smells is stable to 0.
From these observations, we can answer our re-
search questions.
RQ1 As for RQ1, the migration to GitHub does not
result in a consistent trend of the considered qual-
ity indicators. Projects that did not migrate dis-
played a larger increase of issues only, but this
is not enough to claim an actual difference in the
overall quality.
RQ2 With respect to RQ2, ORM projects received
a higher number of decreasing trends of code
smells and metrics. However, we cannot say that a
project domain has better internal quality than the
others since Hibernate influenced these results.
For future developments, we aim to extend the ex-
perimentation to a larger set of projects, versions and
in particular on projects of different domanins. We
would like to measure the effect of the code forge
on other dimensions of FLOSS development, e.g.,
the speed of development or bug resolution (Jarczyk
et al., 2014). It will be also interesting to confirm
previous findings (Arcoverde et al., 2011) saying that
smells removal is often avoided, by comparing smells
removal before and after the migration. Moreover, it
could be interesting to conduct a survey polling the
developers’ quality expectations from the migration,
and then check whether these expectations came true.
REFERENCES
Alexandre Decan, Tom Mens, Philippe Grosjean, and
Maelick Claes (2016). When GitHub meets CRAN:
An Analysis of Inter-Repository Package Dependency
Problems. In 23rd IEEE Intern. Conf. on Software
Analysis, Evolution, and Reengineering (SANER),
Suita-City, Osaka, Japan. IEEE.
Arcoverde, R., Garcia, A., and Figueiredo, E. (2011). Un-
derstanding the longevity of code smells: Preliminary
results of an explanatory survey. In Proc. of the 4th
Work. on Refactoring Tools (WRT ’11), pages 33–36,
Honolulu, HI, USA. ACM.
Aziz, J. J., Ling, M., Rifai, H. S., Newell, C. J., and Gon-
zales, J. R. (2003). MAROS: A decision support sys-
tem for optimizing monitoring plans. Ground Water,
41(3):355–367.
Borges, H., Hora, A. C., and Valente, M. T. (2016). Un-
derstanding the factors that impact the popularity of
GitHub repositories. In 2016 IEEE Intern. Conf. on
Soft. Maint. and Evolution, ICSME 2016, Raleigh,
NC, USA, October 2-7, 2016, pages 334–344.
Chidamber, S. R. and Kemerer, C. F. (1994). A metrics
suite for object oriented design. IEEE Transactions
on Software Engineering, 20(6):476–493.
Dias, L. F., Steinmacher, I., Pinto, G., da Costa, D. A., and
Gerosa, M. A. (2016). How does the shift to GitHub
impact project collaboration? In 2016 IEEE Intern.
Conf. on Soft. Maint. and Evolution, ICSME 2016,
Raleigh, NC, USA, October 2-7, 2016, pages 473–
477.
Feliciano, J., Storey, M. D., and Zagalsky, A. (2016). Stu-
dent experiences using GitHub in software engineer-
Does the Migration to GitHub Relate to Internal Software Quality?
297

ing courses: a case study. In Proc. of the 38th Intern.
Conf. on Software Engineering, ICSE 2016, Austin,
TX, USA, May 14-22, 2016 - Companion Volume,
pages 422–431.
Fowler, M. (1999). Refactoring: Improving the Design of
Existing Code. Addison-Wesley.
Jarczyk, O., Gruszka, B., Jaroszewicz, S., Bukowski, L.,
and Wierzbicki, A. (2014). GitHub projects. Quality
analysis of open-source software. In Social Informat-
ics, volume 8851 of LNCS, pages 80–94. Springer.
Lanza, M. and Marinescu, R. (2006). Object-Oriented Met-
rics in Practice. Springer-Verlag.
Michaud, H. M., Guarnera, D. T., Collard, M. L., and
Maletic, J. I. (2016). Recovering commit branch of
origin from GitHub repositories. In 2016 IEEE Intern.
Conf. on Soft. Maint. and Evolution, ICSME 2016,
Raleigh, NC, USA, October 2-7, 2016, pages 290–
300.
Rahman, M. M., Roy, C. K., and Collins, J. A. (2016).
Correct: code reviewer recommendation in GitHub
based on cross-project and technology experience. In
Proc. of the 38th Intern. Conf. on Software Engineer-
ing, ICSE 2016, Austin, TX, USA, May 14-22, 2016 -
Companion Volume, pages 222–231.
Vasilescu, B., Van Schuylenburg, S., Wulms, J., Serebrenik,
A., and van den Brand, M. (2014). Continuous inte-
gration in a social-coding world: Empirical evidence
from GitHub. In IEEE International Conference on
Software Maintenance and Evolution (ICSME 2014),
pages 401–405, Victoria, BC, Canada. IEEE.
Vendome, C., Linares-V
´
asquez, M., Bavota, G., Di Penta,
M., German, D., and Poshyvanyk, D. (2015). License
usage and changes: A largescale study of java projects
on GitHub. In Proceedings of the 23rd IEEE Interna-
tional Conference on Program Comprehension (ICPC
2015), Florence, Italy. IEEE.
Yu, L., Mishra, A., and Mishra, D. (2014). An empirical
study of the dynamics of GitHub repository and its
impact on distributed software development. In On
the Move to Meaningful Internet Systems: OTM 2014
Workshops, volume 8842 of Lecture Notes in Com-
puter Science, pages 457–466. Springer Berlin Hei-
delberg.
Zagalsky, A., Feliciano, J., Storey, M. D., Zhao, Y., and
Wang, W. (2015). The emergence of GitHub as a
collaborative platform for education. In Proc.s of the
18th ACM Conf. on Computer Supported Cooperative
Work & Social Computing, CSCW 2015, Vancouver,
BC, Canada, March, pages 1906–1917.
APPENDIX
In this appendix we report three tables. Table 6(a) re-
ports the sum of the size metrics and the maximum
values of inheritance metrics, and Table 6(b) shows
the mean of Understand metrics. Table 7 shows the
number of issues, code smells and bugs. Table 8
shows the legend of all the tables in the Appendix.
ENASE 2017 - 12th International Conference on Evaluation of Novel Approaches to Software Engineering
298
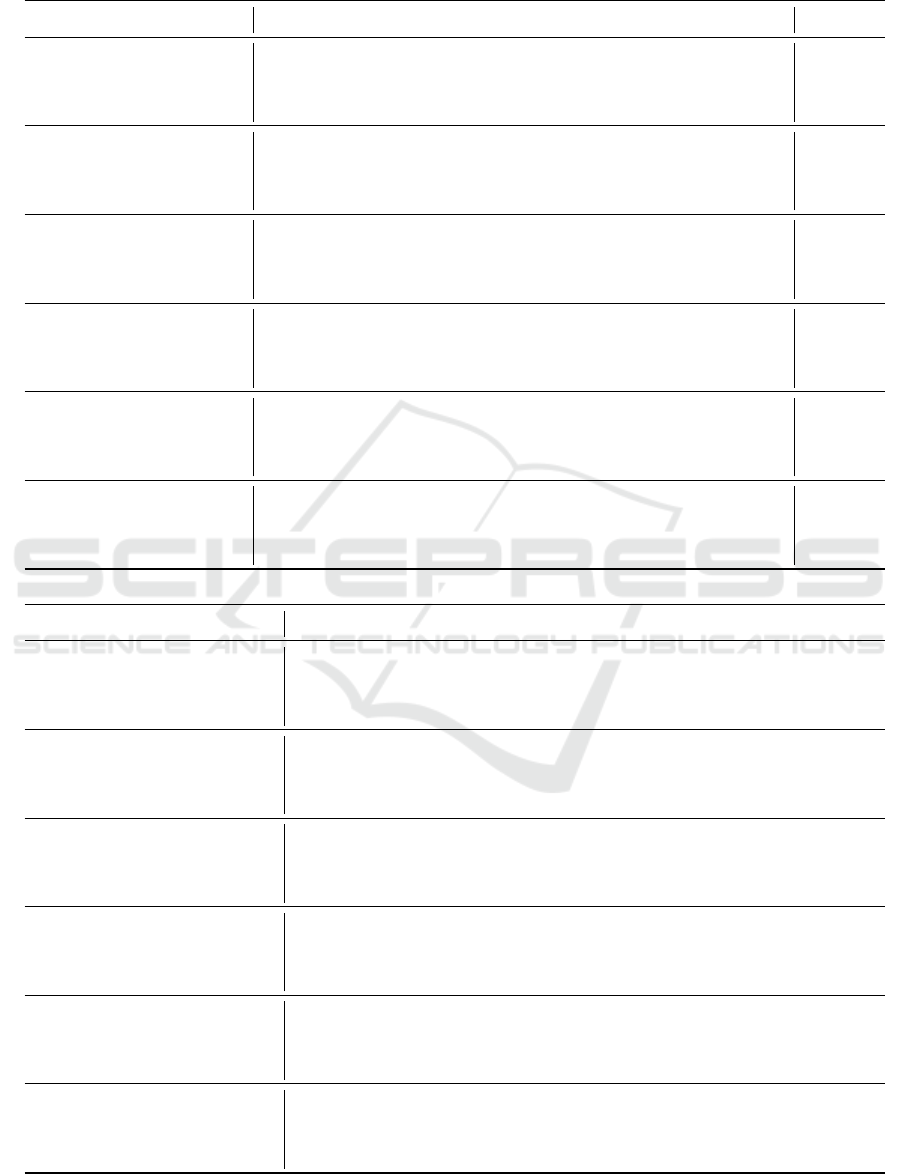
Table 6: All size metrics data.
(a) Sum of all size metrics and Max for inheritance metrics
Sum Max
Project SCDIM SCP SCO SCDMA SCCD SCCC SCCB SPLOC SMITN SSC SCDIV MMN MMIT
Checkstyle-5.3 1880 7180 6660 16000 227 2040 366 14100 951 4030 599 6 7
Checkstyle-5.5 1900 7250 6740 16100 227 2080 370 14400 956 4090 614 6 7
Checkstyle-5.6 1900 7250 6760 16000 226 2090 370 14500 953 4090 620 6 7
Checkstyle-5.7 1930 8290 6920 16300 230 2130 375 14900 967 4190 628 6 7
Checkstyle-5.8 2040 9000 7420 17000 241 2220 387 15700 1010 4520 668 6 7
Checkstyle-6.14.1 2390 6080 9470 18600 250 2500 407 21000 1020 5360 826 5 6
Classycle-1.1.1 367 953 1430 1450 53 432 96 2690 116 732 138 6 3
Classycle-1.3.1 398 1110 1600 1550 56 493 104 2850 121 816 156 5 3
Classycle-1.3.3 412 1150 1660 1630 57 518 111 2920 129 842 162 5 3
Classycle-1.4.0 451 1210 1780 1770 63 568 123 3140 137 909 173 6 3
Classycle-1.4.1 452 1260 1770 1780 63 586 125 3110 138 918 172 6 3
Classycle-1.4.2 460 1270 1800 1830 66 593 128 3180 144 930 177 6 3
Hibernate-3.0 8950 1510000 30200 33800 724 8690 1370 31100 1640 15100 2120 7 7
Hibernate-3.5.0 13000 6.79E8 44900 53600 1140 13300 2170 46600 2540 22600 3010 8 8
Hibernate-3.6.0 CR2 15100 1.14E8 53700 63100 1390 16400 2780 65900 2940 27400 3580 8 8
Hibernate-3.6.0 F 15100 1.14E8 53800 63100 1390 16400 2780 66000 2940 27400 3580 8 8
Hibernate-3.6.2 F 15100 1.21E8 54100 63800 1410 16500 2830 66100 2970 27600 3600 8 8
Hibernate-5.0.5 23600 6.61E7 78500 101000 2720 30000 5390 119000 5140 40800 5930 8 8
OrmLite-4.22 1020 31700 3220 3630 113 1200 341 6080 215 1900 263 5 4
OrmLite-4.29 1220 4.76E8 3890 4150 112 1350 391 6720 225 2340 284 6 4
OrmLite-4.37 1400 1.01E9 4330 4520 118 1390 405 7020 267 2610 305 6 4
OrmLite-4.41 1460 1.01E9 4510 4820 122 1440 421 7170 283 2730 313 6 5
OrmLite-4.48 1600 1.07E9 4840 5090 124 1520 438 7600 290 2990 343 6 5
OrmLite-4.49 S 1690 1.0E9 5090 5580 127 1600 463 8190 327 3120 359 6 5
Heritrix-2.0.2 1330 596000 5440 4500 75 1260 282 7860 269 2850 438 7 5
Heritrix-3.0.0 1410 4470000 5700 4780 73 1380 295 8550 311 2900 457 7 4
Heritrix-3.1.0 1410 1.19E7 5740 4690 64 1380 295 8570 302 2900 453 7 4
Heritrix-3.1.1 1410 2.37E7 5770 4710 64 1390 295 8580 302 2900 453 7 4
Heritrix-3.2.0 1450 9590000 5860 5220 64 1500 307 8970 324 2920 468 7 4
Heritrix-Master 1460 9590000 5810 5190 63 1480 304 8830 319 2930 477 7 4
WebHarvest-0.26 393 1420 1690 2820 69 686 110 1730 209 833 123 7 5
WebHarvest-0.26.1 393 1420 1690 2820 69 686 110 1730 209 833 123 7 5
WebHarvest-0.3 395 1540 1700 2820 69 689 110 1740 209 839 125 7 5
WebHarvest-0.5 422 1680 1830 2990 72 743 115 2040 221 905 131 7 5
WebHarvest-1.0 989 90100 4620 22300 93 1880 330 5830 501 2160 434 9 6
WebHarvest-2.0 1610 1450000 7720 43600 138 2830 470 8240 816 3940 553 9 8
(b) All Means Metrics data
Mean
Project MCDIM MCP MCO MCDMA MCCD MCCC MCCB MPLOC MMIT MSC MMN MCDIV CMN
Checkstyle-5.3 5.66 3.6 3.34 48.1 0.684 6.16 1.1 42.4 2.86 12.2 1.46 1.8 332
Checkstyle-5.5 5.66 3.59 3.34 47.8 0.676 6.19 1.1 43 2.85 12.2 1.48 1.83 336
Checkstyle-5.6 5.67 3.59 3.35 47.7 0.673 6.23 1.1 43.1 2.84 12.2 1.48 1.85 336
Checkstyle-5.7 5.66 4.04 3.37 47.8 0.676 6.26 1.1 43.7 2.84 12.3 1.48 1.85 340
Checkstyle-5.8 5.8 4.13 3.41 48.2 0.685 6.32 1.1 44.5 2.88 12.8 1.52 1.9 352
Checkstyle-6.14.1 6.4 2.15 3.35 49.7 0.668 6.67 1.09 56.1 2.73 14.3 1.45 2.21 374
Classycle-1.1.1 4.48 2.42 3.64 17.7 0.646 5.27 1.17 32.9 1.41 8.93 1.24 1.68 82
Classycle-1.3.1 4.57 2.62 3.77 17.8 0.644 5.67 1.2 32.7 1.39 9.38 1.3 1.79 87
Classycle-1.3.3 4.48 2.6 3.76 17.7 0.62 5.63 1.21 31.7 1.4 9.15 1.3 1.76 92
Classycle-1.4.0 4.51 2.53 3.71 17.7 0.63 5.68 1.23 31.4 1.37 9.09 1.32 1.73 100
Classycle-1.4.1 4.48 2.6 3.68 17.6 0.624 5.8 1.24 30.8 1.37 9.09 1.31 1.7 101
Classycle-1.4.2 4.42 2.59 3.67 17.6 0.635 5.7 1.23 30.5 1.38 8.94 1.28 1.7 104
Hibernate-3.0 9.38 159 3.17 35.4 0.759 9.11 1.44 32.6 1.72 15.8 1.04 2.22 954
Hibernate-3.5.0 8.55 49000 3.24 35.1 0.748 8.74 1.42 30.6 1.66 14.8 1.02 1.97 1530
Hibernate-3.6.0 CR2 7.33 7090 3.34 30.7 0.678 7.97 1.35 32.1 1.43 13.3 0.872 1.74 2050
Hibernate-3.6.0 F 7.33 7080 3.34 30.7 0.677 7.98 1.35 32.1 1.43 13.3 0.874 1.74 2060
Hibernate-3.6.2 F 7.24 7470 3.35 30.5 0.675 7.92 1.35 31.7 1.42 13.2 0.862 1.72 2090
Hibernate-5.0.5 5.86 2650 3.15 25 0.674 7.45 1.34 29.4 1.27 10.1 0.672 1.47 4030
OrmLite-4.22 3.3 27.8 2.83 11.7 0.366 3.89 1.1 19.7 0.696 6.16 0.447 0.851 309
OrmLite-4.29 3.34 354000 2.89 11.4 0.308 3.72 1.07 18.5 0.618 6.44 0.456 0.78 364
OrmLite-4.37 3.76 657000 2.82 12.2 0.318 3.74 1.09 18.9 0.72 7.03 0.461 0.822 371
OrmLite-4.41 3.84 627000 2.79 12.6 0.32 3.77 1.1 18.8 0.743 7.17 0.462 0.822 381
OrmLite-4.48 4.02 607000 2.76 12.8 0.311 3.8 1.1 19 0.727 7.5 0.461 0.86 399
OrmLite-4.49 S 4.01 543000 2.76 13.3 0.302 3.79 1.1 19.5 0.777 7.4 0.454 0.853 421
Heritrix-2.0.2 7.86 420 3.83 26.6 0.444 7.44 1.67 46.5 1.59 16.9 1.19 2.59 169
Heritrix-3.0.0 7.68 3010 3.84 26.1 0.399 7.54 1.61 46.7 1.7 15.8 1.32 2.5 183
Heritrix-3.1.0 8.1 8030 3.86 27 0.368 7.95 1.7 49.3 1.74 16.6 1.32 2.6 174
Heritrix-3.1.1 8.13 15900 3.86 27.1 0.368 7.98 1.7 49.3 1.74 16.7 1.31 2.6 174
Heritrix-3.2.0 7.92 6260 3.83 28.5 0.35 8.17 1.68 49 1.77 16 1.31 2.56 183
Heritrix-Master 8.04 6230 3.78 28.7 0.348 8.18 1.68 48.8 1.76 16.2 1.32 2.64 181
WebHarvest-0.26 3.82 3.28 3.91 27.4 0.67 6.66 1.07 16.8 2.03 8.09 1.04 1.19 103
WebHarvest-0.26.1 3.82 3.28 3.91 27.4 0.67 6.66 1.07 16.8 2.03 8.09 1.04 1.19 103
WebHarvest-0.3 3.83 3.54 3.92 27.4 0.67 6.69 1.07 16.9 2.03 8.15 1.04 1.21 103
WebHarvest-0.5 3.91 3.64 3.97 27.7 0.667 6.88 1.06 18.9 2.05 8.38 1.03 1.21 108
WebHarvest-1.0 4.02 84.9 4.36 90.4 0.378 7.65 1.34 23.7 2.04 8.78 1.15 1.76 246
WebHarvest-2.0 4.51 827 4.4 122 0.387 7.92 1.32 23.1 2.29 11 1.37 1.55 357
Does the Migration to GitHub Relate to Internal Software Quality?
299
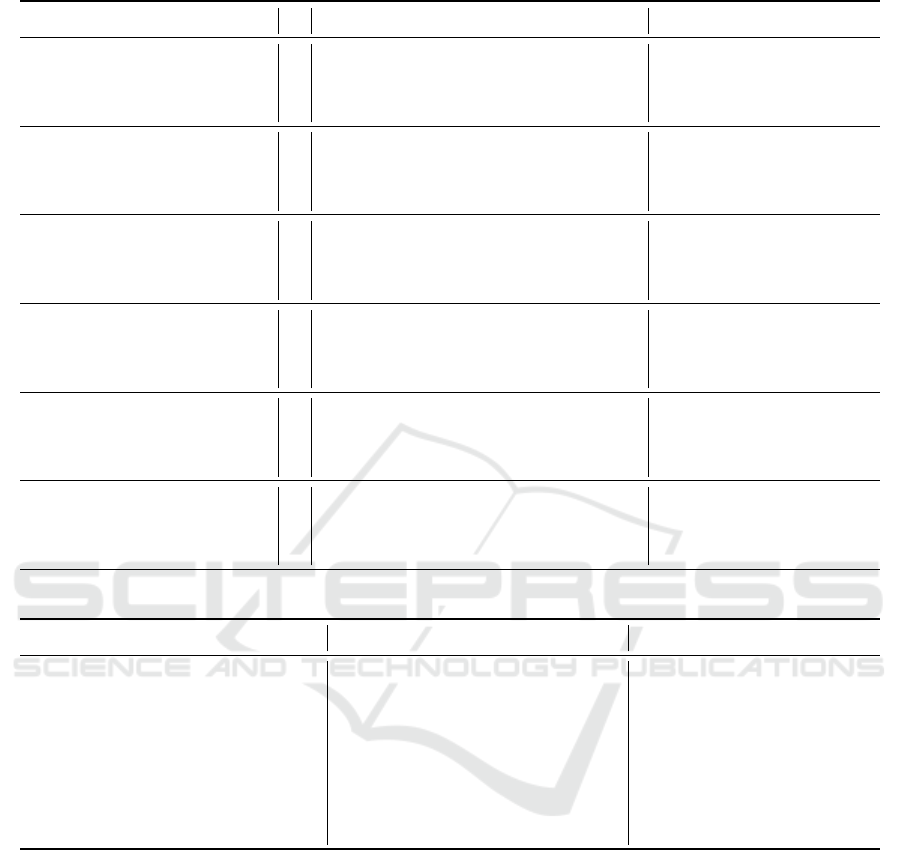
Table 7: All code violations found by FindBugs, inFusion and SonarQube.
Bugs Code Smells Issues
Project Total BO DCLU BC DC ED FE GC IC ID RPB SC SD TB DH Blocker Critical Major Minor Info Total
Checkstyle-5.3 215 2 4 1 1 4 0 0 0 0 0 0 0 0 0 1 54 428 250 67 800
Checkstyle-5.5 224 2 4 1 8 1 4 0 0 0 0 0 0 0 0 1 56 423 254 67 801
Checkstyle-5.6 224 2 4 1 8 1 4 0 0 0 0 0 0 0 0 1 56 423 254 67 801
Checkstyle-5.7 227 3 5 1 8 1 4 0 0 0 0 0 0 0 0 1 62 419 254 67 803
Checkstyle-5.8 231 4 6 1 8 1 4 0 0 0 0 0 0 0 0 1 64 461 263 66 855
Checkstyle-6.14.1 283 4 9 1 1 17 1 1 0 0 0 0 0 0 0 0 24 225 2 23 274
Classycle-1.1.1 42 2 3 2 1 0 0 0 0 0 0 0 0 0 0 2 7 120 165 0 294
Classycle-1.3.1 42 2 3 2 1 0 0 0 0 0 0 0 0 0 0 2 8 133 197 1 341
Classycle-1.3.3 44 2 3 2 1 0 0 0 0 0 0 0 0 0 0 2 8 139 203 0 352
Classycle-1.4.0 52 2 3 2 1 0 0 0 0 0 0 0 0 0 0 2 9 146 218 0 375
Classycle-1.4.1 51 2 3 2 1 0 0 0 0 0 0 0 0 0 0 1 8 140 218 0 367
Classycle-1.4.2 51 2 3 2 1 0 0 0 0 0 0 0 0 0 0 1 8 140 223 0 372
Hibernate-3.0 1182 19 47 1 26 2 8 20 8 2 1 11 0 0 0 38 352 2132 2554 316 5392
Hibernate-3.5.0 2058 16 64 2 20 0 15 5 0 2 1 6 8 1 0 93 524 2952 2772 500 6841
Hibernate-3.6.0 CR2 2321 30 90 4 13 3 12 10 2 9 0 8 8 0 0 92 567 3700 3346 690 8395
Hibernate-3.6.0 F 2321 31 90 4 13 3 12 10 1 9 0 8 8 0 0 92 567 3709 3353 695 8416
Hibernate-3.6.2 F 2325 31 90 4 13 0 12 10 1 9 0 8 8 0 0 92 576 3727 3353 702 8450
Hibernate-5.0.5 2174 11 75 1 10 2 3 2 0 10 0 4 12 2 1 83 750 4307 3753 790 9683
OrmLite-4.22 73 1 10 0 0 0 0 0 0 0 0 0 0 0 0 1 46 91 295 6 439
OrmLite-4.29 66 1 10 1 2 0 0 0 0 0 0 0 0 0 0 1 44 191 371 3 610
OrmLite-4.37 73 1 23 1 2 0 0 0 0 0 0 0 0 0 0 1 46 209 403 3 662
OrmLite-4.41 75 1 23 1 2 0 0 0 0 0 0 0 0 0 0 0 49 222 422 13 706
OrmLite-4.48 72 1 23 1 2 1 0 0 0 0 0 0 0 0 0 0 56 240 443 17 756
OrmLite-4.49 S 72 1 23 1 3 0 0 0 0 0 0 0 0 0 0 0 33 248 478 17 776
Heritrix-2.0.2 208 2 6 0 0 0 0 0 0 0 0 0 0 0 0 2 185 537 473 110 1307
Heritrix-3.0.0 178 1 7 4 2 2 4 2 2 1 0 0 0 0 0 3 174 594 476 133 1380
Heritrix-3.1.0 170 1 6 5 2 4 4 1 2 2 1 0 0 0 0 3 155 599 454 116 1327
Heritrix-3.1.1 172 1 6 5 2 4 4 1 2 2 1 0 0 0 0 3 157 598 462 114 1334
Heritrix-3.2.0 181 4 7 6 4 3 1 2 3 1 1 0 0 0 0 3 160 587 459 116 1325
Heritrix-Master 184 4 7 6 4 3 1 2 3 1 1 0 0 0 0 4 162 588 461 111 1326
WebHarvest-0.26 49 2 5 2 5 1 1 0 0 0 0 0 0 0 0 0 21 203 120 3 347
WebHarvest-0.26.1 49 2 5 2 5 1 1 0 0 0 0 0 0 0 0 0 21 203 120 3 347
WebHarvest-0.3 50 2 5 2 5 1 1 0 0 0 0 0 0 0 0 0 22 203 121 3 349
WebHarvest-0.5 50 4 5 2 5 1 0 0 0 0 0 0 0 0 0 0 23 210 134 2 369
WebHarvest-1.0 133 1 7 12 4 2 1 2 5 1 1 0 0 0 0 2 111 548 205 1 867
WebHarvest-2.0 264 1 8 14 2 4 3 3 1 8 2 3 0 0 0 3 199 1114 344 1 1661
Table 8: Legend of Tables 6(b)-6(a)-7.
Legend Table 6(b) Legend Table 6(a) Legend Table 7
Acronym Metric Acronym Metric Acronym Code Smell
MCDIM MeanCountDeclInstanceMethod SCDIM SumCountDeclInstanceMethod BO Blob operation
MCP MeanCountPath SCP SumCountPath DCLU Data clumps
MCO MeanCountOutput SCO SumCountOutput BC Blob class
MCDMA MeanCountDeclMethodAll SCDMA SumCountDeclMethodAll DC Data class
MCCD MeanCountClassDerived SCCD SumCountClassDerived ED External duplication
MCCC MeanCountClassCoupled SCCC SumCountClassCoupled FE Feature envy
MCCB MeanCountClassBase SCCB SumCountClassBase GC God class
MPLOC MeanPercentLackOfCohesion SPLOC SumPercentLackOfCohesion IC Intensive coupling
MMIT MeanMaxInheritanceTree SSC SumSumCyclomatic ID Internal duplication
MSC MeanSumCyclomatic SMIT SumMaxInheritanceTree RPB Refused parent bequest
MMN MeanMaxNesting SMN SumMaxNesting SC Schizophrenic class
MCDIV MeanCountDeclInstanceVariable SCDIV SumCountDeclInstanceVariable SD Sibling duplication
CMN CountMaxNesting MMIT MaxMaxInheritanceTree TB Tradition breaker
MMN MaxMaxNesting DH Distorted Hierarchy
ENASE 2017 - 12th International Conference on Evaluation of Novel Approaches to Software Engineering
300
