
Towards Interactive Data Processing and Analytics
Putting the Human in the Center of the Loop
Michael Behringer, Pascal Hirmer and Bernhard Mitschang
Institute of Parallel and Distributed Systems, University of Stuttgart, Universit
¨
atsstraße 38, D-70569 Stuttgart, Germany
Keywords:
Visual Analytics, Human In The Loop, Interactive Analysis.
Abstract:
Today, it is increasingly important for companies to evaluate data and use the information contained. In prac-
tice, this is however a great challenge, especially for domain users that lack the necessary technical knowledge.
However, analyses prefabricated by technical experts do not provide the necessary flexibility and are often-
times only implemented by the IT department if there is sufficient demand. Concepts like Visual Analytics
or Self-Service Business Intelligence involve the user in the analysis process and try to reduce the technical
requirements. However, these approaches either only cover specific application areas or they do not consider
the entire analysis process. In this paper, we present an extended Visual Analytics process, which puts the user
at the center of the analysis. Based on a use case scenario, requirements for this process are determined and,
later on, a possible application for this scenario is discussed that emphasizes the benefits of our approach.
1 INTRODUCTION
In the last two years, more than 90% of all data was
produced
1
and it will even double every 20 to 24
months in the future (Maimon and Rokach, 2010;
EMC Corporation, 2014). For the year 2020, a vol-
ume of 44 trillion gigabytes is expected (EMC Cor-
poration, 2014). However, it must be stated that most
of the data is transient (Gantz and Reinsel, 2012) and
it is no longer a problem to acquire or store data, but
rather to make sense out of it (Keim et al., 2008).
Unfortunately, this is anything but trivial – based on
studies, only between 0.5% and 5% of data is cur-
rently analyzed (Gantz and Reinsel, 2012; EMC Cor-
poration, 2014). On the one hand, this is the case be-
cause the human perception and analysis capacity re-
mains largely constant while the data volume has ex-
ploded (Puolam
¨
aki et al., 2010; Maimon and Rokach,
2010). On the other hand, automatic algorithms
lack human intuition or background knowledge (Puo-
lam
¨
aki et al., 2010) and therefore have problems with
semantic correlation (Kemper et al., 2010). Further-
more, the demand for end user-specific, customized
analyses has to be taken into account since analyses
are usually implemented and made available by tech-
nical experts.
In the last decade, different approaches were intro-
1
http://www.ibm.com/software/data/bigdata/what-is-
big-data.html
duced to cope with this issue. Famous representatives
are Visual Analytics (VA) (Thomas and Cook, 2005)
and Self Service Business Intelligence (SSBI) (Imhoff
and White, 2011). These approaches both aim at
more interactivity in the analysis process and there-
fore better, i.e. more specific, results, as well as
more functionality for non-expert users. They are,
however, very different in their characteristics. Vi-
sual Analytics exploits the respective strengths of all
parties involved and therefore combines human per-
ception with huge computational power as described
by the Visual Analytics Mantra “analyze first, zoom
and filter, analyze further, details on demand” (Keim
et al., 2006). In contrast, the main goal of Self Ser-
vice Business Intelligence is to “generate exactly the
reports [the users] want, when they want them” (Eck-
erson, 2009) and, as a consequence, to gain faster
results through bypassing the IT department. Con-
sequently, the process can be accelerated up to sev-
eral months (Eckerson, 2009). Furthermore, there are
huge differences in the supported functionality. Vi-
sual Analytics solutions are mostly designed to solve
a specific problem (Keim et al., 2010), while SSBI
solutions make use of the Visual Analytics principles
but are oftentimes limited to selecting parameters,
changing attributes, or following a predefined navi-
gation path (Stodder, 2015; Eckerson, 2009). Hence,
these approaches do not provide an acceptable solu-
tion to the described problem. Nonetheless the princi-
Behringer, M., Hirmer, P. and Mitschang, B.
Towards Interactive Data Processing and Analytics - Putting the Human in the Center of the Loop.
DOI: 10.5220/0006326300870096
In Proceedings of the 19th International Conference on Enterprise Information Systems (ICEIS 2017) - Volume 3, pages 87-96
ISBN: 978-989-758-249-3
Copyright © 2017 by SCITEPRESS – Science and Technology Publications, Lda. All rights reserved
87
Black Box
IT Department
a
Data Source A
(Data Warehouse)
Data Source B
(verified)
Preprocessing Analytics Reporting
f h
g
b
c d e
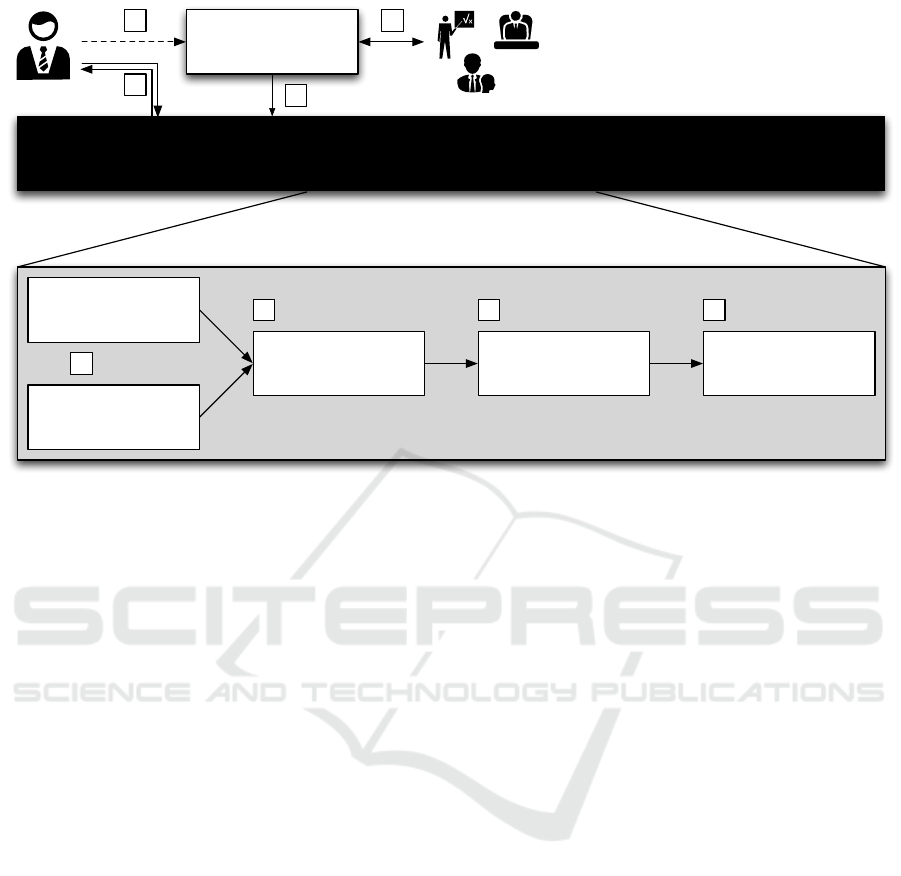
Figure 1: Motivating scenario: Conventional, predefined analysis process using a black box.
ple of the human in the loop, or nowadays extended to
the human is the loop (Endert et al., 2014), is manda-
tory for both approaches. However, the amount of
human interaction is not exactly defined.
Our contribution to tackle the above mentioned is-
sues is an approach towards an extended Visual Ana-
lytics process, which illustrates all steps from the ex-
ploration and selection of data sources, data prepa-
ration and cleaning, and data mining, to report and
knowledge generation. By doing so, we integrate
the basic Visual Analytics principle – the recurring
change between visual and automatic methods – in an
adjusted Knowledge Discovery in Databases (KDD)
process (Fayyad et al., 1996) – a well-established ap-
proach for data analysis. We further intend to sup-
port domain users by ensuring that they know and un-
derstand the characteristics of data during analysis, as
well as the complete analysis process itself, i.e., why
and how the result is achieved. We evaluate our ex-
tended process against requirements derived from an
application scenario.
The remainder of this paper is structured as fol-
lows: In Sect. 2, we introduce a motivating scenario
and derive different requirements for our approach. In
Sect. 3, we present the main contribution of our pa-
per: we illustrate and explain an extended Visual An-
alytics process with strong involvement of the user.
In Sect. 4, the capabilities and limitations of our ex-
tended Visual Analytics process are evaluated and dis-
cussed. Section 5 describes related work and princi-
ples used by our approach. Finally, Sect. 6 summa-
rizes the results of the paper and gives an outlook to
our future work.
2 MOTIVATING SCENARIO AND
REQUIREMENTS
As an example scenario (cf. Figure 1), we assume a
domain expert who is aiming at the integration and
analysis of different data sources with subsequent re-
port generation. In a conventional analysis approach,
the IT department offers predefined reports which are
either created based on time or on demand. The user
can access these reports by using specialized tools or
protocols (a). In this scenario, the analysis need to
integrate two data sources (b), apply different opera-
tions to preprocess the data (c), conduct analytics (d)
and finally generate a report for stakeholders (e). If
no report is available for his or her purposes, the end
user has to send a request to the IT department (f). If
there is enough demand, this analysis will be imple-
mented as a predefined report for the future (g) after
negotiations and coordination of various stakeholders
(h). However, in this scenario, the user cannot be sure
that the analysis can be realized on time. The user
is also severely restricted in the selection of the data
sources, since only verified data sources are available.
Nevertheless, our scenario should support the analy-
sis of two data sources, a data warehouse as well as a
third-party data source. If the latter is specified di-
ICEIS 2017 - 19th International Conference on Enterprise Information Systems
88

rectly by a domain expert a conventional approach
is unsuitable. Thus, if we consider a domain expert
with basic knowledge in conducting analyses – but
no coding experience – then this user’s ability to an-
alyze data is limited to predefined reports, which is
neither motivation-promoting nor satisfactory. We as-
sume further that this domain expert has some new
hypotheses for profitable analysis which are not met
by the available reports and is therefore interested in
conducting a custom analysis. For this group of do-
main experts, it is necessary to accelerate this process
by enabling them to conduct their custom analyses.
Therefore, it is mandatory to entrust the control over
the complete analysis to the domain expert. On this
basis, we derive requirements which have to be ful-
filled by the user-centric analysis process we aim for:
(R1) Put the User in Charge. The first requirement
for a user-centric data analysis process is to give the
domain expert full control over the process. The users
know about their intentions and expectations and are
therefore the best authority to steer the process to ful-
fill their goals. This control includes every step of
the analysis from the selection of the data sources
to the compilation of the results. As a consequence,
this may lead to increased development of creativity
as well as to exploitation of the implicit background
knowledge of the domain expert.
(R2) Explorative Character. In contrast to conven-
tional analysis, the data characteristics can change
more often due to countless combinations of data
sources or operations. As a consequence, one of the
most important factors for a successful and satisfac-
tory analysis is to have deeper knowledge of the data.
This knowledge may determine new ideas for possible
analysis goals. Therefore, it is mandatory to explore
the data in each step and probe different parameters
and settings. In this context, it is important that the
primary goal is no longer rapid analysis of data, but
much more the generation of new hypotheses.
(R3) Reduction of Complexity. If the target user
is not a technical expert, it is necessary to reduce the
complexity of utilized algorithms to the core concepts
and expected results instead of specifying parameters
with unclear effects. By doing so, an abstraction from
technical details, such as data formats, data sources,
or data analysis algorithms, needs to be provided.
This helps non-technical domain experts with creat-
ing analysis they are interested in without any deep
knowledge of data processing necessary.
(R4) Balance of Techniques. As mentioned in the
introduction, different extents of integration between
interactive visualization and automatic techniques are
possible and should be combined in a way that re-
spects the other requirements. To fulfill this princi-
ple, it should be up to the user to decide which extent
of automation or integration he prefers. Furthermore,
it is mandatory to switch between techniques or al-
gorithms as long as the user is not satisfied with the
result.
(R5) Generic Approach. Finally, it is necessary
to cope with different domains and data sources
and, therefore, a generic approach is required.
Consequently, we need generic connectors to data
sources and/or a chaining of different operations in
data preprocessing, e.g., text mining in a first step to
deal with unstructured data. This requires concepts
such as Pipes and Filters (Meunier, 1995), common
interfaces or a uniform data exchange format. If a
certain domain is completely unsupported, the user
should still be able to integrate new visualizations
or algorithms to the system on his own and include
them in the analysis.
We use these requirements as foundation of our
extended Visual Analytics process, which can cope
with the aforementioned issues and turns the above
described black box towards an analysis white box.
3 INTERACTIVE DATA
PROCESSING AND ANALYTICS
In this section, we introduce an extended Visual An-
alytics process to enable user-centric analysis, which
is focused on various tasks during the analysis. This
does not affect the generality of the Visual Analyt-
ics process as the work by Sacha et al. (Sacha et al.,
2014) still fits for our process. The central idea of this
process is to exploit the basic principle of Visual Ana-
lytics: the continuous alternation between interaction
in the visual interface, and background recalculation
and adaption. This concept – referred to as Visual
Analytics principle (VAP) in the context of this pa-
per – should not only be used after model building
in the knowledge discovery process or visualization
pipeline, but rather in each step of the analysis pro-
cess, from data exploration and selection, up to re-
port generation, which leads to an overarching pro-
cess model.
Towards Interactive Data Processing and Analytics - Putting the Human in the Center of the Loop
89

Analytics
Reporting
Data Source
Interactive Visualization
Preprocessing
automatic
interactive
automatic
interactive
automaticinteractive
automatic
interactive
select
& configure
explore &
select data
create
access to
develop
clean &
filter data
select
& steer
generate
& consume
generate
report
implement
statistical
methods
Feedback
Feedback
Feedback
Feedback
1
2
3
4
5
Figure 2: Data Analytics Process extended with interactive elements.
3.1 Target User
We are aware that this approach is not suitable for
each kind of user. In the process, we do not differen-
tiate between domain and technical users for generic
reasons. But in practice, we should give the user some
help to reduce the complexity without losing func-
tionality. Eckerson (Eckerson, 2009), for example,
splits SSBI users into two types: power users and
casual users. While both of these users are domain
experts with different technical knowledge, there is
additionally a technical expert. This kind of user is
able to create the analysis process without visual in-
terfaces and is therefore not targeted in our process.
However, the technical expert is still important to re-
duce the threshold for inexperienced users as s/he
has deep knowledge about technical issues and there-
fore can create new data sources or operations. This
should be realizable by a power user as well, e.g.,
through a visual user interface. Nonetheless, there is
a need for predefined data sources for common sce-
narios, e.g., database connections or access to web
APIs like Twitter. The above mentioned casual user is
usually satisfied with predefined reports or the oppor-
tunity to change visualization or analyzed attributes.
As a consequence, the power user as defined by Eck-
erson (Eckerson, 2009) is the target for our process as
this user is limited in current approaches, having ba-
sic knowledge about data mining techniques or data
characteristics but no programming skills.
ICEIS 2017 - 19th International Conference on Enterprise Information Systems
90

3.2 User-centric Analysis Process
In this section, we introduce a first approach towards
a user-centric analysis process by describing which
steps need to be conducted and which concepts are
necessary. By doing so, the Visual Analytics process
is extended with interactive elements. The schematic
process is illustrated in Figure 2 and consists of the
following main components:
Data Source. In the first phase, a user is expected to
select or configure a data source based on his or her
analysis goals. A domain expert is not expected to
be able to configure this data source in detail, which
is why preliminary work of a technical expert is nec-
essary in this step, e.g., specifying functionality for
different file types is done by a technical expert and
the selection of the file by the domain expert.
Interactive Visualization. The interactive visual-
ization of the data source also belongs to the first
phase of the analysis. In this step, a user is ex-
pected to explore different data sources to get a feel-
ing for the characteristics of the data set, such as
quality, trustworthiness, volume and content. To ful-
fill this requirement, we need an appropriate visual-
ization approach, which allows the domain expert to
evaluate the contained data, e.g., with respect to cor-
rectness, correlation or even trustworthiness based on
prior knowledge. Correspondingly, a suitable visu-
alization is required for the respective data source,
which in turn is supported by external experts, e.g.,
psychologists, who contribute their expertise of hu-
man perception. Furthermore, various possibilities
should be implemented which allow the user to ex-
amine the data under different aspects. After this step,
the user should, firstly, know whether the data is suit-
able for the analysis and, secondly, in the best case,
can recognize initial patterns.
Preprocessing. The second phase is targeting the
previously selected data. It is undisputed that data
has to be preprocessed in regard to the analysis goals.
This step should allow the user to create new values
by combination as well as calculation or reshaping,
discarding inconsistent attributes, and removing out-
liers or noise. Furthermore, for subsequent analysis
through data mining, usually a single data set is nec-
essary. As a consequence, there is a need for schema
matching and integration of different data sources. If
necessary, this step could be split even further, e.g.,
in specialized sub-processes like filtering, cleaning,
transformation or merging. In addition, interactive
text mining approaches might be inevitable to struc-
ture text data and move on in the analysis. As in the
previous steps, external expertise is required, in which
case statistical methods can help to identify outliers
or to obtain descriptive values for the data set. In
this step, the VAP could be implemented, for exam-
ple, by the use of the programming by demonstra-
tion (Cypher, 1993) concept, which allows the user
to work with a small subset of data and use the gen-
erated rules on the complete data set. The other way
around, automatic methods could be used to notify the
user, e.g., about likely incorrect values or conflicts in
the data set.
Analytics. This phase involves all operations to find
patterns in the data. For this step, a large collection
of different approaches is available either from Visual
Analytics or Visual Data Mining, but with focus to
a selected application domain. As we need concepts
for a generic approach, a possible way to realize this
is to present the core idea of the analysis, e.g. cluster-
ing, and then utilize different algorithms/parameters
to present the user an overview of possible results to
evaluate. In the next iterations, the results could be
increasingly refined. In this phase as well, external
experts are needed to implement the algorithms and
develop appropriate visualizations. The VAP could be
used in the way as classified in (Bertini and Lalanne,
2009). However, we expect that an integrated ap-
proach, which has no predominant role of one of the
techniques, i.e. visualization or automatic methods,
leads to the best results.
Reporting. After execution of an analysis, the re-
sults oftentimes need to be distributed to stakehold-
ers and, therefore, we need a step which creates vi-
sualized reports. In this context, we consider differ-
ent possible scenarios. Firstly, this kind of analysis
is expected to fit for personal purposes. Therefore,
obtained results could be used to create or extend a
personal analysis dashboard. Secondly, report gener-
ation for the management is important if there are ob-
tained patterns which are considered relevant for the
company. In both these scenarios, the domain expert
can use the VAP, e.g., through interactive or more ex-
tensively created custom visualizations like demon-
strated in SSBI software. Finally, if the conducted
analysis is not only useful for a single user or is of-
ten recurring, it could be useful to attract the attention
of the IT department to implement this analysis as a
predefined report. In this case, the report has to con-
tain every step and all parameters executed during the
analysis. This could lead to a knowledge transfer from
end users to developers (Daniel and Matera, 2014).
Towards Interactive Data Processing and Analytics - Putting the Human in the Center of the Loop
91

Feedback Loop. As the domain expert is not ex-
pected to find an optimal analysis result at the first
try, we need to implement a feedback loop and wran-
gling, the “process of iterative data exploration and
transformation that enables analysis” (Kandel et al.,
2011a). Therefore, it must be ensured that a user is
relieved of routine tasks, e.g., if only a change in the
analytics step is necessary, all configurations of the
precedent nodes have to remain. Hence, we need a
“rule generation system” for each node, which reap-
plies the user action on a new pass. Such a rule is gen-
erated by analyzing the conducted user actions. In the
other direction, a change in the data selection should
be continued within the existing processing steps and
the user should only be involved in case of a conflict.
This concept ensures that a user is only involved in
necessary steps while, at the same time, interaction in
each step is, in principle, possible.
4 CASE STUDY
In Section 2, we describe a possible scenario for our
approach and derive five requirements, which have to
be fulfilled to enable user-centric analysis. In this sec-
tion, we evaluate our introduced extended Visual An-
alytics process against the deducted requirements by
applying this process to our scenario – resulting in
a white box analysis as illustrated in Figure 3. The
above-mentioned steps are in detail:
1) Data Source Selection. The first step is the eval-
uation of data sources (a) to decide which ones are
suitable and should be used for analysis. For example,
in our scenario (cf. Section 2), there is one data source
which is connected to a consolidated, on-premise data
warehouse (b) and could therefore be used as initial
reference. Furthermore, a third-party off-premise data
source (c) with unclear trustworthiness is expected to
share a subset with the verified one. In contrast to a
conventional approach, the user is obligated to eval-
uate the data sources in order to obtain reliable anal-
ysis results. Consequently, the data sources can be
individually evaluated, as well as compared in a visu-
alization, for example, to check the trustworthiness of
the third-party data source. This second data source
could either be selected by the domain expert based
on specifying parameters like API keys, or preconfig-
ured by technical experts but without any guarantees
to fit for this analysis. This concept relieves the do-
main users from being stuck to a preselected number
of data sources and enables a generic solution.
2) Data Exploration. For data exploration (a) in
step 2, we use visualizations that aim for different
goals. In the depicted scenario, the third-party data
source has to be verified through comparison with the
verified one, e.g., using an overlay to evaluate whether
the expectation about subsets are correct or if another
data source is necessary. Furthermore, visualizations
should be used to provide information about charac-
teristics of the data set and, therefore, enable the pro-
posed better understanding of the data to be analyzed.
In this step, we need a (semi-)automatic recognition
of the content to select an appropriate visualization
and, furthermore, the option to filter the data. More-
over, we apply the VAP to enable the domain experts
to filter the data based on their expectations and goals.
3) Data Integration. In the integration step (d), we
need to support the user in different ways, e.g., by
schema integration as well as cleaning and transfor-
mation operations. This could be achieved, e.g., by
a programming-by-example approach in which the
data is visualized (most likely as a table view) and
the user’s attention is led to problematic parts in the
data, e.g., to outliers or erroneous entries. Further-
more, the work of Kandel et al. (Kandel et al., 2011b)
shows how operations could be implemented in this
context. Furthermore, if data sources are merged, a
schema integration is necessary which should be ac-
complished with as much support as possible using
automated methods. This requires interactive schema
integration and cleaning as described before in differ-
ent approaches (Chiticariu et al., 2008; Raman and
Hellerstein, 2001).
4) Data Analysis. In this step (e), we apply differ-
ent data mining methods preferably in an interactive
manner. This includes attribute selection and also a
wide range of approaches from the areas of Visual
Analytics and Visualization to steer the model build-
ing and/or to communicate the results. We can repeat
this step multiple times to create different analysis re-
sults and gain more knowledge out of the data.
5) Report Creation. Finally, it is necessary to com-
municate the created insights (f) and how they are re-
trieved. This is useful in different ways. First, the user
can get an overview of accomplished steps and the re-
trieved results. The latter could also be prepared for
management purposes. Second, this could be used to
create recommendations for actions of the IT depart-
ment, e.g., hints about demanded (prospective prede-
fined) reports.
ICEIS 2017 - 19th International Conference on Enterprise Information Systems
92

Data Source A
(Data Warehouse)
Data Source B
(Third-Party)
Exploration & Selection
Exploration & Selection
Preprocessing Analytics Reporting
automaticinteractive
automaticinteractive
automaticinteractive automaticinteractive automaticinteractive
Exploration & Selection
b
c
a
d e f
Figure 3: Motivating scenario based on our introduced process.
The first requirement (R1) describes the user as cen-
tral role in the analysis process, which is the core prin-
ciple we build our extended Visual Analytics process
on. In this process, the user has full control over each
step – and even in selecting the sequence of execu-
tion, e.g., using data mashups (Daniel and Matera,
2014). The next requirement is to set the process in
the context of exploration (R2). We achieve this by
integrating the user in each part of the analysis and
allow changing parameters and interaction. Further-
more, we can use the rule generation to propagate a
change in one step to all dependent steps. This con-
cept is very powerful as it allows the user to perform
various analyses over several steps with little effort.
The next two requirements are in some kind related.
If we put the user in the loop, it is easy to see that the
user can control how extensive the combination be-
tween automatic and interactive methods (R4) is ex-
ecuted. However, this requirement is dependent to a
satisfying complexity reduction (R3). As our process
does not specify how exactly the steps have to be im-
plemented, it is unclear to which extent the complex-
ity of a selected algorithm can be reduced. Finally, if
we use a data mashup approach such as the one intro-
duced by Hirmer et al. (Hirmer and Mitschang, 2016;
Hirmer et al., 2015; Hirmer and Behringer, 2017) for
the process, it is very generic (R5) as the user is able
to combine single services/algorithms to a compre-
hensive analysis process.
This approach also allows the user to raise the
feedback loop to a new level, for example by simply
re-executing individual nodes and evaluating the cor-
responding result immediately. This refined result can
afterwards be automatically propagated to subsequent
nodes and the user can be involved in case of conflicts.
Thus, both the recalculation and the workload of the
domain expert can be reduced. Such an implemen-
tation would fit well for implementing the feedback
loop presented in the process, whereby the user must
be informed of the current status at all times.
In summary, our process is able to fulfill most
of the requirements (R1,R2,R3,R5) in an extensive
way, while in particular, R2,R3 support the domain
expert in conducting customized analysis. However,
the complexity reduction (R4) has to be evaluated for
each algorithm applied.
Nonetheless there are still some limitations in our
approach. First, a generic approach could never be as
well-fitting as a specialized implementation for a se-
lected domain. Second, it is not a trivial problem to
select an appropriate visualization based on generic
incoming data. Third, the number of possible interac-
tion techniques and algorithms is unmanageable and
leads to a trade-off between functionality and simplic-
ity. Furthermore, we expect mental reservation in IT
departments as it is still rather unusual to allow end
users to specify their own reports from scratch, even
if this is an emerging area as can be seen in Self Ser-
vice Business Intelligence. Stodder et al. (Stodder,
2015) identify possible conflicts, e.g., changes in con-
ventional, project-oriented workflows of an IT depart-
ment or data security and governance concerns. This
could lead to the fact that there is no longer a Sin-
gle Point of Truth, which means that information is
only stored in a single location. Last but not least,
this kind of analysis process requires more time than
a more automated method and depends very strong on
the domain expert and his or her discipline in evaluat-
ing every aspect of the data. According to Pirolli and
Card (Pirolli and Card, 2005), there is a bias, which
means that patterns are ignored or data is selected and
filtered to fit for a specific analysis goal.
Towards Interactive Data Processing and Analytics - Putting the Human in the Center of the Loop
93

5 RELATED WORK
Highly related to our work is the KDD process, origi-
nally introduced by Fayyad et al. (Fayyad et al., 1996)
over 20 years ago. This process describes different
steps to gain knowledge from data in a structured way,
e.g., by data selection, data cleaning or data mining.
The implementation of this process is usually done
by technical experts based on background knowledge
provided by domain experts. As a consequence, this
process oftentimes becomes a black-box to end users
unable to communicate the circumstances of pattern
recognition and model creation. Furthermore, the
background knowledge of the end user, i.e. the ana-
lyst, is not considered during the process (Puolam
¨
aki
et al., 2010). Nonetheless, the Knowledge Discov-
ery process can cope with large amounts of data or
generic application domains and therefore is the way
to go for well-understood problems. In contrast, the
research area of visualization tackles human percep-
tion for a better and faster communication of analy-
sis results. The process to create a visualization is
described by the visualization pipeline (Card et al.,
1999) and contains, e.g., filtering, mapping or render-
ing. In these steps, data is filtered to receive a subset,
which is mapped to shapes and attributes and is often-
times rendered to an image in order to build a mean-
ingful visualization. This approach can be summa-
rized by the Information Seeking Mantra “Overview
first, zoom and filter, then details-on-demand” as de-
fined by Shneiderman (Shneiderman, 1996). Visual
Analytics aims at a combination of these two pro-
cesses by combining their respective strengths – hu-
man perception and the processing power of ma-
chines.
The most recent Visual Analytics process by
Sacha et al. (Sacha et al., 2014), derived from mul-
tiple other processes and integrated to the most exten-
sive one we could find, specifies all stages in which
a user could steer the analysis process. Yet, the fo-
cus of Visual Analytics is cooperation of visualization
and underlying model, while data preprocessing (or
more generic the KDD process) is steered by chang-
ing parameters. We think that each of these steps
should also be supported through ongoing alternation
between automatic and visual methods and not only
by changing parameters.
For Self Service Business Intelligence, the con-
cept of different levels, respecting the task, is com-
mon, e.g., access to reports, creating new reports or
even creating new information sources (Alpar and
Schulz, 2016), while most steps are still undertaken
by IT (Stodder, 2015). In principle, this is not surpris-
ing, since companies oftentimes use a data warehouse
and, thus, a central, managed data storage. As a con-
sequence, in practice, Self Service Business Intelli-
gence is in most cases focused on creating and modi-
fying reports and lacks the possibility for end users to
add data sources or to apply data mining algorithms.
Since 2005, when Thomas and Cook (Thomas and
Cook, 2005) introduced the concept of Visual Ana-
lytics, different processes to invoke these principles
have been published and range from human-centered
processes (Pirolli and Card, 2005; Thomas and Cook,
2005) to stateful, system-driven processes (Keim
et al., 2008; Bertini and Lalanne, 2009; B
¨
ogl et al.,
2013). While the former describes how an ana-
lyst makes sense (out of data) by creating hypothe-
ses and derive actions, the latter depicts different
states, relationships and possible interactions. Sacha
et al. (Sacha et al., 2014) combine both components
to the currently most extensive Visual Analytics pro-
cess. The process is split into a computer part with
the characteristic linkage between Visualization and
Model, as well as one for the process of human per-
ception. In this paper, we focus on the computer part
and therefore skip the process of human perception.
The computer part consists of 3 major steps, namely
Data, Model and Visualization. In short, the data has
to be preprocessed and afterwards has to be either
mapped to visualizations or used to generate models.
By doing so, a close coupling between a visual inter-
face and the underlying model takes place which al-
lows users to update and evaluate the model through
visual controls.
The above-mentioned integration of the analyst
into the analysis is commonly referred to as “Hu-
man in the Loop” or more recently uncompromising
as “the Human is the Loop” (Endert et al., 2014)
and shows clearly the central role of the analyst
in controlling the analysis process. The integration
of the user could be reached on different extends,
e.g., in Enhanced Mining, Enhanced Viusalization
or Integrated Visualization and Mining (Bertini and
Lalanne, 2009).
6 SUMMARY AND OUTLOOK
In this paper, we present an approach towards an ex-
tended Visual Analytics process, which puts the user
in the center during each step of the analysis pro-
cess. This process extends available schematic mod-
els (of Visual Analytics) to a more practically appli-
cable one by utilization of the core principle, the re-
curring switching between automatic and interactive
techniques. Furthermore, we introduce a real-world
scenario and derive requirements which are fulfilled
ICEIS 2017 - 19th International Conference on Enterprise Information Systems
94

by our process. Our interpretation should be seen as a
possible extension of other Visual Analytics pipelines
and not as a replacement, because this approach offers
the most extensive user integration we could find dur-
ing extensive literature research. As a consequence,
this approach depends crucially on the user and the
associated hazards like biased view or background
knowledge and therefore the users’ compelling influ-
ence on the results. Furthermore, the cooperation be-
tween domain experts determining the analysis pro-
cess themselves and the excluded IT department is not
expected to be straightforward.
In our future work, we will investigate the differ-
ent steps based on our process in an overarching ar-
chitecture as well as different concepts to reduce the
conflict potential between domain experts and IT de-
partments.
REFERENCES
Alpar, P. and Schulz, M. (2016). Self-Service Business In-
telligence. Business & Information Systems Engineer-
ing, 58(2):151–155.
Bertini, E. and Lalanne, D. (2009). Surveying the com-
plementary role of automatic data analysis and visu-
alization in knowledge discovery. In Proceedings of
the ACM SIGKDD Workshop on Visual Analytics and
Knowledge Discovery: Integrating Automated Anal-
ysis with Interactive Exploration, pages 12–20, New
York, USA. ACM Press.
B
¨
ogl, M., Aigner, W., Filzmoser, P., Lammarsch, T.,
Miksch, S., and Rind, A. (2013). Visual Analytics
for Model Selection in Time Series Analysis. IEEE
Transactions on Visualization and Computer Graph-
ics, 19(12):2237–2246.
Card, S. K., Mackinlay, J. D., and Shneiderman, B. (1999).
Information Visualization. In Card, S. K., Mackinlay,
J. D., and Shneiderman, B., editors, Readings In Infor-
mation Visualization: Using Vision To Think, pages 1–
34. Morgan Kaufmann Publishers Inc., San Francisco,
CA, USA.
Chiticariu, L., Kolaitis, P. G., and Popa, L. (2008). Interac-
tive generation of integrated schemas. In Proceedings
of the 2008 ACM SIGMOD International Conference
on Management of Data, pages 833–846. ACM.
Cypher, A., editor (1993). Watch What I Do – Programming
by Demonstration. MIT Press, Cambridge, MA, USA.
Daniel, F. and Matera, M. (2014). Mashups. Concepts,
Models and Architectures. Springer, Berlin, Heidel-
berg.
Eckerson, W. W. (2009). Self-Service BI. Checklist Report,
TDWI Research.
EMC Corporation (2014). Digital Universe Invaded By
Sensors. Press Release.
Endert, A., Hossain, M. S., Ramakrishnan, N., North, C.,
Fiaux, P., and Andrews, C. (2014). The human is the
loop: new directions for visual analytics. Journal of
Intelligent Information Systems, 43(3):411–435.
Fayyad, U., Piatetsky-Shapiro, G., and Smyth, P. (1996).
The KDD Process for Extracting Useful Knowledge
from Volumes of Data. Communications of the ACM,
39(11):27–34.
Gantz, J. and Reinsel, D. (2012). THE DIGITAL UNI-
VERSE IN 2020: Big Data, Bigger Digital Shadows,
and Biggest Growth in the Far East. International Data
Corporation (IDC).
Hirmer, P. and Behringer, M. (2017). FlexMash 2.0 – Flex-
ible Modeling and Execution of Data Mashups. In
Daniel, F. and Gaedke, M., editors, Rapid Mashup De-
velopment Tools, pages 10–29. Springer International
Publishing, Cham.
Hirmer, P. and Mitschang, B. (2016). FlexMash – Flex-
ible Data Mashups Based on Pattern-Based Model
Transformation. In Daniel, F. and Pautasso, C., edi-
tors, Rapid Mashup Development Tools, pages 12–30.
Springer International Publishing, Cham.
Hirmer, P., Reimann, P., Wieland, M., and Mitschang, B.
(2015). Extended Techniques for Flexible Model-
ing and Execution of Data Mashups. In Helfert, M.,
Holzinger, A., Belo, O., and Francalanci, C., editors,
Proceedings of 4th International Conference on Data
Management Technologies and Applications, pages
111–122. SciTePress.
Imhoff, C. and White, C. (2011). Self-Service Business In-
telligence. Best Practices Report, TDWI Research.
Kandel, S., Heer, J., Plaisant, C., Kennedy, J., van Ham,
F., Riche, N. H., Weaver, C., Lee, B., Brodbeck, D.,
and Buono, P. (2011a). Research directions in data
wrangling: Visualizations and transformations for us-
able and credible data. Information Visualization,
10(4):271–288.
Kandel, S., Paepcke, A., Hellerstein, J., and Heer, J.
(2011b). Wrangler: Interactive Visual Specification
of Data Transformation Scripts. In Proceedings of the
SIGCHI Conference on Human Factors in Comput-
ing Systems, pages 3363–3372. ACM, New York, NY,
USA.
Keim, D. A., Andrienko, G., Fekete, J.-D., G
¨
org, C.,
Kohlhammer, J., and Melanc¸on, G. (2008). Visual
Analytics: Definition, Process, and Challenges. In
Kerren, A., Stasko, J. T., Fekete, J.-D., and North,
C., editors, Information Visualization, pages 154–175.
Springer, Berlin, Heidelberg.
Keim, D. A., Kohlhammer, J., Mansmann, F., May, T., and
Wanner, F. (2010). Visual Analytics. In Keim, D.,
Kohlhammer, J., Ellis, G., and Mansmann, F., editors,
Mastering The Information Age, pages 7–18. Euro-
graphics Association, Goslar.
Keim, D. A., Mansmann, F., Schneidewind, J., and Ziegler,
H. (2006). Challenges in Visual Data Analysis. In
Proceedings of the International Conference on Infor-
mation Visualisation, pages 9–16. IEEE.
Kemper, H.-G., Baars, H., and Mehanna, W. (2010). Busi-
ness Intelligence – Grundlagen und praktische An-
wendungen. Eine Einf
¨
uhrung in die IT-basierte Man-
agementunterst
¨
utzung. Vieweg+Teubner, Wiesbaden.
Towards Interactive Data Processing and Analytics - Putting the Human in the Center of the Loop
95

Maimon, O. and Rokach, L. (2010). Introduction to Knowl-
edge Discovery and Data Mining. In Maimon, O.
and Rokach, L., editors, Data Mining and Knowledge
Discovery Handbook. Springer, New York, Dordrecht,
Heidelberg, London.
Meunier, R. (1995). The pipes and filters architecture. In
Coplien, J. O. and Schmidt, D. C., editors, Pattern
Languages of Program Design, pages 427–440. ACM
Press, New York, NY, USA.
Pirolli, P. and Card, S. (2005). The Sensemaking Process
and Leverage Points for Analyst Technology as Iden-
tified Through Cognitive Task Analysis. In Proceed-
ings of the International Conference on Intelligence
Analysis.
Puolam
¨
aki, K., Bertone, A., Ther
´
on, R., Huisman, O., Jo-
hansson, J., Miksch, S., Papapetrou, P., and Rinzivillo,
S. (2010). Data Mining. In Keim, D., Kohlhammer,
J., Ellis, G., and Mansmann, F., editors, Mastering The
Information Age, pages 39–56. Eurographics Associ-
ation, Goslar.
Raman, V. and Hellerstein, J. M. (2001). Potter’s Wheel:
An Interactive Data Cleaning System. In Proceedings
of the International Conference on Very Large Data
Bases (VLDB), pages 381–390.
Sacha, D., Stoffel, A., Stoffel, F., Kwon, B. C., Ellis, G., and
Keim, D. A. (2014). Knowledge Generation Model
for Visual Analytics. IEEE Transactions on Visual-
ization and Computer Graphics, 20(12):1604–1613.
Shneiderman, B. (1996). The Eyes Have It: A Task by
Data Type Taxonomy for Information Visualizations.
In Symposium on Visual Languages, pages 336–343.
IEEE, Washington, DC, USA.
Stodder, D. (2015). Visual Analytics for Making Smarter
Decisions Faster. Best Practices Report, TDWI Re-
search.
Thomas, J. J. and Cook, K. A. (2005). Illuminating the
Path: The Research and Development Agenda for Vi-
sual Analytics. National Visualization and Analytics
Center.
ICEIS 2017 - 19th International Conference on Enterprise Information Systems
96
