
University Student Progressions and First Year Behaviour
R. Campagni, D. Merlini and M. C. Verri
Dipartimento di Statistica, Informatica, Applicazioni, Universit
`
a di Firenze, Viale Morgagni 65, 50134, Firenze, Italia
Keywords:
Educational Data Mining, Clustering, Student Progressions, Self Assessment Test.
Abstract:
Advanced mining techniques are used on educational data concerning university students. In particular, cluster
analysis is used to predict the university careers of students starting from their first year performance and
the results of the self assessment test. The analysis of the entire careers highlights three groups of students
strongly affected by the results of the first year: high achieving students who start medium-high and increase
their performance over the time, medium achieving students who maintain their performance throughout the
entire course of study, low achieving students unable to improve their performance who often abandon their
studies. This kind of knowledge can have practical implications on the involved laurea degree.
1 INTRODUCTION
Many fields and sectors, from economic and busi-
ness activities to public administration, are involved
with the growth of data in computer systems, result-
ing in the need to develop new technologies to man-
age and analyse all the information from this large
amount of data. For what concerns the field of edu-
cation, EDM (Educational Data Mining) is a recent
area of research that, starting from data stored in the
schools and universities databases for administrative
purposes, is designed to extract knowledge with the
aim to understand and improve the performance of
the student learning process (see (Baker, 2014; Pe
˜
na-
Ayala, 2014; Romero et al., 2014; Romero and Ven-
tura, 2013) for recent surveys on the state of the art of
educational data mining and on preprocessing educa-
tional data).
The recent literature reveals that predicting per-
formance at a university degree level has attracted
considerable attention and interest. For example,
(Kabakchieva et al., 2011; Zimmermann et al., 2011;
Zimmermann et al., 2015) use regression and clas-
sification models to analyse how well indicators of
undergraduate achievements and university perfor-
mance characteristics can predict graduate-level per-
formance; in (Bower, 2010), hierarchical cluster anal-
ysis is used to provide school leaders and researchers
a method to make better informed decisions in schools
earlier, using data already collected on students.
The present study uses data mining methods, in
particular partitional clustering, to analyse the per-
formance of students in the Computer Science laurea
degree of the University of Florence (Italy), by us-
ing an explorative approach to mine information from
students data. Two aspects of students performance
are considered. First, we analyse the performance of
students during their first year for 5 cohorts, starting
from the academic year 2010-2011 up to 2014-2015.
In particular, we combine results achieved by students
in the courses of the first year with the results of a self-
assessment test they are required to take before enter-
ing the university. This is done by clustering analysis
using the K-means implementation of software WEKA
(see (Witten et al., 2011)); the obtained results allows
us to identify a few courses which can serve as indi-
cators of good and low performance and to point out
the influence of the self-assessment test in being suc-
cessful in the first year exams.
Second, we concentrate on the first three cohorts
of students and study their progressions during the
first, second and third year of university. Three im-
portant groups of students have been identified: stu-
dents who achieve quite high results during all the pe-
riod under examination, medium achieving students
who maintain a medium profile throughout the entire
course of study, low achieving students which often
abandon their studies (see (Campagni et al., 2015)
for a similar study treated with a different approach).
This analysis is done by clustering students of the
first year according to the number of credits and the
grades achieved during the first year, together with
the result of the self-assessment test. Then we use
this model to classify students during the other two
46
Campagni, R., Merlini, D. and Verri, M.
University Student Progressions and First Year Behaviour.
DOI: 10.5220/0006323400460056
In Proceedings of the 9th International Conference on Computer Supported Education (CSEDU 2017) - Volume 2, pages 46-56
ISBN: 978-989-758-240-0
Copyright © 2017 by SCITEPRESS – Science and Technology Publications, Lda. All rights reserved

years and thus identify the three typical behaviors.
This second analysis is performed by using the Clus-
ter Assigner node function of the software KNIME (see
https://www.knime.org).
In Section 2 we introduce data used for the anal-
ysis and in particular we illustrate the operations per-
formed on the original data to obtain the final data
sets for the application of the appropriate algorithms.
In Sections 3 and 4 we explain the methodology and
present the results obtained on a real case study. Fi-
nally, in Section 5 we present our conclusions.
2 DATA SETS FOR ANALYSIS
In this section, we describe how university students’
data are organized, referring to a laurea degree of the
University of Florence, Italy; in particular we deal
with data of the Computer Science degree of the Sci-
ence School, under the Italian Ministerial Decree n.
270/2004. This academic degree is structured over
three years and every academic year is organized with
several courses, each course has assigned some cred-
its (CFU) for an amount of 60 credits in each year.
Each student, before enrolling in the degree
course, has to take an entrance test to self-evaluate
his background in mathematics
1
. This test consists
of 25 multiple choice questions (one correct answer
out of four possible options) on mathematics argu-
ments usually studied in high school: arithmetic, el-
ementary algebra, equations, inequalities, elementary
logic, combinatorics, functions, geometry, probabil-
ity. Each correct answer counts as 1 point while a
wrong or no given answer counts as 0 points: the test
is passed with 12 points.
Data under analysis concern university students
enrolled from academic year 2010-2011 (afterwards
cohort 2010) up to 2014-2015 (afterwards cohort
2014), updated to 31th December 2015. We start with
two different data sets: the first contains information
about students and their school career before entering
university, together with information on the entrance
test; the second, with information about exams taken
by students.
Table 1 illustrates an example of students data set
after a preprocessing phase which allows us to inte-
grate all the attributes related to students in a single
table. Table 2 contains, for each student, the exams
data with the grade and the credits obtained. As of-
ten happens, we deal with data which need a prepro-
cessing step to fix errors and to reorganize the data
1
See http://www.scienze.unifi.it/upload/sub/
testdiaccesso/syllabus-conoscenze-matematiche.
pdf for more details, in Italian.
for the purposes of analysis, before applying the var-
ious analysis techniques, such that clustering, classi-
fication and several others (see (Romero et al., 2014)
for a survey on preprocessing educational data). Dur-
ing this preprocessing phase we join Tables 1 and 2
and aggregate the data to obtain the productivity of
the student in a year, in terms of credits and the av-
erage grade obtained in the corresponding exams.At
the end of this phase the resulting data set is orga-
nized as shown in Table 3, where, for example, the
student 100 obtained 24 credits in the first year (at-
tribute credits) with a average grade of 25.5 (at-
tribute avggrade); in the second year the same stu-
dent obtained 60 credits with an average grade of 28.
The attribute test grade corresponds to the grade in
the entrance test.
In this paper we present two different analyses
based on two different data sets. The first analysis,
by concerning the student productivity during the first
year, considers all cohorts from 2010 to 2014 and is
based on the data set related to students who took at
least an exam in their first year. The data set, analysed
by the K-means implementation of the software WEKA,
contains the detail about the grades obtained in each
exam taken by students and is illustrated in Table 4.
The second analysis concerns the student pro-
ductivity during the first three years; for each year
we consider the credits and the average grade of
exams and we analyse the way students behave in
the different years in terms of the corresponding at-
tributes. This analysis is based on students enrolled
from 2010 up to 2012 and takes into account the en-
trance test and the examinations over the three years,
as shown in Table 5. The indices I, II and III refer
to the different years; the column names CreditsI,
CreditsII, CreditsIII are for CreditsIgrade,
CreditsIIgrade, CreditsIIIgrade, that is, they
represent credits obtained in exams with grade. In
particular we analyse how the career of the first year
affects the entire career by using the Cluster Assigner
node function of the software KNIME.
3 ANALYSIS OF THE FIRST
YEAR PRODUCTIVITY
In this section, we examine the first year active stu-
dents of the 5 cohorts from 2010 up to 2014, for a to-
tal of 289 students. The term active refers to the fact
that students under examination have given at least an
exam within the month of December of the second
year (for example, December 2011 for students of co-
horts 2010). For some of these students, this fact cor-
responds to passing the English exam, which is a 3
University Student Progressions and First Year Behaviour
47

Table 1: A sample of students data. The attributes in the table refer to the student identifier, Student, the grade obtained in
the entrance test, varying in the range 0..25, Test grade, the final grade obtained at the high school, varying in the range
60..100, Hgrade, and the typology of high school, Hschool.
Student Test grade Hgrade Hschool
100 18 80 LS
200 22 100 IT
300 15 78 IT
400 24 100 LS
500 19 90 LC
.
.
.
.
.
.
.
.
.
.
.
.
Table 2: A sample of exams data. The attributes in the table refer to the student identifier, Student, the exam code, Exam,
the exam date, Date, the grade obtained in the exam, varying in the range 18..30, Grade, and the corresponding number of
credits, Credits.
Student Exam Date Grade Credits
100 10 2011-01-14 24 12
100 20 2011-02-20 27 12
200 20 2011-02-20 21 12
.
.
.
.
.
.
.
.
.
.
.
.
.
.
.
300 10 2012-01-29 26 12
100 40 2012-02-15 26 6
.
.
.
.
.
.
.
.
.
.
.
.
.
.
.
Table 3: A sample of student productivity in the years. The attributes in the table refer to the student identifier, Student, the
academic year under examination, Year, the number of credits achieved during the year, Credits, the average grade, varying
in the range 18..30, Avggrade, and the grade obtained in the entrance test, varying in the range 0..25, Test grade.
Student Year Credits Avggrade Test grade
100 2011 24 25.5 18
200 2011 12 21 22
.
.
.
.
.
.
.
.
.
.
.
.
.
.
.
300 2012 26 12 15
100 2012 60 28 18
.
.
.
.
.
.
.
.
.
.
.
.
.
.
.
Table 4: A sample of data set for the analysis on first year. The attributes in the table refer to the student identifier, Student, the
student cohort, Cohort, the number of credits corresponding to exams with a grade achieved during the year, Credits
grade,
the average grade, varying in the range 18..30, Avggrade, the grade obtained in the entrance test, varying in the range 0..25,
Test grade, and the grade obtained in the ith exam, exam i.
Student Cohort Credits grade Avggrade Test grade exam 1 . . . exam n
100 2010 60 26 18 27 . . . 24
200 2010 12 21 15 21 . . . 0
.
.
.
.
.
.
.
.
.
.
.
.
.
.
.
.
.
.
.
.
.
.
.
.
300 2011 12 26 12 26 . . . 0
.
.
.
.
.
.
.
.
.
.
.
.
.
.
.
.
.
.
.
.
.
.
.
.
CFU course without grade assignment. From our anal-
ysis are therefore excluded all the students that enroll
at the Computer Science degree of the University of
Florence and remain inactive within December of the
next year: most of these students abandon their stud-
ies or make a different choice. However, among the
active students just defined, there are some which are
yet at risk of dropping out, due to the very low results
CSEDU 2017 - 9th International Conference on Computer Supported Education
48

Table 5: A sample of data set for the analysis on first three years. The attributes in the table refer to the student identifier,
Student, the student cohort, Cohort, the number of credits corresponding to exams with a grade achieved during the I, II
or III year, CreditsI, CreditsII, CreditsIII, the average grade, varying in the range 18..30, achieved during the I, II or
III year, AvggradeI, AvggradeII and AvggradeIII, and the grade obtained in the entrance test, varying in the range 0..25,
Test.
Student Cohort CreditsI CreditsII CreditsIII AvggradeI AvggradeII AvggradeIII Test
100 2010 60 60 60 26 28 28 18
200 2010 12 36 48 21 23 25 15
.
.
.
.
.
.
.
.
.
.
.
.
.
.
.
.
.
.
.
.
.
.
.
.
.
.
.
300 2011 12 24 36 21 23 24 12
.
.
.
.
.
.
.
.
.
.
.
.
.
.
.
.
.
.
.
.
.
.
.
.
.
.
.
during their first year. Understanding the productivity
of first year students can point out these difficulties
and gives an opportunity to improve the teaching and
learning processes of the Laurea Degree. The data set
we analyse is not big, however, as focused in (Natek
and Zwilling, 2014), a data mining analysis is useful
also in such small contexts. Moreover, the case study
allows us to describe the methodology on a real situ-
ation.
In particular, we perform a cluster analysis by us-
ing the K-means implementation of the software WEKA.
In our analysis we measure cluster validity with cor-
relation, by using the concept of proximity and inci-
dence matrices: in the proximity matrix P = (P
i, j
),
each element P
i, j
represents the Euclidean distance
between elements i and j in the data set; in the in-
cidence matrix I = (I
i, j
), each element I
i, j
is 1 or 0
if the elements i and j belong to the same cluster or
not. We then compute the Pearson’s correlation, as
defined in (Tan et al., 2006, page 77), between the
linear representation by rows of matrices P and I and
we expect to find a negative value, where -1 means a
perfect negative linear relationship.
We tried the K-means algorithm with several val-
ues of k and with k = 3 we obtained the cluster for
the first year students of the 5 cohorts from 2010 up
to 2014, illustrated in Figure 1. As cluster attributes
we used the number of credits corresponding to ex-
ams with a grade, attribute credits grade, the av-
erage grade, attribute avggrade, and the grade of the
self-assessment test, attribute test grade.
The centroids of the cluster are illustrated in Ta-
ble 6 and, in particular, cluster 0 identifies medium
achieving students, cluster 1 corresponds to students
that during the first year had success only with the
exam of English and therefore have no credits and
no grade in this clustering, finally, cluster 2 identifies
high achieving students. The clusters are character-
ized by colours blue, red and green in Figure 1, re-
spectively. The Pearsons correlation between the lin-
ear representation of the proximity and incidence ma-
trices is -0.66, a good value of correlation.
The following Figures 2,3,4,5 and 6 illustrate the
relation between the students in the cluster of Fig-
ure 1 and the exams of the first year: Algorithms
and Data Structures (ADS), Programming (PRG), Cal-
culus (CAL), Architectures (ARC), Discrete mathemat-
ics and Logic (DML). In these figures, the blue colour
means that the exam has not been given (the grade is
0) and the orange colour means that the exam has been
passed with a grade between 18 and 30 (31 means 30
cum laude). As can be seen, there are some courses,
such as ADS, organized in a such a way that most stu-
dents in clusters 0 and 2 are able to give the corre-
sponding exams, while there are two exams, ARC and
DML, which are given mainly by students in cluster 2
and that therefore present some critical aspects.
Figure 7 puts in evidence the results of the self as-
sessment test, however such figure should be accom-
panied with the results of the Pearson correlation be-
tween the test grade and the number of credits and the
average grade, respectively: for the five years 2010-14
the value corresponding to attributes credits grade
and test grade shows a positive correlation of 0.49
while the value corresponding to attributes avggrade
and test grade shows a positive correlation of 0.39.
A more detailed analysis, shows a particular positive
correlation with the average grade of CAL and DML,
that is, the mathematics courses of the first year. The
self assessment test is mainly concerned with prob-
lems of logic, calculus, probability and the previ-
ous correlations between mathematics courses and the
test are quite natural. These facts are summarized
in Table 7 which shows the values of the correla-
tion between each of the attributes credits grade,
avggrade, ADS, ARC, PRG, CAL, DML and the attribute
test
grade, during the academic years from 2010 up
to 2014, the three years 2010-12, which will be ex-
amined in the next section and, finally, the five years
2010-14.
University Student Progressions and First Year Behaviour
49
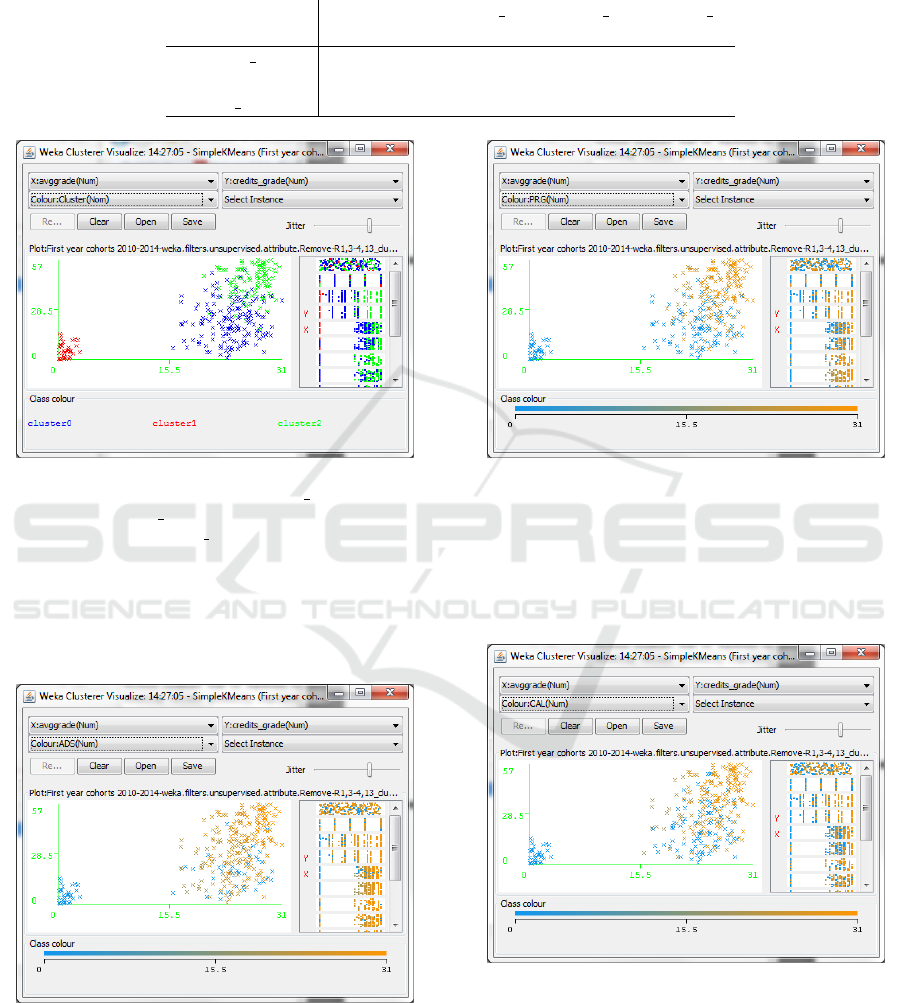
Table 6: Centroids corresponding to Figure 1 and corresponding to first year results of cohorts 2010-2014. The cluster 0
identifies medium achieving students, cluster 1 corresponds to students that during the first year had success only with the
exam of English and therefore have no credits and no grade in this clustering, finally, cluster 2 identifies high achieving
students.
Attribute Full Data Cluster 0 Cluster 1 Cluster 2
(289) (154) (32) (103)
credits grade 28.55 21.99 0 47.21
avggrade 22.52 24.23 0 26.97
test grade 14.39 13.08 11.28 17.32
Figure 1: Clusters for the first year students of cohorts 2010-
2014 with respect to attributes credits grade, attribute
avggrade, and test grade and their projection with re-
spect to attributes credits grade and avggrade. In red
the students that during the first year had success only with
the exam of English and therefore have no credits and no
grade in this clustering; in blue medium achieving students
and in green high achieving students. (For interpretation of
the references to colours in this figure legend, the reader is
referred to the electronic version of this article).
Figure 2: Clusters of cohorts 2010-2014 illustrated in Fig-
ure 1 with the Algorithms and Data Structures course, ADS,
in evidence. The blue colour means that the exam has not
been given (the grade is 0) and the orange colour means that
the exam has been passed with a grade between 18 and 30
(31 means 30 cum laude). (For interpretation of the refer-
ences to colours in this figure legend, the reader is referred
to the electronic version of this article).
Figure 3: Clusters of cohorts 2010-2014 illustrated in Fig-
ure 1 with the Programming course, PRG, in evidence. The
blue colour means that the exam has not been given (the
grade is 0) and the orange colour means that the exam has
been passed with a grade between 18 and 30 (31 means 30
cum laude). (For interpretation of the references to colours
in this figure legend, the reader is referred to the electronic
version of this article).
Figure 4: Clusters of cohorts 2010-2014 illustrated in Fig-
ure 1 with the Calculus course, CAL, in evidence. The blue
colour means that the exam has not been given (the grade
is 0) and the orange colour means that the exam has been
passed with a grade between 18 and 30 (31 means 30 cum
laude). (For interpretation of the references to colours in
this figure legend, the reader is referred to the electronic
version of this article).
CSEDU 2017 - 9th International Conference on Computer Supported Education
50
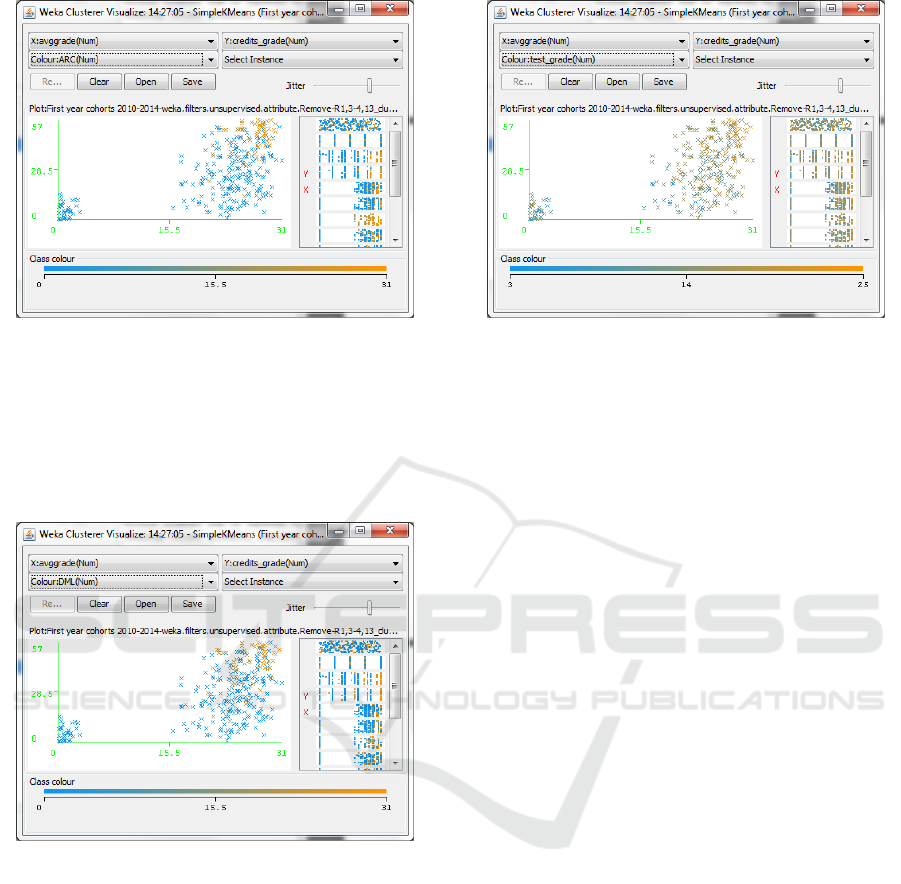
Figure 5: Clusters of cohorts 2010-2014 illustrated in Fig-
ure 1 with the Architectures course, ARC, in evidence. The
blue colour means that the exam has not been given (the
grade is 0) and the orange colour means that the exam has
been passed with a grade between 18 and 30 (31 means 30
cum laude). (For interpretation of the references to colours
in this figure legend, the reader is referred to the electronic
version of this article).
Figure 6: Clusters of cohorts 2010-2014 illustrated in Fig-
ure 1 with the Discrete mathematics and Logic course, DML,
in evidence. The blue colour means that the exam has not
been given (the grade is 0) and the orange colour means that
the exam has been passed with a grade between 18 and 30
(31 means 30 cum laude). (For interpretation of the refer-
ences to colours in this figure legend, the reader is referred
to the electronic version of this article).
For completeness, we computed also the Spear-
man and Kendall correlations between the same at-
tributes as before and the test grade. The results are
illustrated in Table 8 and reveal that the Kendall val-
ues are worse than Pearson values while the Spearman
values are quite similar to Pearson values illustrated in
Table 7.
A behavior similar to that illustrated in the previ-
ous figures, relative to cohorts 2010-2014 examined
Figure 7: Clusters of cohorts 2010-2014 illustrated in Fig-
ure 1 with self assessment test in evidence. The blue colour
means that the test has not been passed (the grade is 0) and
the orange colour means that the test has been passed with
the maximum grade 25. (For interpretation of the references
to colours in this figure legend, the reader is referred to the
electronic version of this article).
all together, can also be find on the single cohorts.
4 ANALYSIS OF THE FIRST
THREE YEARS
PRODUCTIVITY
In this section we analyse the first three cohorts of
students from 2010 up to 2012, for a total of 125 stu-
dents, by studying their progressions during the first,
second and third year of university. As in Section 3,
we consider only active students during the first year,
that is, students that have taken at least an exam in
the same year. We point out that a student active in
the first year can stop to be active during the second
and/or third year, thus becoming inactive in that year.
In particular, for the third year we consider exams and
credits matured up to the end of April of the fourth
year after enrollment; this date represents the end of
the third academic year.
As already observed for the analysis of Section 3,
the data set we study is not very big but we wish to
underline the methodological approach that, as far as
we know, is new. The analysis starts by clustering the
results of students during their first year, obtaining a
model that is the input for the next steps that classify
students according to their results during the second
and third years. This process allows us to analyse the
way in which the student careers evolve over the three
years and to understand how the performance during
the first year affects the following ones. We devel-
oped a KNIME flow, illustrated in Figure 8, that starts
University Student Progressions and First Year Behaviour
51

Table 7: Pearson’s correlation between various attributes and the test grade, test, relative to the first year of the cohorts 2010
up to 2014, of the three cohorts 2010-12 and of the five cohorts 2010-14. In particular, Credits grade is the number of
credits corresponding to exams with a grade achieved during the year, Avggrade is the average grade and ADS, ARC, PRG, CAL
and DML are the grades in the corresponding exams (the grade is 0 if the exam is not been passed).
Cohort Credits grade/test Avggrade/test ADS/test ARC/test PRG/test CAL/test DML/test
2010 0.49 0.40 0.08 0.23 0.56 0.51 0.46
2011 0.15 0.22 0.06 -0.12 0.07 0.20 0.17
2012 0.41 0.45 0.28 0.26 0.30 0.33 0.43
2013 0.55 0.39 0.22 0.43 0.42 0.51 0.47
2014 0.61 0.40 0.39 0.37 0.57 0.55 0.53
2010-12 0.33 0.38 0.18 0.15 0.27 0.29 0.36
2010-14 0.49 0.39 0.26 0.31 0.41 0.43 0.44
Table 8: Spearman (S) and Kendall (K) correlations between various attributes and the test grade, test, relative to the first
year of the three cohorts 2010-12 and of the five cohorts 2010-14. In particular, Credits grade is the number of credits
corresponding to exams with a grade achieved during the year, Avggrade is the average grade and ADS, ARC, PRG, CAL and
DML are the grades in the corresponding exams (the grade is 0 if the exam is not been passed).
Cohort Credits grade/test Avggrade/test ADS/test ARC/test PRG/test CAL/test DML/test
S 2010-12 0.26 0.34 0.18 0.11 0.25 0.32 0.35
S 2010-14 0.47 0.48 0.36 0.30 0.41 0.48 0.43
K 2010-12 0.20 0.25 0.14 0.09 0.19 0.25 0.28
K 2010-14 0.35 0.36 0.27 0.25 0.32 0.37 0.35
with the K-means node to analyse data of the first year
and produces an output model; this model represents
the input for a first Cluster Assigner node, that clas-
sifies students of the second year, and for a second
node which classifies students of the third one. In the
figure, these tree nodes are evidenced in green. As in
the previous analysis, we applied the K-means algo-
rithm with k = 3 and we considered the same cluster
attributes, that is, test
grade, credits grade and
avggrade.
More precisely, the input to the KNIME flow con-
sists of three data sets, evidenced in orange in Fig-
ure 8; the input for the K-means node contains in-
formation about active students in the first year and
concerns exams taken by students up to 31th Decem-
ber of the year following their enrollment. A sample
of these data is illustrated in Table 9, where the at-
tributes creditsI grade and avggradeI contain re-
spectively the credits and the average grade obtained
from students in exams taken during their first year.
The inputs for the first and second Cluster Assigner
nodes are analogous; in this case we consider the at-
tributes creditsII grade and avggradeII, indicat-
ing the credits and the average grade obtained from
students in exams taken in the second year, and the
similar attributes corresponding to the exams taken in
the third year, that is, up to the 30th April of the fourth
year after the year of enrollment. We wish to point out
that we still consider active students, therefore the car-
dinalities of these input files can decrease from year
to year.
The result of the K-means step of the KNIME flow,
expressed in terms of coordinates of the centroids, is
showed in Table 10. We can observe that the attribute
credits grade separates very well the three cen-
troids; the cluster 2 identifies high achieving stu-
dents, cluster 1 medium achieving students and fi-
nally cluster 0 corresponds to students that during
their first year had success only with the exam of En-
glish and therefore have no credits and no grade in
this clustering.
Table 11 represents the output data set obtained
from the clustering step, where the new attribute
cluster indicates the cluster to which each student
has been assigned: this data set corresponds to the
first red node in Figure 8, starting from above. The
output data sets of the two Cluster Assigner nodes are
similar and correspond to the other two red nodes, one
for the second and one for the third year. This process
is concluded by a last postprocessing phase which
joins the previous data sets and produces a final output
illustrated in Table 12: a triplet of cluster values is as-
sociated to each student, indicating the path followed
over the three years under analysis. This path takes
into account also the inactivity of students during a
year. This data set is visualized in Figure 9, where the
green colour corresponds to hight profile students, the
yellow colour to medium profile students and the or-
ange colour to low profile students; the blue colour
represents inactive students. According to our defini-
tion of active students, a student can be inactive dur-
ing the second year but become active again during
CSEDU 2017 - 9th International Conference on Computer Supported Education
52
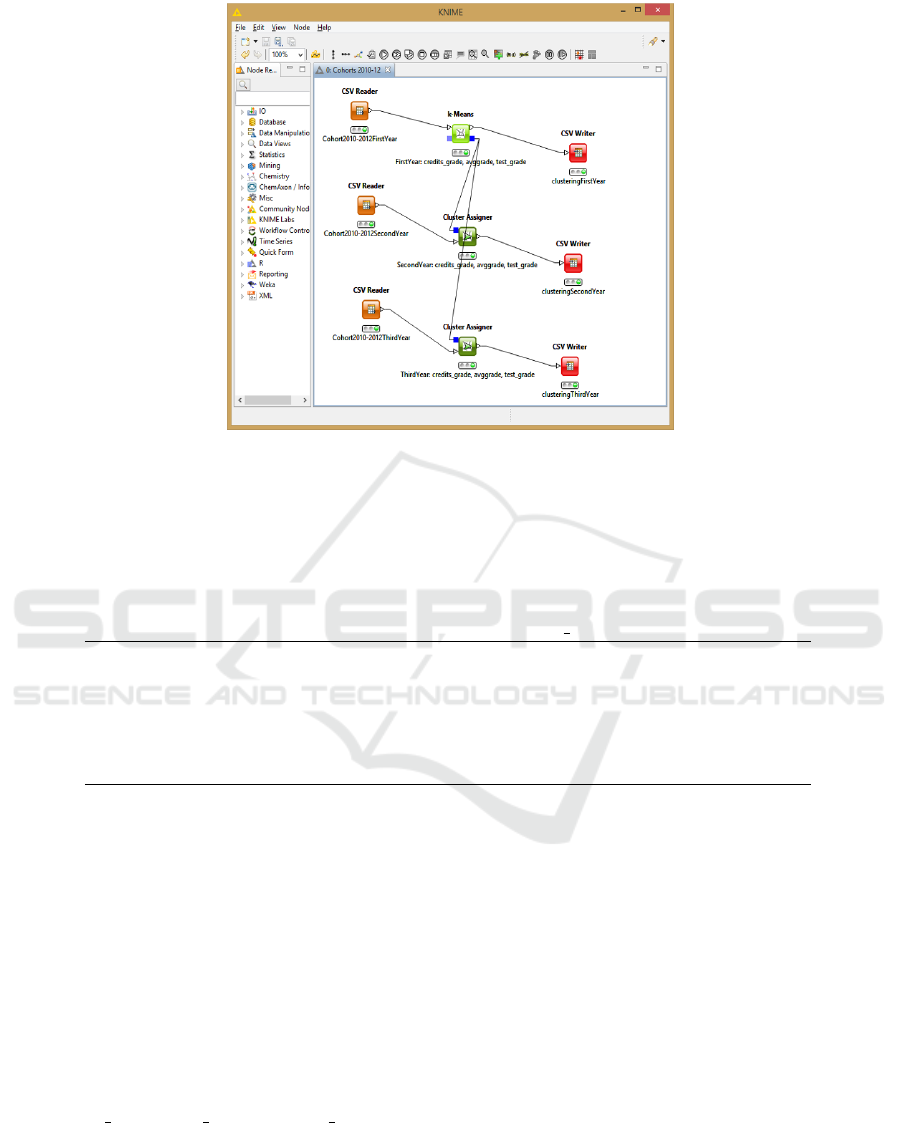
Figure 8: The KNIME flow: the orange nodes are the input to the flow and contain information about active students in first,
second and third year, respectively (see also Table 9); the first green node on the top is the K-means node where the clustering
step is performed; the other green nodes are the Cluster Assigner nodes which classify students according to the previous
clustering by using the results of second and third year; finally, the red nodes partition the students of each year according to
the clustering (see also Table 11). (For interpretation of the references to colours in this figure legend, the reader is referred to
the electronic version of this article).
Table 9: A sample of input data set for the K-means node of Figure 8.
Student Cohort CreditsIgrade AvggradeI Test grade Hgrade Hschool
100 2010 48 27 19 69 LS
200 2010 60 27 17 75 IT
.
.
.
.
.
.
.
.
.
.
.
.
.
.
.
.
.
.
.
.
.
300 2012 60 26 16 75 PS
.
.
.
.
.
.
.
.
.
.
.
.
.
.
.
.
.
.
.
.
.
the third. Figure 9 suggests that students inactive dur-
ing the second year remain inactive also in the next
year; moreover, students in the green cluster confirm
their good trend in the subsequent years, students in
the orange cluster tends to become inactive and, fi-
nally, some of the students in the yellow cluster move
to the adjacent clusters, improving or getting worse.
This hypothesis suggested by Figure 9 is confirmed
both by an analytic inspection of the data set and by
a new clustering step performed on data organized
as in Table 12. In fact, by using again the K-means
implementation of WEKA with k = 4 and attributes
clusterI, clusterII and clusterIII, where val-
ues cluster 0, cluster 1 and cluster 2 have been
transformed into the numeric values 0, 1 and 2 respec-
tively, and the value -1 has been assigned to inactivity,
we obtain the centroids illustrated in Table 13. With
this choice of k, the Pearsons correlation between the
linear representation of the proximity and incidence
matrices gives the value -0.63, a quite good value.
The cluster 0 represents students starting as yel-
low and becoming green, cluster 1 represent the ever
green students, cluster 2 corresponds to students at
risk of dropping out and, finally, cluster 3 represents
the ever yellow students. In other words, clusters 0
and 1 represent students who had overall very posi-
tive results during the three years, students of cluster
3 represent the medium achieving students throughout
the entire course of study and, finally, cluster 2 corre-
sponds to students who started with low or medium
results and were not be able to improve their perfor-
mance, often dropping out.
5 CONCLUSIONS
The analysis presented in Section 3 can be summa-
rized in the following steps: 1) we performed a pre-
University Student Progressions and First Year Behaviour
53
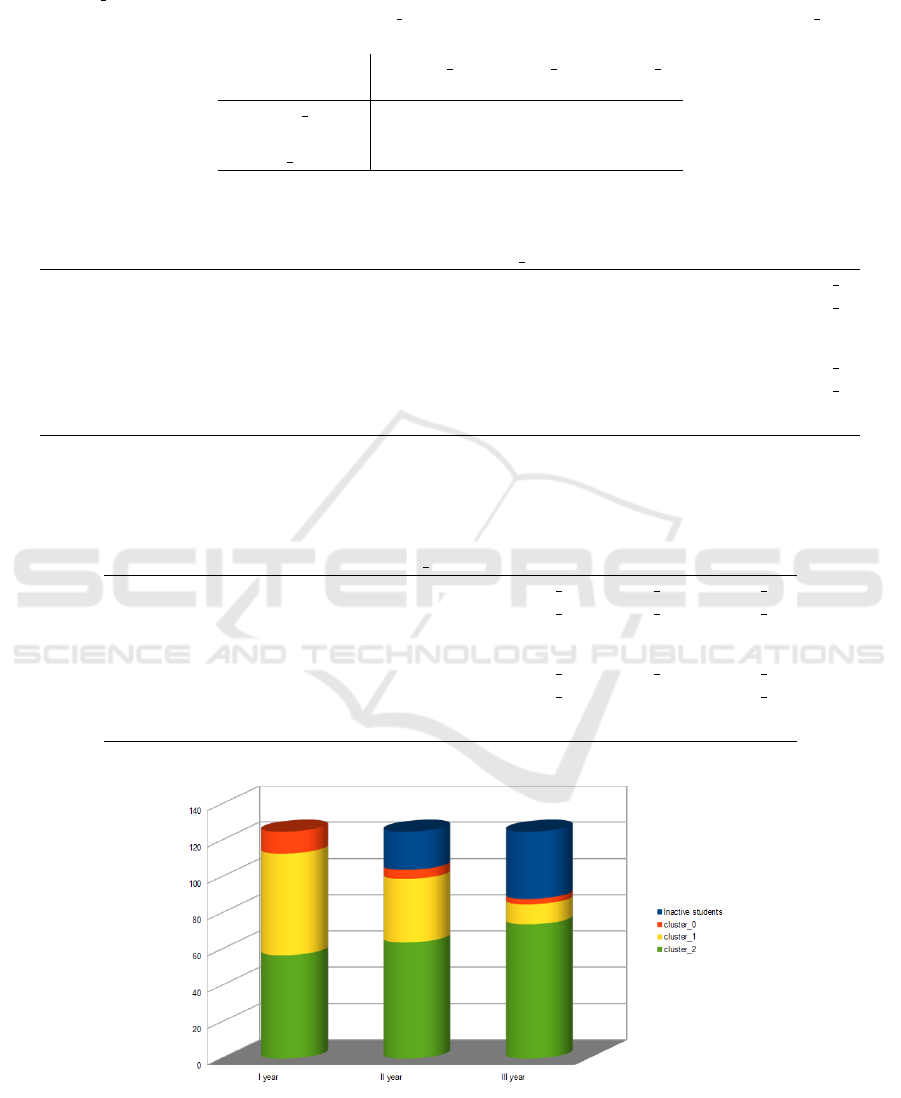
Table 10: Centroids resulting from the first step of the KNIME flow and corresponding to first year results of cohorts 2010-2012.
The cluster 0 corresponds to students that during their first year had success only with the exam of English and therefore
have no credits and no grade in this clustering, cluster 1 corresponds to medium achieving students and cluster 2 identifies
high achieving students. See Table 6 for the centroids of the analogous clusters on cohorts 2010-2014.
Attribute Cluster 0 Cluster 1 Cluster 2
(12) (57) (57)
credits grade 0 18.69 43.89
avggrade 0 24.42 26.42
test grade 11.67 14.45 15.33
Table 11: A sample of data set resulting from the K-means node of Figure 8.
Student Cohort CreditsIgrade AvggradeI Test grade Hgrade Hschool Cluster
100 2010 48 27 19 69 LS cluster 1
200 2010 60 27 17 75 IT cluster 2
.
.
.
.
.
.
.
.
.
.
.
.
.
.
.
.
.
.
.
.
.
.
.
.
300 2011 0 0 12 65 IT cluster 0
400 2012 60 26 16 75 PS cluster 2
.
.
.
.
.
.
.
.
.
.
.
.
.
.
.
.
.
.
.
.
.
.
.
.
Table 12: A sample of the final data set resulting from the KNIME flow and the postprocessing phase. A triplet of cluster values
is associated to each student, indicating the path followed over the three years under analysis. This path takes into account
also the inactivity of students during a year, as in the case of student 400.
Student Cohort . . . . . . Test grade ClusterI ClusterII ClusterIII
100 2010 . . . . . . 19 cluster 1 cluster 1 cluster 2
200 2010 . . . . . . 17 cluster 2 cluster 2 cluster 2
.
.
.
.
.
.
.
.
.
.
.
.
.
.
.
.
.
.
.
.
.
.
.
.
300 2011 . . . . . . 12 cluster 0 cluster 1 cluster 1
400 2012 . . . . . . 16 cluster 2 inactive cluster 2
.
.
.
.
.
.
.
.
.
.
.
.
.
.
.
.
.
.
.
.
.
.
.
.
Figure 9: A visualization of data corresponding to Table 12. The green colour corresponds to hight profile students, the
yellow colour to medium profile students and the orange colour to low profile students; the blue colour represents inactive
students. (For interpretation of the references to colours in this figure legend, the reader is referred to the electronic version
of this article).
CSEDU 2017 - 9th International Conference on Computer Supported Education
54

Table 13: Centroids corresponding to data organized as in Table 12. By referring to Figure 9, the cluster 0 represents students
starting as yellow and becoming green, cluster 1 represent the ever green students, cluster 2 corresponds to students at risk of
dropping out and, finally, cluster 3 represents the ever yellow students. (For interpretation of the references to colours in this
figure legend, the reader is referred to the electronic version of this article).
Attribute Full Data Cluster 0 Cluster 1 Cluster 2 Cluster 3
(125) (16) (52) (37) (20)
clusterI 1.36 0.94 2 0.81 1.05
clusterII 1.14 2 1.85 -0.03 0.75
clusterIII 0.98 1.94 1.96 -1 1.3
processing phase on students information to obtain
data organized as in Table 4, relative to students re-
sults on first year; 2) we performed a clustering step
to classify students according to the results of the self-
assessment test and the university performance dur-
ing the first year, by using K-means algorithm; 3) we
deepened the analysis on the partition obtained at the
previous step by exploring each exam dimension and
by computing correlations between attributes.
For the cohorts of students considered in this pa-
per, this analysis puts in evidence that the self assess-
ment test is an important indicator to predict both the
performance of the first year, in particular for what
concerns mathematical courses, and the progress of
the students career. On the other hand, courses of
the first year in which students have more difficul-
ties seem to give an important indication on the stu-
dent success. The laurea degree course could use this
information to support students having this kind of
problems.
The analysis proposed in Section 4 can be sum-
marized in the following steps: 1) we performed a
preprocessing phase on students information to obtain
data organized as in Table 5, relative to the results of
students during their first, second and third year; 2)
we performed a clustering step to classify students ac-
cording to the results of the self-assessment test and
the university performance during their first year, by
using K-means algorithm; 3) we applied the model ob-
tained at the previous step to the results of students
during their second and third year and associated to
each student the sequence of traversed clusters; 4) we
performed a second clustering step according to the
traversed clusters. Step 2 and 3 were realized by a
Knime flow.
The observations made as conclusion of the anal-
ysis presented in Section 3 are confirmed by the anal-
ysis of Section 4 that highlights three different trends
strongly affected from the performance of the first
year. As before, supporting first year students seems
to be a way to face the problem of inactive students
and dropping out. We think that the proposed method-
ology could be possibly applied to similar university
contexts to give suggestions for the definition of man-
agement strategies aiming to improve the students
productivity.
A practical implication of the results obtained
from this research could be the introduction of tutors
to support first year students, with special attention to
the most critical courses. Another aspect not to be un-
derestimated concerns the orientation and information
for incoming students: if it is true that the entrance
test gives important information on the students pro-
gressions, then the laurea degree should try to make
it clear to young people willing to join, what are the
difficulties that they will encounter, in order to help
them to make an informed choice.
ACKNOWLEDGMENTS
We wish to thank the anonymous referees whose com-
ments and suggestions helped us to improve the con-
tents and readability of the paper.
REFERENCES
Baker, R. S. J. D. (2014). Educational data mining: an ad-
vance for intelligent systems in education. IEEE In-
telligent Systems, 29(3):78–82.
Bower, A. (2010). Analyzing the Longitudinal K-12 Grad-
ing Histories of Entire Cohorts of Students: Grades,
Data Driven Decision Making, Dropping Out and Hi-
erarchical Cluster Analysis. Practical Assessment, Re-
search & Evaluation, 15(7):1–18.
Campagni, R., Merlini, D., Sprugnoli, R., and Verri, M. C.
(2015). Data mining models for student careers. Ex-
pert Systems with Applications, 42(13):5508–5521.
Kabakchieva, D., Stefanova, K., and Kisimov, V. (2011).
Determining Student Profiles and Predicting Perfor-
mance. In Proceedings of EDM 2011, 4th Interna-
tional Conference on Educational Data Mining, Eind-
hoven, the Netherlands.
Natek, S. and Zwilling, M. (2014). Student data min-
ing solution-knowledge management system related
to higher education institutions. Expert Systems with
Applications, 41:6400–6407.
University Student Progressions and First Year Behaviour
55

Pe
˜
na-Ayala, A. (2014). Educational data mining: a survey
and a data mining-based analysis. Expert Systems with
Applications, 41:1432–1462.
Romero, C., Romero, J. R., and Ventura, S. (2014). A
survey on pre-processing educational data. In Edu-
cational Data Mining. Studies in Computational In-
telligence, volume 524, pages 29–64, A. Pe
˜
na-Ayala
(Ed.), Springer.
Romero, C. and Ventura, S. (2013). Data mining in educa-
tion. Wiley Interdisc. Rew.: Data Mining and Knowl-
edge Discovery, 3(1):12–27.
Tan, P. N., Steinbach, M., and Kumar, V. (2006). Introduc-
tion to Data Mining. Addison-Wesley.
Witten, I. H., Frank, E., and Hall, M. A. (2011). Data
Mining: Practical Machine Learning Tools and Tech-
niques, Third Edition. Morgan Kaufmann.
Zimmermann, J., Brodersen, K. H., Heinimann, H. R., and
Buhmann, J. M. (2015). A model-based approach to
predicting graduate-level performance using indica-
tors of undergraduate-level performance. Journal of
Educational Data Mining, 7(3):151–176.
Zimmermann, J., Brodersen, K. H., Pellet, J. P., August,
E., and Buhmann, J. M. (2011). Predicting graduate
level performance from undergraduate achievements.
In Proceedings of EDM 2011, 4th International Con-
ference on Educational Data Mining, Eindhoven, the
Netherlands.
CSEDU 2017 - 9th International Conference on Computer Supported Education
56
