
Assessing the Vulnerability of Agricultural Crops to Riverine Floods
in Kalibo, Philippines using Composite Index Method
Ronalyn Jose
1
, Ransie Joy Apura
1
, Daniel Marc dela Torre
1
, Ariel Blanco
1,2
,
Patricia Kristen Dela Cruz
1
, Therese Anne Rollan
1
, Eric Luis Tañada
1
, Joyce Anne Laurete
3
,
Nerissa Gatdula
1
and Edgardo Macatulad
2
1
Phil-LiDAR 2 Project 1 Agricultural Resources Extraction (PARMap) from LiDAR Surveys, Training Center for Applied
Geodesy and Photogrammetry, University of the Philippines Diliman, Quezon City, Philippines
2
Department of Geodetic Engineering, College of Engineering, University of the Philippines Diliman,
Quezon City, Philippines
3
Phil-LiDAR 1 Data Archiving and Distribution, Training Center for Applied Geodesy and Photogrammetry,
University of the Philippines Diliman, Quezon City, Philippines
Keywords: Vulnerability Assessment, Agriculture, River Flood, Analytic Hierarchy Process, GIS, Composite Index
Method.
Abstract: Evaluating the vulnerability of a system can serve as an effective planning tool in increasing resilience to a
certain hazard. In this study, a vulnerability assessment of agricultural crops to river flooding in Kalibo, a
municipality in Aklan, Philippines, was performed. The analysis included physical, agro-ecological, and
socio-economic indicators clustered under the components of exposure, sensitivity, and adaptive capacity.
Indicators relevant for a composite index measuring degree of vulnerability to flooding were identified and
corresponding weights were determined using Analytic Hierarchy Process (AHP). Various datasets were
acquired using Light Detection and Ranging (LiDAR) remote sensing and participatory methods such as focus
group discussions (FGDs) and key informant interviews (KIIs). The barangay-level (village-level) and
gridded (500m x 500m) vulnerability maps produced using Index Method and GIS were validated through
field surveys and by comparison with historical accounts of disasters and their corresponding impacts on
agricultural productivity. It was concluded that the most exposed barangays were those near bodies of water
and having vast agricultural land cover. Though the physical and environmental attributes of an area are
substantial in determining risk, the vulnerability of the subject area was shown to be influenced by its internal
(exposure) and external (sensitivity and adaptive capacity) factors. Thus, knowing and acting on indicators
that are within human influence is essential in minimizing the effects of inevitable and uncontrollable
phenomena.
1 INTRODUCTION
Climate change involves processes that are complex
and diversified. However, it is mainly characterized
by the intensification of the water cycle, which results
in the occurrence of extreme weather phenomena like
excessive rainfall, flooding, storms, drought, etc.
(Heng et al., 2013).
Due to the Philippines’ geographical location and
physical environment, it has become highly
vulnerable to the impacts of natural disasters,
including the global incidents of the effects of climate
change (Senate Economic Planning Office [SEPO],
2013). According to the SEPO (2013), the Philippines
is one of the most hazard-prone countries in the
world. In the recent World Risk Index published by
the United Nations University - Institute of
Environment and Human Security [UNU-EHS]
(2016), the Philippines ranked third as the most
disaster risk country worldwide with a Risk Index of
26.70 percent. Risk Index is the computed disaster
risk of a country taking into account its exposure,
vulnerability, susceptability, coping capabilities and
adaptive capacities to natural disasters such as storms,
184
Jose, R., Apura, R., Torre, D., Blanco, A., Cruz, P., Rollan, T., Tañada, E., Laurete, J., Gatdula, N. and Macatulad, E.
Assessing the Vulnerability of Agricultural Crops to Riverine Floods in Kalibo, Philippines using Composite Index Method.
DOI: 10.5220/0006284601840194
In Proceedings of the 3rd International Conference on Geographical Information Systems Theory, Applications and Management (GISTAM 2017), pages 184-194
ISBN: 978-989-758-252-3
Copyright © 2017 by SCITEPRESS – Science and Technology Publications, Lda. All rights reserved
flooding, earthquakes, droughts and sea level rise
(UNU-EHS, 2016).
In the context of climate change, the impact of
flooding on socio-ecological systems is of global
significance (Doch et al., 2015). Flooding is one of
the most frequent, typical, and costly natural disasters
which causes abrupt damage on these systems. It
occurs when a body of water rises or overflows
beyond its normal confines, which then causes
inundation in adjoining areas that are usually dry
lands (Doch et al., 2015).
Modifications in rainfall pattern have a very
significant effect on the water level, especially of
basins (Heng et al., 2013). Intensified increase in the
water level may cause run-off, resulting in flooding
of nearby zones. When this phenomenon, i.e.,
sustained heavy rainfall over a specific river basin
takes place, river flood materializes.
In the last decade, the Centre for Research on the
Epidemiology of Disasters [CRED] (2016) recorded
around 196 significant damaging natural disasters in
the Philippines – 72 of which were flooding. Of the
72 flooding events, 41 were classified as riverine
flooding. River flooding alone resulted in 565
casualties and an estimated USD 16 billion worth of
damages. With fluvial flooding accounting for almost
21 percent of the total number of disastrous events in
the past 10 years, researches on their occurrence and
the vulnerability of specific areas should be given
considerable attention.
The staggering effects of climate change,
particularly the effect of flooding on agricultural
crops, has become a very serious concern worldwide
(Mallari, 2016). A consensus had been established
that inter-annual, monthly, and daily variations in the
distribution of climate variables such as temperature,
radiation, precipitation, water vapour pressure, wind
speed, and rainfall patterns may consequently reduce
agricultural productivity due to a number of physical,
chemical, and biological processes (Cuesta and
Rañola, 2009; Parry et al., 2007). Damage occurs
because flooding causes depletion of soil oxygen
which is crucial for normal metabolism, growth and
development of crops; moreover, it causes
intensification of nitrogen losses and disease
infections which reduce stands and yields (Butzen,
n.d.).
However, assessment of flooding is not only
based on the physical and environmental indicators,
but also on the interaction between flooding and other
agro-ecological, socio-economic factors and human
activities (Dang et al., 2011). Therefore, changes in
the current situation of society like population
density, population ageing, population literacy,
population income source, existing mitigation
measures, road density, access to crop insurance,
access to typhoon forecasting information, access to
planting calendar bulletins, and others contribute to
the vulnerability of a society to the natural hazard
(Dang et al., 2011; Doch et al., 2015; Heng et al.,
2013; Mallari, 2016).
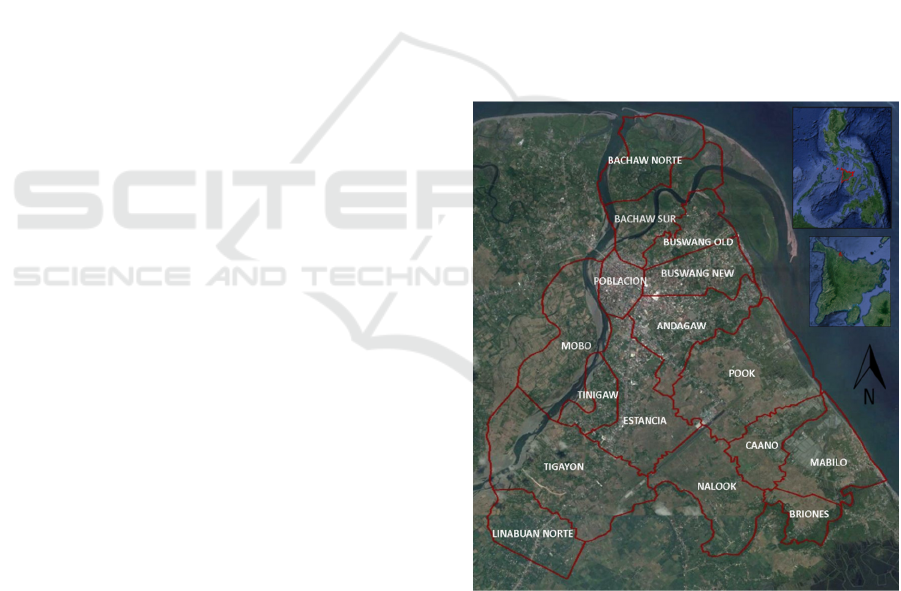
2 STUDY AREA
The municipality of Kalibo, Aklan (Figure 1)
encompasses the mouth of Aklan River. On the north,
it is bounded by the Sibuyan Sea, and on the other
borders by other municipalities of Aklan. Kalibo has
a total land area of 5,075 hectares which is divided
into 16 barangays (PSA, 2016). The first inset map in
Figure 1 shows the location of Panay Island in the
Philippines. The island is consist of the provinces of
Aklan, Antique, Capiz and Iloilo. The location of
Kalibo, Aklan is outlined in red in the second inset
map.
Figure 1: The study area of Kalibo, the capital municipality
of Aklan (Google Earth, 2016). Red lines indicate political
boundaries acquired from the National Statistics Office
(NSO) thru the National Mapping and Resource
Information Authority (NAMRIA).
Kalibo is predominantly an agricultural domain,
as such, agricultural lands cover the biggest portion
of the municipality. Around 1,111 hectares (21.89%)
of soil in Kalibo is suitable for diversified forest
Assessing the Vulnerability of Agricultural Crops to Riverine Floods in Kalibo, Philippines using Composite Index Method
185
crops. An estimated area of 1,555 hectares (30.64%)
was declared highly suitable for tree crops, while
another 1,150 hectares (22.66%) is highly suitable for
and currently planted with rice (Municipality of
Kalibo, 2016). Thus, the major thrust of the local
government of Kalibo is to make it the center of
agriculture-based economic industry and eco-tourism
(Municipality of Kalibo, 2016).
The agricultural areas are highly vulnerable to
flooding according to the records of the Municipal
Agriculture Office of Kalibo (2008; 2012). Based on
the damage reports (MAO, 2012), Typhoon Quinta
destroyed more than 350 hectares of agricultural
crops costing more than PHP 1.2 million in damages.
In July 2008, Typhoon Frank, one of the strongest
typhoons to hit Kalibo, resulted in crop losses
amounting to PHP 23.4 million (MAO, 2008).
3 METHODOLOGY
Agricultural vulnerability assessment to flooding was
performed using composite index method. Having
dimensions reflected by various indicators, an index
is described as a composite measure of any social
phenomena (Mallari, 2016). Calculating composite
indices from indicators is a common way of
quantifying and communicating vulnerability to
hazards, which is visualized using maps (Wiréhn et
al., 2015).
Vulnerability is the propensity or predisposition
to be adversely affected. Vulnerability encompasses a
variety of concepts and elements including sensitivity
or susceptibility to harm and lack of capacity to cope
and adapt (IPCC, 2014).
According to Doch et al. (2015), vulnerability
links the social and biophysical dimensions of
environmental change.
Vulnerability is most often conceptualized as
being constituted by the degree of exposure of the
system to the hazard, sensitivity of the system to
change, and its adaptive capacity to the changes in the
environment (Heng et al., 2013; Bogardi et al., 2005)
A vulnerability assessment of the agricultural sector
in Mabalacat City relative to Typhoon Santi was
performed considering such components and using
GIS to generate vulnerability index maps, identify the
barriers to adaptation, and to provide planning
recommendations (Mallari, 2016). The same
composite index method was used by Heng et al.
(2013) and Doch et al. (2015) to gauge the
vulnerability of agricultural production to flooding in
the Sangkae River watershed in Battambang
province, Cambodia.
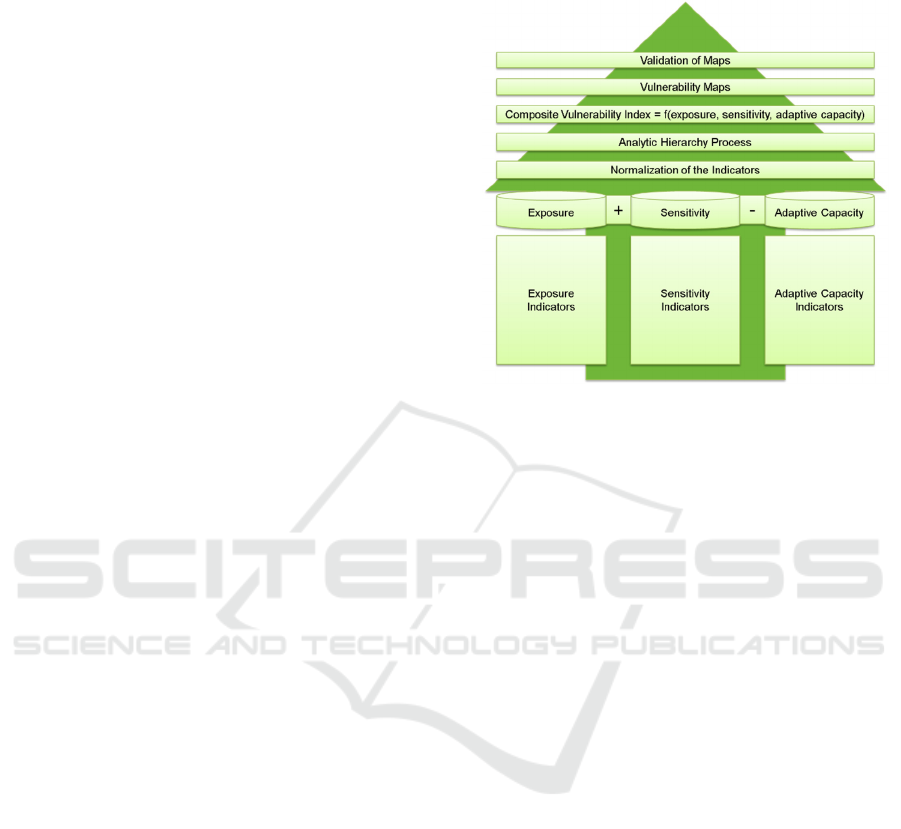
Figure 2: The methodological framework for the
agricultural vulnerability assessment.
In this research, the vulnerability assessment of
agricultural crops to flooding in Kalibo was based on
indicators clustered into respective components,
namely exposure, sensitivity, and adaptive capacity.
Literature reviews, internal meetings, discussions
with experts in the academe, local and national
government agencies, focus group discussions
(FGDs) and key informant interviews (KIIs) were
performed for the assessment, review, validation, and
finalization of indicators.
3.1 Data Collection and Preparation
Data collection commenced once the list of indicators
was finalized. Collection of primary socio-economic
datasets was done through farmer household (HH)
surveys. Survey materials consisted of questions
investigating the status and characteristics of the farm
lands and the socio-economic and agro-ecologic
attributes of the farmer households.
Since there was no available official list with the
number of farmer households per barangay, as many
farmer households as possible were interviewed
during a one-week fieldwork in Kalibo. A total of 243
farmer households were interviewed, coming from 14
barangays. No HH survey was conducted in
barangays Poblacion and Andagaw because there
were no agricultural crops in the area, therefore
assuming that there were no farmer households. This
was verified using the detailed LiDAR-derived
agricultural land cover maps and with the barangay
officials. The lack of agricultural crops in the area
GISTAM 2017 - 3rd International Conference on Geographical Information Systems Theory, Applications and Management
186
was attributed to the urbanization of these two
barangays.
The flood hazard maps of Kalibo were obtained
from the Disaster Risk and Exposure Assessment for
Mitigation (DREAM) Program of the University of
the Philippines (UP) and the Department of Science
and Technology (DOST). Flood models were
generated using LiDAR data, Synthetic Aperture
Radar (SAR) DEM and other datasets such as river
water level and discharge, soil shapefile, land cover,
meteorological data from Philippine Atmospheric
Geophysical and Astronomical Services
Administration (PAGASA) and DOST-Advanced
Science and Technology Institute (DOST-ASTI), and
the software FLO-2D GDS Pro (DREAM, 2016).
Agricultural features, i.e., land use/land cover
(LULC) including crop distribution, were extracted
from LiDAR datasets and orthomosaics. Derivative
layers (e.g., DTM, DSM, nDSM, CHM, intensity,
number of returns, etc.) that were used for
classification were prepared using LAStools. LULC
was extracted from these derived layers,
orthomosaics, object-based image analysis (OBIA)
and SEparability and THresholds (SEaTH). Accuracy
assessment was also performed to validate the results;
training and validation points were collected from
fieldworks, and visual inspection and interpretation of
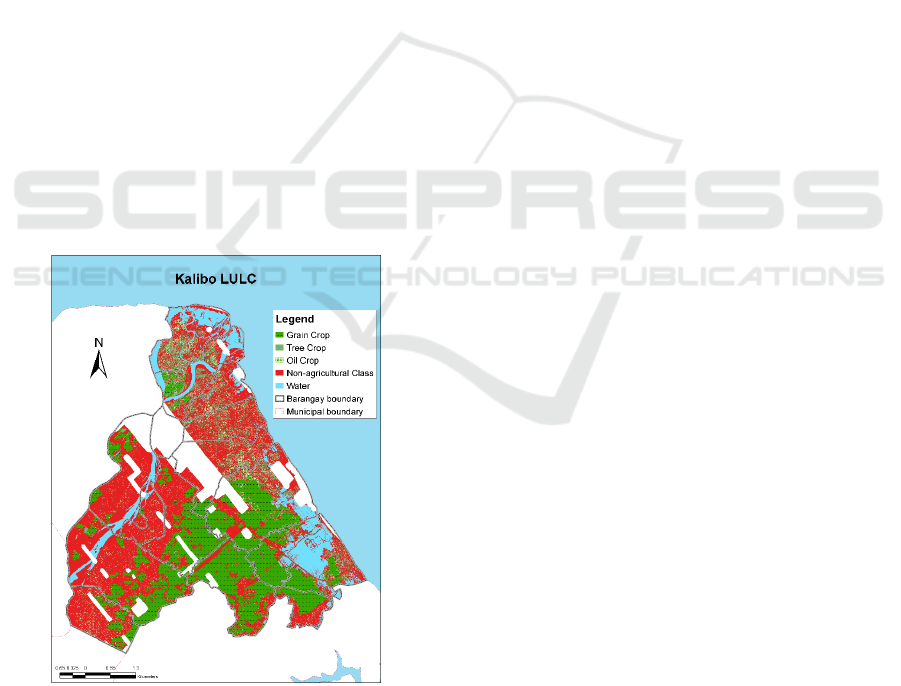
orthomosaics and LiDAR data was conducted. Figure
3 shows the generated LULC map of Kalibo, Aklan.
Figure 3: LULC Map of Kalibo, Aklan derived from
LiDAR datasets and orthomosaics.
Since the LULC map does not cover the entire
municipality, exposure computation of the
agricultural classes was based on the processed
LiDAR data area, rather than the entire boundary
area. The implications of performing calculations
based on the processed LiDAR data area would be
minimal since most of the area without LiDAR data
belongs to residential, commercial, and industrial
zones, as verified with the general land use map of the
municipality of Kalibo (Municipality of Kalibo,
2015). Further, areas with the least LiDAR coverage,
i.e., Poblacion and Andagaw, were previously tagged
as non-agricultural barangays.
In addition to the primary datasets, secondary
datasets were requested and acquired from
government-funded research projects, non-
government organizations (NGOs), and the local
planning and agriculture office.
3.2 Normalization
To make all the indicator values comparable and
congruent, they were standardized to fit within the
range zero (0) to one (1) using either linear
normalization or Z-score, depending on the type of
data. Linear normalization was done using the
formula:
Z
ij
= (X
ij
- X
i
min
)/(X
i
max
- X
i
min
)
(1)
Where:
Z
ij
= normalized value of indicator i to barangay j
X
ij
= original value of indicator i to barangay j
X
i
max
= highest value
X
i
min
= lowest value
For ordinal data, i.e., hierarchical arrangement but
without meaningful interval, standardization using Z-
score was applied using the online calculator
Measuring U (www.measuringu.com/pcalcz.php)
3.3 AHP
To compute for the composite index, which is defined
as the weighted average of all the normalized
indicator values, weights were determined and
assigned using Analytic Hierarchy Process (AHP.
AHP, which is also called Saaty Method, is a
complex decision making tool introduced by Thomas
Saaty (1980). It is a theory of measurement primarily
performed through pairwise comparisons and relies
on the judgements of experts to derive priority scales
(Saaty, 2008; Mendoza et al., 2014).
AHP was used to determine the weights of
indicators in every component of the composite
index. The same weighting method was utilized in
assigning the exposure weights of the land cover
classes.
Assessing the Vulnerability of Agricultural Crops to Riverine Floods in Kalibo, Philippines using Composite Index Method
187
The selection of experts is crucial as the
credibility of the results substantially depends on it.
The criteria for expert selection were familiarity with
the agricultural characteristics of the barangays
and/or municipality and sufficiency of knowledge on
flooding and its impact on the agricultural sector.
Thirteen to fifteen experts were consulted per
indicator type to rate the indicators for exposure,
sensitivity, adaptive capacity, and the LULC classes.
According to Saaty (1980, 2008), for a set of
ratings to be considered acceptable, its computed
consistency ratio (CR) should be less than or equal to
0.1, otherwise, ratings should either be repeated or
disregarded. However, Kluhto (2013) and Alonso and
Lamata (2006) argued that the tolerance value can be
raised to 20 percent which corresponds to an
acceptable CR of less than 0.2. This research used a
CR threshold of 0.2.
3.4 Vulnerability Indicators
The indicators were finalized based on the judgement
of experts from different fields and on the availability
of data. Experts included barangay agriculture
technicians, barangay and municipal agricultural
officers, representatives from farmer organizations,
researchers conducting VA studies, and
representatives from agricultural schools, among
others. A total of 30 indicators were determined: 5 for
exposure, 13 for sensitivity, and 12 for adaptive
capacity.
3.4.1 Exposure
Exposure, an external factor, is the nature or degree
to which a system is exposed to significant climatic
variations taking into account the frequency,
duration, and/or extent in which the system is in
contact with a hazard (Locatelli et al., 2008; Heng et
al., 2013; Doch et al., 2015).
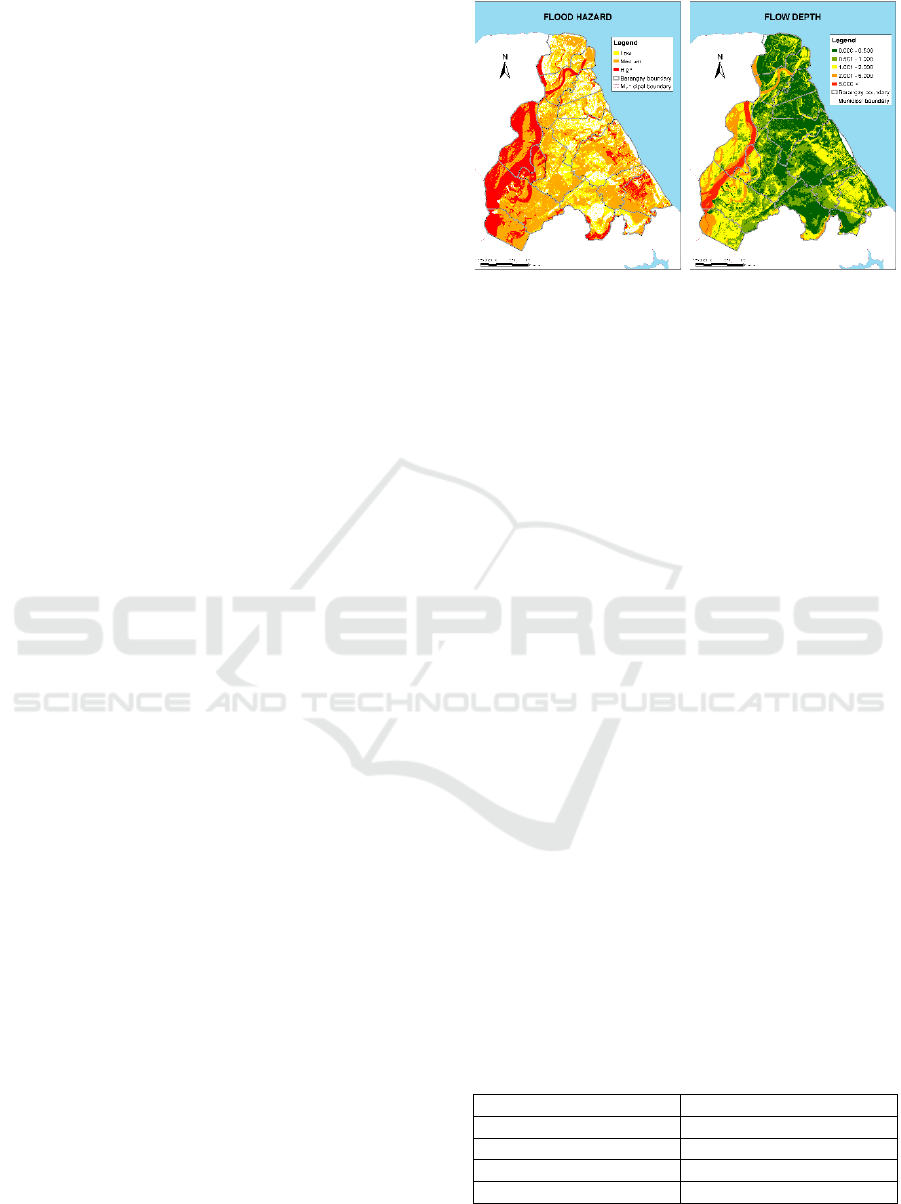
Inputs in the flood hazard and flow depth models
(see Figure 4) provided by DREAM in September
2016 include data from three (3) PAGASA RIDF
(rain intensity, duration, and frequency) stations
located in Romblon, Roxas City and Iloilo City.
Moreover, precipitation data was derived from 14
DOST-ASTI ARG (automated rain gauge) stations
distributed throughout the province of Aklan – two of
which are located within Kalibo. The produced vector
layers have 10-meter resolution showing floods for
storm events with a five-year return period (i.e., 20
percent chance of occurrence in any given year).
Figure 4: Flood hazard map (left) and flow depth map
(right) from DREAM Phil-LiDAR 1.
The flood hazard data was divided into three
levels based on the flood height and the product of
velocity and height (VH); these levels were as
follows:
Low (flood height of 0.1m to 0.5m and VH of
0.1m
2
/s to 0.5m
2
/s)
Medium (flood height of 0.5m to 1.5m or VH
of 0.5m
2
/s to 1.5m
2
/s)
High (flood height of more than 1.5m or VH
greater than 1.5m
2
/s)
Two indicators were derived from the flood
hazard data; one accounted for the area covered by
the hazard while the other provided the level of the
hazard.
On the other hand, flow depth data was divided
into five (5) classes with the following ranges: less
than 0.500m, 0.501m to 1.000m, 1.001m to 2.000m,
2.001m to 5.000m and more than 5.000m.
LULC was also included in the exposure
component. Classes were divided into non-
agricultural features, grain crops, tree crops, and oil
crops. Each class was assigned an exposure weight
based on the ratings of experts. Exposure weight per
LULC in the area should be identified as crop reaction
and/or response to flooding varies.
Out of the 15 experts consulted to rate the degree
of exposure of LULC classes to fluvial flooding, 13
expert ratings were able to meet the tolerance value
of 20 percent. The computed weights using AHP are
shown in Table 1.
Table 1: Weights of LULC classes.
LULC Weight
Non-agricultural features 0.0000
Grain crops 0.5695
Oil crops 0.1617
Tree crops 0.2688
GISTAM 2017 - 3rd International Conference on Geographical Information Systems Theory, Applications and Management
188
Resulting weights indicated grain crops as the
most exposed crop at almost two times more exposed
than tree crops and almost four times more than oil
crops. Some of the factors that affected the ratings
were the degree of resilience of the crops to flooding,
the sturdiness of the crops, and the degree of potential
damage to the crops based on cropping period.
The finalized exposure indicators were based on
the ratings of the 13 experts, 11 of which were
considered consistent. The list of exposure indicators
and their corresponding weights are shown in Table
2.
Table 2: Computed weights of exposure indicators.
Indicator Weight
Flood hazard (area) 0.2429
Flood hazard (level) 0.2869
Flow depth 0.1582
LULC 0.3120
3.4.2 Sensitivity
Sensitivity, an internal factor, is the degree to which
a system is affected, either adversely or beneficially,
by a hazard (Locatelli et al., 2008). It is also defined
as the extent to which a system can absorb impacts
without having a significant change in state (Heng et
al., 2013).
For the study, 13 sensitivity indicators as listed in
Table 3 were determined and rated by the experts;
most of these indicators were collected through KIIs
with farmer households. Five experts (out of the 14
local experts) met the required 0.2 CR value.
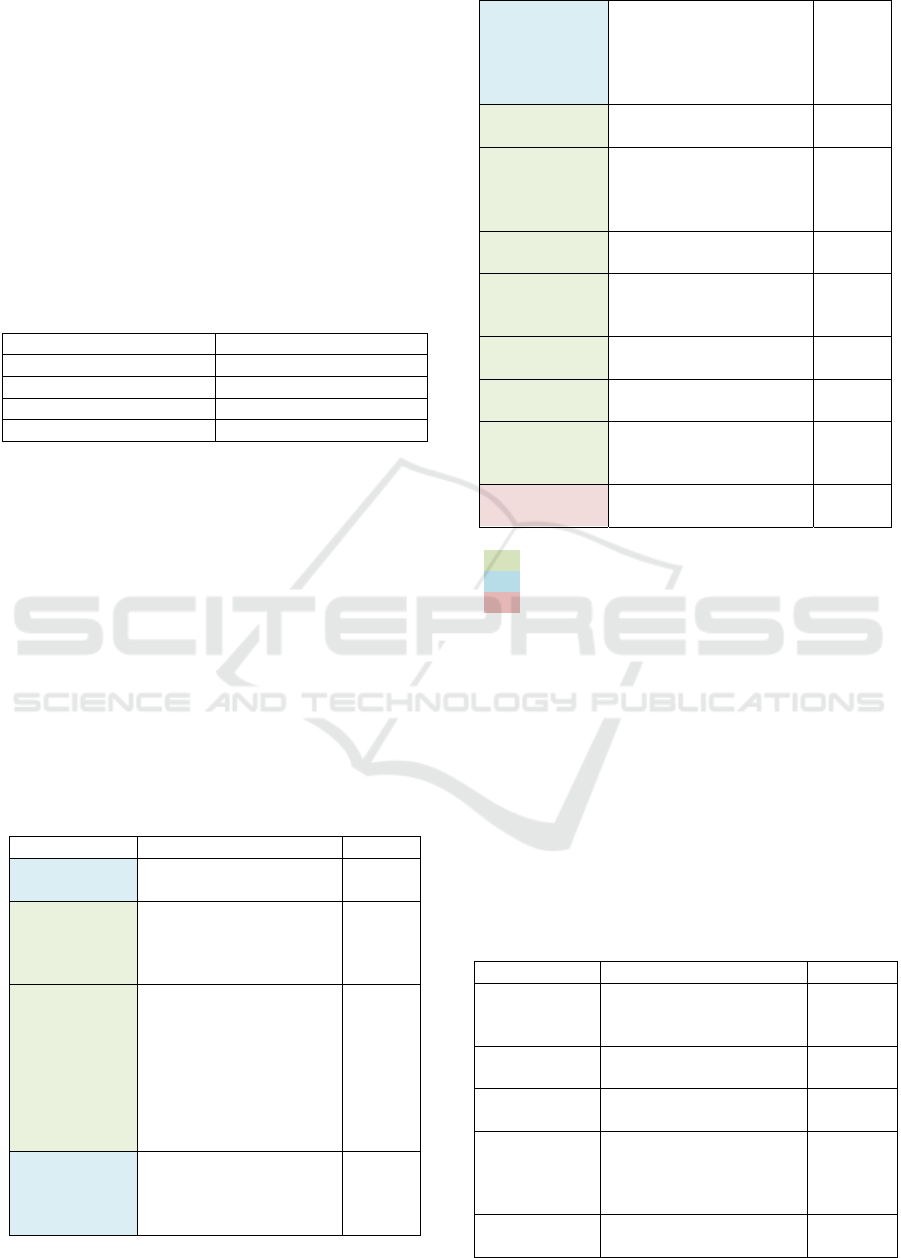
Table 3: Sensitivity indicators identified by the experts and
corresponding weights determined using AHP.
Indicator Description Weight
Population
density
2
Ratio of the number of
people per 1km
2
0.1040
Dependence
ratio
1
Ratio of the number of
unemployed HH
members to total number
of HH members
0.0646
Human
sensitivity
1
Ratio of number of HH
members that are elderly
(65y/o<), children
(>5y/o), PWD (person
with disability),
pregnant, with chronic
illness to total number of
HH members
0.0786
Hunger
incidence
2
Households were asked
if they experienced
hunger in the past three
months
0.0562
Poverty rate
2
Number of households
meeting the poverty
threshold of the province
over the total number of
households
0.0490
Level of
education
1
HH member with highest
educational attainment
0.0381
Tenurial
status
1
Ownership of the
agricultural land (i.e.
owned, leased, tenant,
etc.)
0.1008
Membership
1
Membership in a
farming organization
0.0691
Percent agri
income
1
Percent of income from
agriculture over total
income
0.1128
Percent debt
1
Percent of debt over total
income
0.0983
Access to
PHF
1
Access to post-harvest
facilities
0.0954
Access to
roads and
bridges
1
Access to various
transportation media
0.0761
Road density
3
Ratio of road area to
land area
0.0570
Legend
1
Gathered from HH surveys
2
From CBMS (Community-Based Mapping System)
3
Derived from LULC
3.4.3 Adaptive Capacity
Adaptive capacity, an external factor like exposure, is
the ability of a system to adjust to a hazard (Locatelli
et al., 2008) or evolve (Doch et al., 2015) in order to
accommodate environmental hazards and neutralize
potential damages, or to take advantage of
opportunities of planning to expand its range of
variability for coping. The data for the 12 adaptive
capacity indicators (Table 4) were gathered from HH
surveys and were consistently rated by 13 experts.
Table 4: Adaptive Capacity indicators identified by the
experts and corresponding weights determined using AHP.
Indicator Description Weight
Percent non-
agri income
Percent of income from
non-agriculture activities
over total income
0.1004
Percent
savings
Percent assets/savings
over total income
0.0932
Access to loan
HH access to loans or
credits
0.0969
Access to
financial aid
HH access to financial
aid from government
and/or non-government
organizations
0.0878
Access to
rehabilitation
HH access to
rehabilitation and aid
0.1210
Assessing the Vulnerability of Agricultural Crops to Riverine Floods in Kalibo, Philippines using Composite Index Method
189

Table 4: Adaptive Capacity indicators identified by the
experts and corresponding weights determined using AHP
(cont.).
Indicator Description Weight
Access to
training
courses
HH access to training
courses focused
particularly on climate
variability and farming
0.0685
Farming
experience
Length of farming
experience of the HH
0.0646
Crop selection
Whether crop selection is
determined by
season/potential hazards
0.0746
Level of
mechanization
Level of agricultural
mechanization (e.g. use
of machineries)
0.0846
Insurance
Insurance of agricultural
land and/or crops
0.1045
Disaster and
hazard policy
Disaster preparedness 0.0557
Means of
transportation
Means of transportation
of the HH (motorized
and non-motorized)
0.0482
3.5 Vulnerability Index
The overall vulnerability index of the agricultural
crops was computed using the formula:
Vulnerability V = [(Exposure E +
Sensitivity S) - (Adaptive Capacity A)]
(2)
It was acknowledged by Doch et al. (2015) that
vulnerability is scale dependent since the scale of
analysis affects the result and the pattern being
identified. Because the datasets have different scales,
the level of analysis was set to barangay level and
with a 500m x 500m grid. Political boundaries
acquired from NSO were intersected with a generated
500m x 500m fishnet to produce clipped tiles based
on the agricultural barangay boundaries. Calculations
were made per tile. Moreover, area weighted average
per barangay was also computed and a comparison of
the results was then performed.
3.6 Validation of Vulnerability Maps
To validate the results of the vulnerability index,
historical accounts and damage reports were
requested from the local planning and agriculture
office of the municipality. Farmer HHs were
interviewed regarding the frequency and magnitude
of flooding in the area and the damage caused to the
agricultural sector. First-hand experiences were also
recorded to aid in the analysis and validation of the
vulnerability maps.
4 RESULTS AND DISCUSSION
A model was created in ArcMap to automate the
processing of datasets from data pre-processing to the
production of exposure, sensitivity, adaptive capacity
and vulnerability shapefiles. Scripts were also
provided for the normalization of exposure data.
Using the constructed model, values of exposure,
sensitivity, adaptive capacity per agricultural
barangay were calculated as illustrated in Figure 5.
The stacked bars depict the vulnerability index
equation. The first set of bars represents the potential
impact, i.e., the combined effects of exposure and
sensitivity, which may be caused by the hazard. The
vulnerability ratings of the barangays were obtained
by subtracting the positive implications of adaptive
capacity from the potential impact.
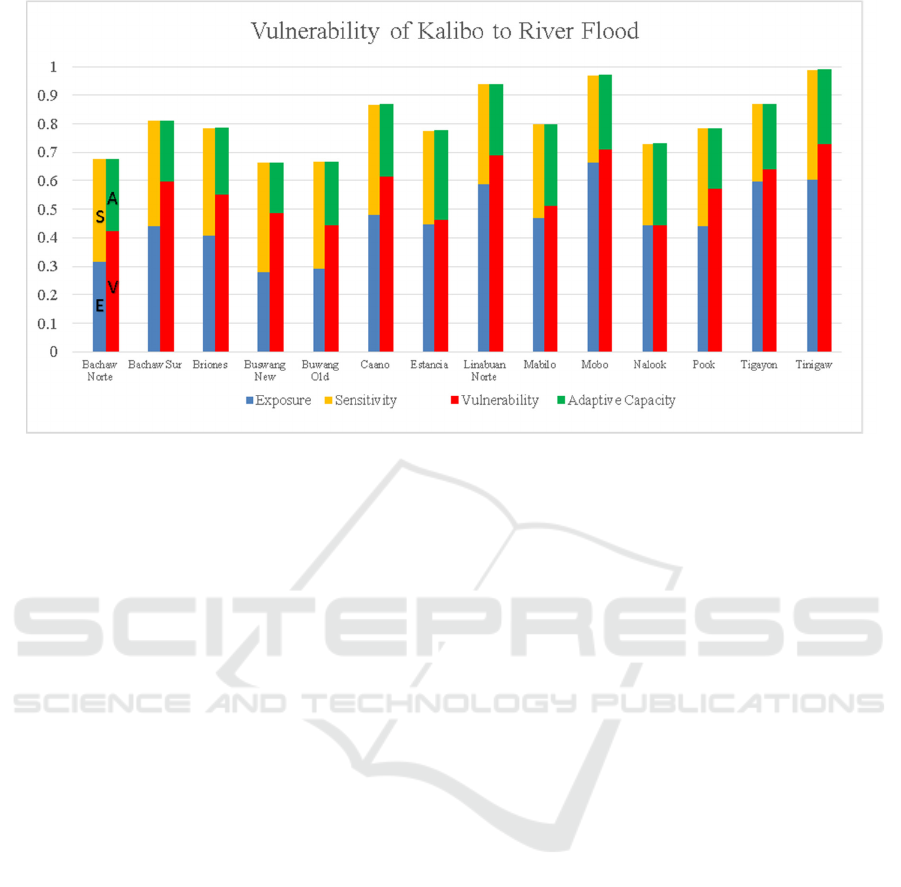
As observed in the results, Tinigaw was tagged to
be the most vulnerable barangay with a rating of
0.7286 followed by Mobo with 0.7081. Linabuan
Norte and Tigayon were not far behind with ratings
of 0.6878 and 0.6393, respectively. Another barangay
above the 0.6 vulnerability rating was Caano with
0.6149.
When the flood hazard, flow depth, and LULC
maps were inspected, four out of the five most
vulnerable barangays were found to be located along
the river. Since overflow of water from the river is
one of the primary drivers of flood hazard in the
subject area, barangays adjacent to the river were
expected to be more vulnerable, as supported by the
produced maps. Furthermore, based on actual
interviews with the farmers, the effects of riverine
flooding in their barangays were certainly prominent
especially when the water level in the river became
higher than usual, further amplified by heavy rains
brought by typhoons.
Caano is the only barangay not located along the
river. It is mostly covered with agricultural crops,
particularly grain crops which were scored as the
most vulnerable to flooding. This pulled the exposure
rating of the said barangay since LULC has the
highest weight for the exposure component.
GISTAM 2017 - 3rd International Conference on Geographical Information Systems Theory, Applications and Management
190
When the exposure ratings alone were inspected,
a great difference between the values of the top two
most vulnerable barangays was observed. Mobo, in
fact, was more exposed by more than 0.06. However,
the populace of Tinigaw was considered more
sensitive.
The next barangays in the ranking, Bachaw Sur,
Pook, and Briones, showed the same trend having
relatively similar values of exposure, sensitivity, and
adaptive capacity. Also, these barangays have the
same geographical features, i.e., are near water bodies
and are covered by agricultural crops.
Mabilo and Buswang New, the succeeding
barangays in the ranking, are coastal barangays.
Based on the previously discerned trends, it could be
assumed that these barangays should have the same
vulnerability rates with the other barangays near
water bodies, in close proximity to either the river or
the sea. However, the results diverged from these
deductions, with the reason perceived to be the land
cover of the area. Since agricultural crops are not very
prominent in the area, the land cover was not subject
to much exposure.
In the case of Estancia, its computed hazard
(exposure and sensitivity) was almost 0.8 – near the
hazard value of Pook which ranked 7
th
. However, its
vulnerability score was not as high due to the counter
effect of its adaptive capacity.
Nalook, on the other hand, is situated far from
bodies of water. Though covered mostly by
agricultural crops, Nalook was not perceived to be
vulnerable because of its relatively greater distance
away from the river and the sea.
The least vulnerable barangays, Buswang Old and
Buswang New, have the exact opposite situation from
that of Nalook. Both barangays are near the river and
are coastal barangays. Additionally, very few
agricultural crops were planted in the area. This was
also verified during the HH survey as less than ten
farmer households were known to the barangay
offices.
These results were validated with the agricultural
crops damage report prepared by the Kalibo
agriculture office (2008). Based on the report during
Typhoon Frank, Mobo was the most devastated
barangay with damages amounting to almost PHP 7
million. In addition to that, more than PHP 3 million
worth of agricultural products and infrastructure were
destroyed in Linabuan Norte, and Tigayon. The
farmers’ first-hand experiences corroborated the
results of the map with almost 75 percent of the
respondents confirming the destruction brought by
Frank.
The computed area weighted average of cells per
barangay was compared with its corresponding
vulnerability value computed using the NSO
boundary. Identical rankings were observed in both
datasets, although the results using grids were
consistently lower as illustrated by the bar graph in
Figure 6. Further, discrepancies in the data increase
as the vulnerability values for both scales increase.
Figure 5: Computed values of every agricultural barangay. Blue bars indicate the exposure (E) rating of the barangays, yellow
bars represent sensitivity (S), green bars portray the offset caused by adaptive capacity (A), and red bars show the computed
vulnerability (V) ratings of the barangays.
Assessing the Vulnerability of Agricultural Crops to Riverine Floods in Kalibo, Philippines using Composite Index Method
191
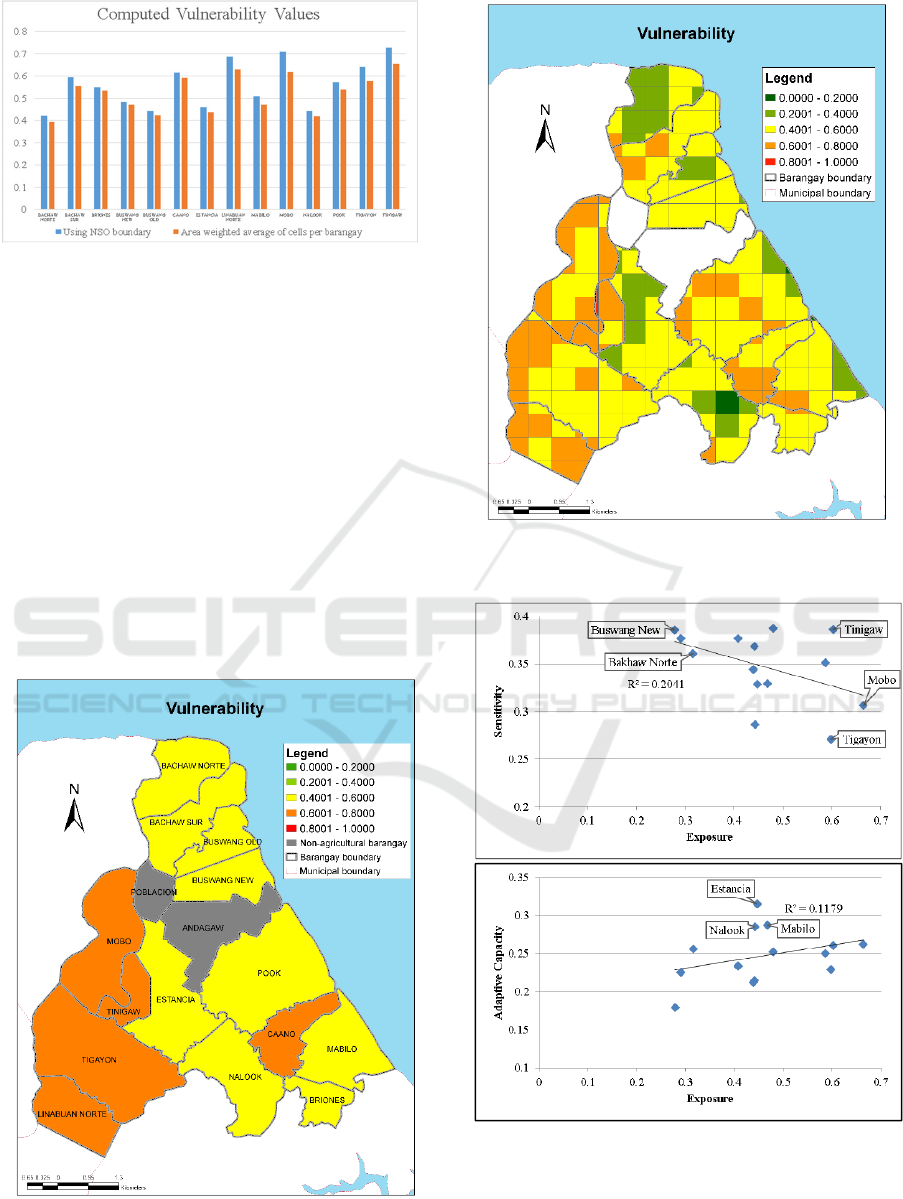
Figures 6: Vulnerability index values computed using two
different scales.
The observed trends may be attributed to the
generalization of the barangay data. Since an
assumption was made that the primary HH data
gathered applied to the entire barangay, generalizing
the inputs amplified the effect of the indicators.
Setting a smaller grid size may further decrease the
vulnerability values. Thus, it is recommended for
future studies to conduct geotagging during the
farmer HH interviews for a more accurate dataset
coverage. Moreover, participatory mapping will be
beneficial especially in analysing the results. Further
researches on the effect of scale in the computation of
vulnerability indices is recommended.
Vulnerability maps representing the results of the
composite index are shown in Figures 7 and 8.
Figure 7: Barangay-level vulnerability of agricultural crops
to floods in Kalibo.
Figure 8: Vulnerability of agricultural crops to floods in
Kalibo using 500m x 500m grid.
Figure 9: Plot of exposure vs. sensitivity values (top) and
exposure vs. adaptive capacity values (bottom).
Shown in Figure 9 are scatter plots of the
computed component values per barangay. The plots
GISTAM 2017 - 3rd International Conference on Geographical Information Systems Theory, Applications and Management
192

show the distribution of exposure values versus
sensitivity and adaptive capacity values. In the first
plot, it can be observed that the most vulnerable
barangays were also the most exposed. These kinds
of values often lead to the common misconception of
exposure equating vulnerability and sensitivity.
However, when the data was analysed such as in the
case of Bachaw Norte, the data showed that although
it was not the least exposed, it was the least
vulnerable. This was due to its relatively lower
sensitivity. A number of barangays were tagged as
having moderately high vulnerability because of the
linear relationship between exposure and sensitivity
(R
2
= 0.2041). To counteract the effect of exposure,
sensitivity should be low, i.e. a plot of the two should
form a steep inverse slope.
In the second plot (Figure 9), Estancia, Nalook,
and Mabilo have lower vulnerability ratings despite
their high exposure values because of their adaptive
capacity values. Lower vulnerability ratings are
attained when the plot of exposure versus adaptive
capacity forms a steep slope.
In general, the relationships of exposure to
sensitivity and adaptive capacity as shown in Figure
9 provide indication that Kalibo and its barangays
over the years have somehow adapted to some degree
in dealing with flood hazards. Barangays with greater
exposure have higher sensitivity and some barangays,
which have higher exposure, have relatively lower
sensitivity. It can also be said that barangays with
relatively higher exposure have developed ways such
that they have higher adaptive capacity.
5 CONCLUSIONS
Vulnerability of the agricultural sector to fluvial
flooding is influenced by a number of factors.
External factors alone do not dictate the state of the
municipality. The socio-economic and agro-ecologic
status of the affected community greatly contributes
to the overall condition of the subject area. Thus,
internal factors i.e. factors that are within the control
of the community must be identified, assessed, and
addressed. Moreover, identifying the factors affecting
the vulnerability of Kalibo and assessing them are
crucial in improving the condition of the municipality
through planning, effective decision making and
imposing policies that can ameliorate the coping
capabilities and adaptive capacity of the community.
As illustrated by the case of Estancia,
vulnerability was alleviated because of the adaptive
measures of either the households or the barangay.
For a more efficient response to force majeure, a
collective effort from both the farmers and the local
government unit is required. Likewise, vulnerability
maps, plans, and policies are useless when they are
not utilized and followed. Therefore, action from and
coordination of all involved individuals and groups is
essential. Although vulnerability assessment is not a
panacea, this study can serve as a practical guide in
alleviating the damage caused by riverine flooding in
the agricultural sector of Kalibo, Aklan.
The results will be provided to local government
units and stakeholders to aid in the decision making
process for generating policies and/or programs that
may improve the adaptability of the agricultural
system during the occurrence of flooding.
ACKNOWLEDGEMENTS
This research was made possible through the funding
of Department of Science and Technology (DOST)
and monitoring by the Philippine Council for
Industry, Energy and Emerging Technology Research
and Development (PCIEERD). The algorithms and
workflows were developed using the spatial and
satellite image data from DREAM/Phil-LiDAR 1
Program. Technical facilities and support were
provided by the UP College of Engineering,
Department of Geodetic Engineering and Training
Center for Applied Geodesy and Photogrammetry.
The project was also supported by the Department
of Agriculture through the Information and
Communications Technology Service (ICTS).
The project acknowledges everyone who has
contributed to this research especially the consulted
national and local experts, local government offices,
and farmer household survey respondents.
REFERENCES
Alonso, J. and Lamata, T. (2006). Consistency in the
Analytic Hierarchy Process: A New Approach.
International Journal of Uncertainty, Fuzziness and
Knowledge-Based Systems, 16(4), 445-459.
Bogardi, J.J., Villagran De Leon, J.C., Birkmann, J.,
Renaud, F., Sakulski, D., Chen, X., Affeltranger, B.,
Mensa, A., Kaplan, M. (2005). Vulnerability in the
context of climate change [Workshop]. Retrieved from
https://www.academia.edu/15601966/Vulnerability_in
_the_context_of_climate_change.
Bündnis Entwicklung Hilft & United Nations University –
Institute for Environment and Human Security (2016).
World Risk Index. Retrieved from
http://weltrisikobericht.de/english.
Assessing the Vulnerability of Agricultural Crops to Riverine Floods in Kalibo, Philippines using Composite Index Method
193

Butzen, S. (n.d.). Flooding Impact on Crops. Retrieved
from:
https://www.pioneer.com/home/site/us/agronomy/crop
-management/adverse-weather-disease/flood-impact/
Centre for Research on the Epidemiology of Disasters -
CRED (2016). In The International Disaster Database.
Retrieved November 15, 2016, from
http://www.emdat.be/country_profile/index.html.
Cuesta, M. and Rañola, R., Jr. (2009). Adaptive Capacity of
Rice Farmers to Rainfall Variability and Extremes in
the Province of Camarines Sur, Philippines.
Philippagric Scientist, 92(4). Retrieved from:
https://journals.uplb.edu.ph/index.php/PAS/article/vie
w/350.
Dang Dinh Kha, Tran Ngoc Anh and Nguyen Thanh Son
(2011). Flood vulnerability assessment of downstream
area in Thach Han river basin, Quang Tri province.
Retrieved from:
hmo.hus.vnu.edu.vn/file.php?file_id=459.
Disaster Risk Exposure and Assessment for Mitigation
[DREAM] (2016). Aklan: DREAM Flood Forecasting
and Flood Hazard Mapping. Quezon City: UP Training
Center for Applied Geodesy and Photogrammetry
(TGACP).
Disaster Risk Exposure and Assessment for Mitigation
[DREAM] (2016). Aklan: DREAM LiDAR Acquisition
and Processing Report. Quezon City: UP Training
Center for Applied Geodesy and Photogrammetry
(TGACP).
Doch, S., Diepart, J.-C. and Heng, C. (2015). A multi-scale
flood vulnerability assessment of agricultural
production in the context of environmental change: The
case of Sangkae River watershed, Battambang
province. In Diepart, J.-C., (ed.) Learning for
resilience: Insights from Cambodia’s rural
communities, Phnom Penh: The Learning Institute, pp.
19-49.
Google Earth (2016). Retrieved November 15, 2016.
Heng, C., Doch, S. and Diepart, J.-C. (2013). Towards
Measuring the Vulnerability of Agricultural Production
to Flood: Insight from Sangkae River Cathcment,
Battambang Province, Cambodia. (IJERD)
International Journal of Environmental and Rural
Development, 4(2). Retrieved from:
http://iserd.net/ijerd42/42015.pdf.
International Strategy for Disasrter Reduction (2004).
Living with risk: A global review of disaster reduction
initiative. Geneva: UN Publications. Retrieved from:
http://www.unisdr.org/files/657_lwr1.pdf.
IPCC (2014). Summary for policymakers. In: Climate
Change 2014: Impacts, Adaptation, and Vulnerability.
Part A: Global and Sectoral Aspects. Contribution of
Working Group II to the Fifth Assessment Report of the
Intergovernmental Panel on Climate Change [Field,
C.B., V.R. Barros, D.J. Dokken, K.J. Mach, M.D.
Mastrandrea, T.E. Bilir, M. Chatterjee, K.L. Ebi, Y.O.
Estrada, R.C. Genova, B. Girma, E.S. Kissel, A.N.
Levy, S. MacCracken, P.R. Mastrandrea, and L.L.
White (eds.)]. Cambridge University Press, Cambridge,
United Kingdom and New York, NY, USA, pp. 1-32.
Kluhto, S. (2013). Mathematical Decision Making An
Overview of the Analytic Hierarchy Process. Retrieved
from:
https://www.whitman.edu/Documents/Academics/Mat
hematics/Kluhto.pdf.
Locatelli, B., Herawati, H., Brockhaus, M., Idinoba, M. and
Kanninen, M. (2008). Methods and Tools for Assessing
the Vulnerability of Forests and People to Climate
Change. Center for International Forestry Research.
Mallari, A. E. (2016). Climate Change Vulnerability
Assessment in the Agriculture Sector: Typhoon Santi
Experience. Procedia – Social and Behavioral
Sciences, 216, 440-451. Retrieved from:
http://www.sciendirect.com/science/article/pii/S18770
42815062382.
Mendoza, M.E., Bui Dung The, Heng Naret, Ballaran, V.,
Jr. and Arias, J.K. (2014). Assessing Vulnerability to
Climate Change Impacts in Cambodia, the Philippines
and Vietnam: An Analysis at the Commune and
Household Level. Journal of Environmental Science
and Management, 17(2): 78-91.
Municipality of Kalibo (2016). In Municipal Profile.
Retrieved from: http://www.kaliboaklan.gov.ph/wp-
content/uploads/2016/05/MUNICIPAL-PROFILE.pdf.
Municipal Agriculture Office (MAO) of Kalibo (2008).
Damage Reports of Typhoon Frank.
Municipal Agriculture Office (MAO) of Kalibo (2012).
Damage Reports of Typhoon Quinta.
Municipal Agriculture Office (MAO) of Kalibo (2015).
Kalibo Ecological Profile.
Parry, M, Canziani, P., Palutikof, J., van der Linden, P. and
Hanson, C. (2007). Climate Change 2007: Impacts
Adaptation and Vulnerability. Contribution of Working
Group II to the Fourth Assessment Report of the
Intergovernmental Panel on Climate Change.
Cambridge: Cambridge University Press. Retrieved
from: https://www.ipcc.ch/pdf/assessment-
report/ar4/wg2/ar4_wg4_full_report.pdf.
Philippine Statistics Authority (2016). In Philippine
Standard Geographic Code. Retrieved November 18,
2016 from
http://www.nap.psa.gov.ph/activestats/psgs/province.a
sp?provCode=060400000.
Saaty, T. (1980). The Analytic Hierarchy Process. New
York: McGraw-Hill.
Saaty, T. (2008). Decision making with the analytic
hierarchy process. Int. J. Services Sviences, 83-98.
Senate Economic Planning Office (2013). Natural
Disasters At A Glance. Retrieved from
https://www.senate.gov.ph/publications/AAG%20201
3-04%20-%20Natural%20Disasters_final.pdf.
Wiréhn, L., Danielsson, Â. and Neset, T.-S. (2015).
Assessment of composite index methods for
agricultural vulnerability to climate change. Journal of
Environmental Management, 156, 70-80.
doi:10.1016/j.jenvman.2015.03.020.
GISTAM 2017 - 3rd International Conference on Geographical Information Systems Theory, Applications and Management
194
