
Splice Site Prediction: Transferring Knowledge Across Organisms
Simos Kazantzidis, Anastasia Krithara and George Paliouras
National Center for Scientific Research (NCSR) “Demokritos”, Athens, Greece
Keywords:
Splice Site Recognition, Transfer Learning, Classification.
Abstract:
As more genomes are sequenced, there is an increasing need for automated gene prediction. One of the sub-
problems of the gene prediction, is the splice sites recognition. In eukaryotic genes, splice sites mark the
boundaries between exons and introns. Even though, there are organisms which are well studied and their
splice sites are known, there are plenty others which have not been studied well enough. In this work, we
propose two transfer learning approaches for the splice site recognition problem, which take into account the
knowledge we have from the well-studied organisms. We use different representations for the sequences such
as the n-gram graph representation and a representation based on biological motifs. Furthermore, we study
the case where more than one organisms are available for training and we incorporate information from the
phylogenetic analysis between organisms. An extensive evaluation has taken place. The results indicate that
the proposed representations and approaches are very promising.
1 INTRODUCTION
The field of computational biology and biomedical re-
search offers a variety of applications in big data anal-
ysis, where the role of machine learning is more than
necessary by allowing the modeling of basic mech-
anisms (Giannoulis et al., 2014). Despite the huge
success of data mining technologies, most methods
achieve good results under the assumption that the
training and test data are issued from the same domain
and have the same distribution (Pan and Yang, 2010).
However, when the training and test data come from
different domains, then the model has to be adapted
in order to achieve good performance.
While traditional methods use statistical models
trained with annotated data assuming the same dis-
tribution in test data, transfer learning methods allow
diversity in both distributions and domains. It is now
possible to use prior knowledge for faster and opti-
mized problem solving (Pan and Yang, 2010). In
transfer learning, there are three main issues with
which one has to deal with. Firstly, what part of
knowledge can be transferred. Secondly, how to
transfer and which algorithms are needed in order to
transfer knowledge. Finally, when to transfer and in
which situations transferring should be done.
There are three basic approaches of transfer learn-
ing methods with which are based on the traits of the
source and target domain and task (Pan and Yang,
2010):
1. Inductive Transfer Learning: The target task is
different from the source task and some labeled
data in the target domain are required.
2. Transductive Transfer Learning: The source and
target tasks are the same, while the source and tar-
get domains differ.
3. Unsupervised Transfer Learning: Similar to in-
ductive transfer learning, the target task is differ-
ent from but related to the source task.
In our work, we focus on the transductive trans-
fer learning. In particular, we are taking a closer look
at a common special case of splice site recognition,
where different tasks correspond to different organ-
isms. Splice site recognition is a sub-problem of the
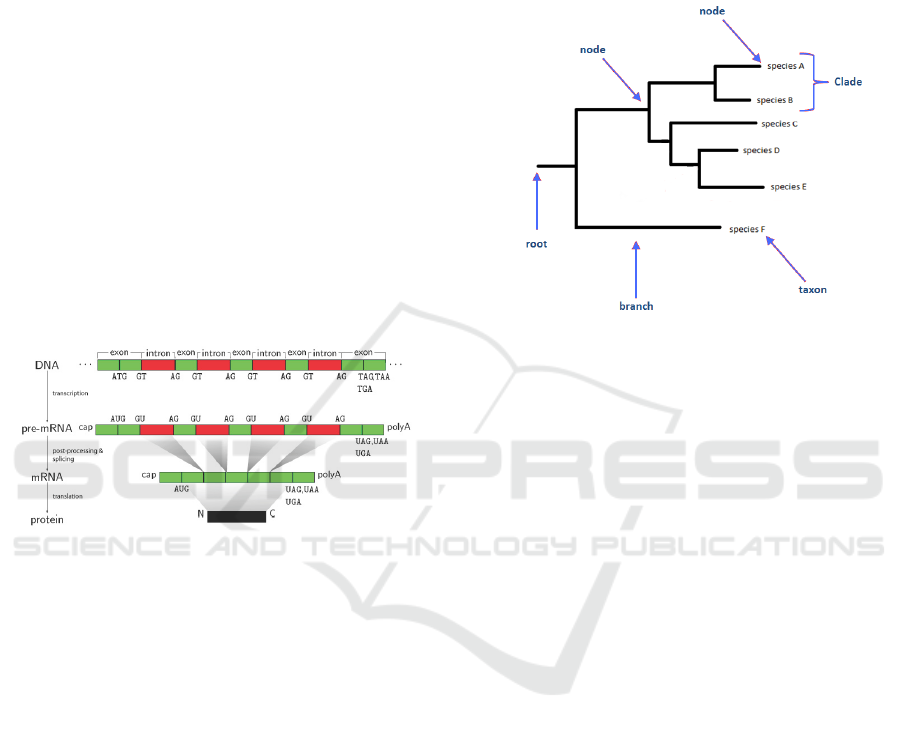
gene prediction problem. Splicing is a process in the
portein synthesis. The major steps in protein synthe-
sis are : transcription, post-processing and translation
(figure 1). In the post-processing step, the pre-mRNA
is transformed into mRNA. The step in the process
of obtaining mature mRNA is called splicing. The
mRNA sequence of a eukaryotic gene is “interrupted”
by noncoding regions called introns. A gene starts
with an exon and may then be interrupted by an in-
tron, followed by another exon, intron and so on until
it ends in an exon. In the splicing process, the introns
are removed. There are two different splice sites: the
exon-intron boundary, referred to as the donor site or
5 site and the intron-exon boundary, known as the ac-
ceptor or 3 site. Thus, by choosing a window close
160
Kazantzidis S., Krithara A. and Paliouras G.
Splice Site Prediction: Transferring Knowledge Across Organisms.
DOI: 10.5220/0006164401600167
In Proceedings of the 10th International Joint Conference on Biomedical Engineering Systems and Technologies (BIOSTEC 2017), pages 160-167
ISBN: 978-989-758-214-1
Copyright
c
2017 by SCITEPRESS – Science and Technology Publications, Lda. All rights reserved
to the splice site and taking k-mers one can get the
most frequently occurring nucleotide. Having aligned
all the sequences, one can notice which nucleotide is
appearing more frequently in each position. As al-
ready mentioned, two types of splice sites must be
identified: the donor and the acceptor. Almost most
of donor sites are a GT dimer and most acceptor sites
are an AG dimer. The fact that these dimers are not
necessarily splice sites, complicates their detection
(Herndon and Caragea, 2015). In human DNA, GT
dimers can be found about 400 million times over-
all in both strands. For this reason, the discrimina-
tion between true donor sites and decoy positions has
to be faced (Sonnenburg et al., 2007). The AG and
GT dimers cannot be used as features due to their fre-
quent appearance in non splice site sequences. Even
the use of positional probabilities was rather a fairly
poor approach (Kamath et al., 2012). To this end, for
splice site recognition, one must solve two classifica-
tion problems: discriminating true from decoy splice
sites for both acceptor and donor sites.
Figure 1: Basic steps of protein synthesis. (Sonnenburg
et al., 2007).
For some organisms, splice site prediction can be
performed more readily than others, as the former are
well studied and the splice site positions are already
known and annotated. This knowledge can then be
transferred to other organisms, where no annotated
data are available, for instance by refining models.
Because all these basic mechanisms tend to be rel-
atively well conserved throughout evolution, we can
benefit from transferring knowledge from a different
organism to another, taking into account the com-
monalities and the differences between the two organ-
isms/domains.
To this end, the idea of this work is to study the
recognition of splice sites in different organisms. It is
assumed that a larger evolutionary distance will likely
also have led to an accumulation of differences in the
splicing positions. We therefore expect that that the
transferring of knowledge across these organisms will
be more difficult.
As we are interested in the evolutionary distance
among organisms, we will take advantage of the ex-
ploration of evolutionary relationships between living
organisms. This area of research is called phyloge-
netic analysis. Phylogenetic analysis is a method that
allows the reporting and evaluation of evolutionary re-
lationships. The evolutionary process resulting from
the information of phylogenetic analysis typically is
displayed by branches and tree diagrams 2.
Figure 2: Part of a phylogenetic tree. (Li and Goldman,
1998).
In the literature, there are several approaches for
splice-site detection. Most of them are based on
Support Vector Machines (SVMs), neural networks
and Hidden Markov Models (HMM). In (R
¨
atsch and
Sonnenburg, 2004), Markov models are proposed,
as well as SVMs with different kernels.(Yamamura
et al., 2003) proposed the usage of linear SVMs on
binary features computed from di-nucleotides, an
approach which also outperformed previous Markov
models. In (Rajapakse and Ho, 2005), an approach
based on a multilayer neural network method with
Markovian probabilities as inputs has been proposed.
The best performed algorithms from the state-of-
the-art are summarized below:
• SV M
s,t
: SVMs are proposed for splice-site recog-
nition: the SVM classifier is trained, using as la-
beled data, a subsequence consisting of only lo-
cal information around the potential splice site.
A new support vector kernel is also proposed
(Schweikert et al., 2008).
• NBT and A1: Both are based on Na
¨
ıve Bayes
classifier trained on target labeled and source data
and they are both probabilistic models as well.
The first one uses a simple Na
¨
ıve Bayes classi-
fier while the second one is based on improving
the multinomial Na
¨
ıve Bayes classifier, in which
low weights are assigned to the target data (Hern-
don and Caragea, 2015), (Herndon and Caragea,
2016).
Splice Site Prediction: Transferring Knowledge Across Organisms
161
• AFMS: The idea of All Features Majority Strat-
egy (AFMS), is to use the n-graph representation
on different parts of the sequence and apply a
modified version of kNN classifier. It uses major-
ity voting between the proposed representations.
It is observed that knowledge obtained from the
source domain is better to be used only for the
initialization of the kNN and not during the clas-
sification (Giannoulis et al., 2014).
Our work is inspired by the AFMS approach, as it
uses the n-gram graph representation. Nevertheless,
it combines this representation with biological motifs,
and in addition, it proposes two new transfer learning
algorithms. It also extend these approaches in the case
of multi-domain transfer learning, where data from
more than one organism are available for training.
To this end, the main contributions of this work
are:
• Introduction of a novel representation of se-
quences. In order to create our feature representa-
tion, we use two main approaches:
– Use of n-gram graphs: by representing each
DNA sequence as an n-gram graph, we can take
into account the co-occurrences of nucleotides
in the sequence.
– Use of biological information: There are a few
motifs of great importance in order to discover
with high possibility a splice site. Thus, us-
ing such biological information combined with
the n-gram graph representation can help us
achieve higher prediction accuracy.
• Two transfer learning approaches are proposed,
based on the above representation. The ap-
proaches can achieve high performance with low
computational cost.
• Extension of the proposed approach, by incorpo-
rating information from the phylogenetic analysis
between organisms, in the multiple source domain
case.
2 PROPOSED APPROACH
In this work, we propose a new representation for the
sequences, as well as two novel transfer learning ap-
proaches for the problem of splice site recognition
among different organisms.
2.1 Data Representation
As mentioned in the previous sections, in this work,
we combine the n-gram graph representation with bi-
ological features. Two features are extracted from the
n-gram graph representation (Giannakopoulos, 2009),
and ten from the extracted biological information. Be-
low, the details of the feature vector construction are
given.
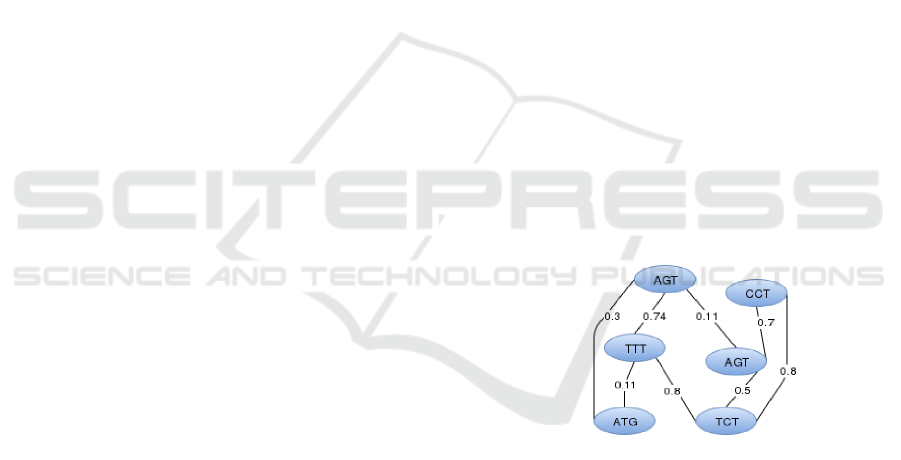
N-gram Graphs. The n-gram graph representation
has been initially proposed in the field of natural lan-
guage processing. N-gram graphs can be described
as a possibly ordered set of words that contains n ele-
ments (Giannakopoulos, 2009).
The n-gram graph is a graph G =<
V
G
, E
G
, L,W >, where V
G
is the set of vertices,
E
G
is the set of edges, L is a function assigning a
label to each vertex and to each edge and W is a
function assigning a weight to every edge. The graph
has N-grams labeling its vertices u
G
∈ E
G
. The edges
u
G
∈ E
G
connecting the n-grams indicate proximity
of the corresponding vertex n-grams. The weight of
the edges can indicate a variety of traits 3.
The n-gram graph framework, also offers a set
of important operators. These operators allow com-
bining individual graphs into a model graph (the up-
date operator), and comparing pairs of graphs provid-
ing graded similarity measurements (similarity oper-
ators). In the sequence composition setting, the repre-
sentation and set of operators provide one more mean
of analysis and comparison, one that is lacking from
widely-implemented models such as HMMs.
Figure 3: n-gram graph example, where n = 3.
For each available sequence a graph is being
created. Assuming that we have two classes, the
positive one (if a sequence is a splice site) and a
negative one. For each of the two classes, we create
two representative n-gram graphs, based on the
sequences from the source domain (our training set)
which belong to each of the classes. The representa-
tive graph for a set of sequences, can be seen as an
analogy to the centroid of a set of vectors.
In the n-gram graph framework there are different
ways to measure similarity. We choose the Value
Similarity (VS) function. This measure quantifies
the ratio of common edges between two graphs,
BIOINFORMATICS 2017 - 8th International Conference on Bioinformatics Models, Methods and Algorithms
162
taking into account the ratio of weights of common
edges. As we want to measure distance instead
of similarity, we use the distance = 1 − V S. For
every sequence of the target domain we calcu-
late the distance from each of the two classes
(i.e. the representative graphs). These two distances
are used as the first two features of our representation.
Table 1: The meaning of base symbols.
Symbol Description Bases
A Adenine A
C Cytosine C
G Guanine G
T Thymine T
U Uracil U
W Weak A,T
S Strong C,G
M aMino A,C
K Keto G,T
R puRine A,G
Y pYrimidine C,T
B not A C,G,T
D not C A,G,T
H not G A,C,T
V not T A,C,G
N any Nucleotide A,C,G,T
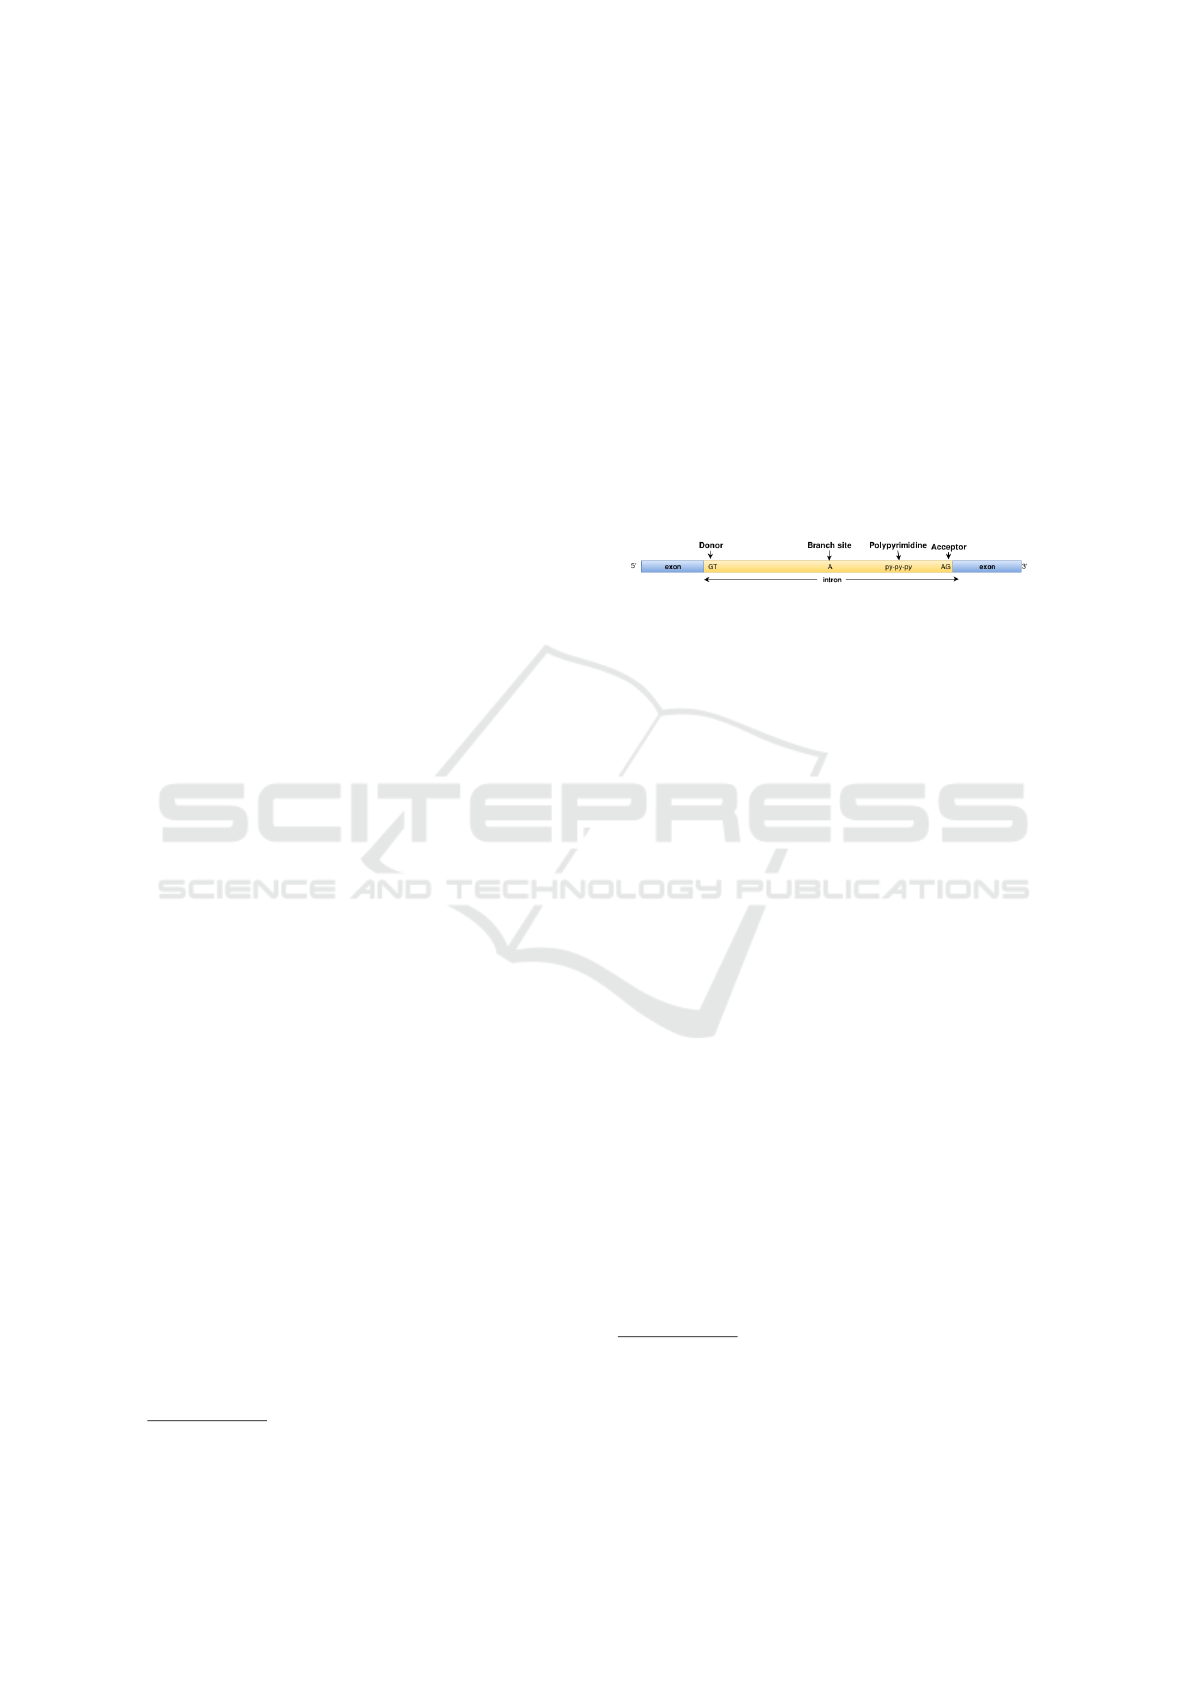
Biological Features. In addition to the n-gram
graphs, we incorporate in our model the following bi-
ological features
1
(figure 4):
• The nucleotide occurrences rates. These rates
are calculated in the area that starts from the po-
sition very close to the branch site (50 nucleotide
left from the acceptor site) and ends at the posi-
tion of the acceptor site. Thus, four features are
extracted (one for each of the four nucleotide).
• The sum of the occurrences rates of the purine
and pyrimidine scores.The later expresses the
probability of more frequent C and T nucleotides
occurrence. Thus, two features are extracted.
• The branch site Motif “ynyyrAy”(Wikipedia,
2004). This motif is usually detected 20 − 50
nucleotides before the acceptor dimer AG. The
Smith and Waterman’s algorithm (Smith and Wa-
terman, 1981) is used for the local pairwise se-
quence alignment between this part of the se-
quence and the Branch motif, providing a score
which is used as a feature.
• The acceptor Motif “AG”. This dimer is a motif
for most acceptor sites while the general motif is
“yAGr” (Wikipedia, 2004). As before, a score is
1
In table 1 the meaning of the used symbols are given.
provided using the Smith and Waterman’s algo-
rithm. The alignment score is used as a feature.
• The global pairwise alignment score from both
sequences of the merged n-gram graphs. More
specifically, the merged n-gram graphs are trans-
formed to two sequences, which can be con-
sidered as the mean sequences for each of the
two classes (i.e the sequences that uniquely
characterize the mean n-gram graphs)
2
. The
Needleman-Wunsch algorithm (Needleman and
Wunsch, 1970) is used for the global pairwise
sequence alignment between each sequence and
these two “mean” sequences. Consequently, two
features are being extracted.
Figure 4: Splice site Motifs (wikipedia).
Based on the above steps, ten biological features
are extracted. It is worth mentioning that in the case of
the nucleotide occurrences rates, we can use k-mers
3
as well. Additionally, concerning the pairwise align-
ment score, both global and local alignment can being
applied between each sequence and the mean graphs
sequence, using the algorithm mentioned above
4
.
2.2 Transfer Learning Approaches
Using the above representation, we examine two al-
gorithms for the splice site recognition problem. The
first one tries to identify the most similar target se-
quences to the source domain and feed them to the
classifier, while the second transforms the target se-
quences in order to bridge the gap with the source
ones.
2.2.1 First Approach
The basic idea of the first approach concerns the
merging of instances from the source domain that are
more similar to those of the target domain (see algo-
rithm 1). The idea is to do a first classification of the
target data, using k-means and SVM, then enrich the
learned data with the most similar ones from the train-
ing set and train a classifier.
More precisely, using k-means algorithm we split
the target data into two clusters. We then use an
2
This functionality is provided from the n-gram graph
toolkit: https://sourceforge.net/p/jinsect/
3
In computational genomics, k-mers are all the possible
subsequences of length k.
4
BioJava package is used: http://tinyurl.com/zvv9ra9
Splice Site Prediction: Transferring Knowledge Across Organisms
163

Algorithm 1: First approach.
Input: Data from source and target organisms,
Process:
1. Cluster target sequences using k-means algorithm
2. Train an SVM classifier to the source sequences
3. Using the trained SVM, characterize the clusters:
• Negative cluster ← the cluster with more non-
splice sites sequences
• Positive cluster ← the cluster with more splice
sites sequences
4. Identify the most similar sequences to the identified
cluster centroids (using cosine similarity)
5. Enrich the predicted target sequences with the above
source sequences
6. Train a classifier
Output: The target data classified
SVM classifier (trained to the source data), in order to
characterize the cluster with the larger amount of non
splice sites sequences as a negative cluster. We com-
pute the most similar source sequences for each of
the computed cluster with the use of cosine similarity.
The selected sequences, together with the predicted
target sequences, are considered as our training set.
Using the later, we train a classifier and learn a model
in order to be able to classify.
2.2.2 Second Approach
The second approach is an extension of the previous
one. It follows the same steps as the first one in or-
der to identify the most similar source and target se-
quences (steps 1-5 in algorithm 1). Then, based on
the following equation (1), we “transform” the initial
target sequences with the help of the mean feature val-
ues of the source and target sequences. In particular,
we calculate the mean value of each of the features,
using the sequences from step 5 of the algorithm
(mean
source
from the selected source sequences and
mean
target
from the target sequences). Using a param-
eter α, we give more or less weight in the proposed
transformation. The effect is to rescale the features of
each sequence, putting more weight on features that
are common in the source but rarely seen in the target
(in a conditional sense), and down-weighting features
that occur frequently in the target but rarely in the
source (Arnold et al., 2007). Using the transformed
sequences, the SVM algorithm is retrained.
f
x
= α ∗ f
x
+ (1 − α) ∗
mean
source
( f
x
)
mean
target
( f
x
)
(1)
Multi-domain Case. For the special case when
more than one organism is available for training, we
apply Phylogenetic analysis, in order to take into ac-
count the distance between organisms. The closer the
organisms, the more similar the data are, and thus the
splice sites will have a corresponding similarity.
In order to calculate the distance between the or-
ganisms, we use a conserved region that exists in all
of them (i.e. a protein (Mller et al., 2007)). We apply
the analysis as explained in the introduction and get a
distance matrix, which we then convert into rates. The
latter is used as weights to the respective instances.
3 EXPERIMENTS AND RESULTS
3.1 Dataset
For the experimental evaluation of the above ap-
proaches, we used the dataset from (Schweikert
et al., 2008). The dataset consists of sequences
of the following organisms: H.sapiens, D.rerio,
D.melanogaster, C.elegans and A.thaliana. In this
work we focus only on the acceptor splice sites. In
the first part of the experiment, where we investigate
the different parameters of our approach, all different
combinations of the above organisms are explored.
For these experiments, we choose 6.500 sequences
from each organism, 70% of which are used as train-
ing and 30% as test
5
.
In the second part of our experiments, where we
compare with the state-of-the-art methods, we used
the very well studied model organism C.elegans as the
source organism, and the rest as target (Widmer and
Ratsch, 2012), (Herndon and Caragea, 2016). In par-
ticular, as target organisms, we chose two additional
nematodes, namely, the close relative C.remanei,
which diverged from C.elegans 100 million years ago,
and the more distantly related P.pacificus, a lineage
which has diverged from C.elegans more than 200
million years ago. As a third target organism we used
D.melanogaster, which is separated from C.elegans
by 990 million years. Finally, we consider the plant
A.thaliana, which has diverged from the other organ-
isms more than 1, 600 million years ago. For this set
of experiments, different size of sequences for each
target organism is used (2, 500, 6, 500 and 40, 000), as
proposed in the literature.
The sequences are made up from 200 nucleotides
(figure 5) and only 1% of the sequences are splice
sites (i.e. positive instances). In the next section we
present the results for the acceptor splice site, but the
results for the donor are also similar.
5
The split to training and test was performed 5 times and
the average performance is presented.
BIOINFORMATICS 2017 - 8th International Conference on Bioinformatics Models, Methods and Algorithms
164
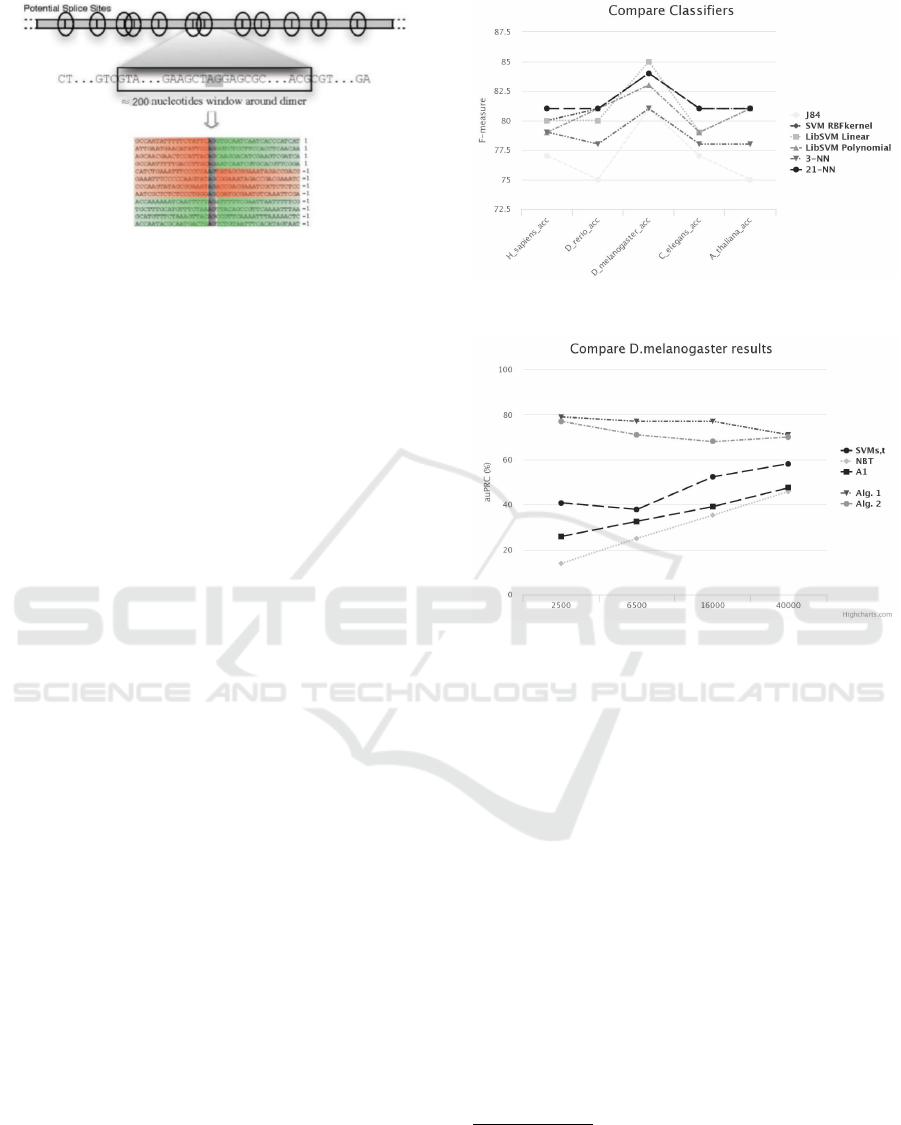
Figure 5: Example of splice sites and non splice site se-
quences. (R
¨
atsch et al., 2007).
The F-measure and the area under the Precision
Recall Curve (auPRC) metrics are being used as eval-
uation measures.
3.2 Results
N-gram graphs have some parameters that must be
initialized such as min, max and distance value. The
distance is a window, while min and max values are
the limits for the size of the combinations that can be
made in this window. Depending on these values, a
feature can obtain high resolution efficiency. These
values were selected experimentally, having in mind
that triplets of nucleotides are being used during the
DNA translation process (e.g. defining min=3, max=4
and distance=3, n-gram graph will represent the se-
quences with motifs consisted of three and four nu-
cleotides). We tested several values for the parame-
ters of the n-gram graph. We achieved the best results
with the following values: min=3, max= 4 and dis-
tance=3.
In order to evaluate the proposed feature represen-
tation, we first experimented using same well-known
classifiers. In particular, we tested Decision Trees,
SVM (with different kernels) and k-NN (using the
Manhattan distance). In figure 6 the obtained results
for all organisms are presented. In all cases, the men-
tioned organism in the x-axis is the source one, while
the result is the average obtained result, be consider-
ing each of the rest organisms as targets. We notice
that in almost all organisms (except D.melanogaster)
the best results are achieved using the KNN classifier.
The latter indicates that using the proposed represen-
tation, we can obtain good results, with a very simple
classifier.
We then evaluated the two transfer learning algo-
rithms. The obtained F-measure of our algorithm is
being presented in tables 2 and 3.
As we can notice, the first approach seems to per-
form better than the second one, which means that the
transformation step does not help as expected.
Figure 6: Comparison of different classifiers.
Figure 7: Comparison with the state of the art.
The two algorithms were also evaluated in the
multiple source domain case (tables 4 and 5
6
). In this
case, the distances from phylogenetic analysis are in-
corporated as weights in both algorithms.
Comparing the results, we notice that the weights
help the algorithm to take advantage of the closest or-
ganisms and achieve similar results with the best of
the two source organisms, while the results without
the weights lead to slighter worse results.
Comparison with the state-of-the-art. The over-
all results are being presented and compared with the
state-of-the-art algorithms. The performance of the
models are evaluated by measuring the accuracy in
terms of auPRC.
State-of-the-art algorithms are based in proba-
bilistic models and when they use bigger data sets
for training in order to achieve better performances,
the computational cost increase (Widmer and Ratsch,
6
H.Sapiens organisms is notated as S or Sap, Rerio or-
ganisms is notated as R or Rer, e.t.c. The columns of the
tables present the source organisms (pairs in the particu-
lar example), while the rows present the target organisms.
Please note that in case the same organism is included both
in the source and target domain is indicated with a −.
Splice Site Prediction: Transferring Knowledge Across Organisms
165

Table 2: First Algorithm results.
Target
domain
Source domain
H.sapiens D.rerio D.melanog. C.elegans A.thaliana
H.sapiens 0.84 0.83 0.87 0.82 0.82
D.rerio 0.81 0.84 0.83 0.75 0.80
D.melanog. 0.81 0.82 0.86 0.84 0.82
C.elegans 0.80 0.72 0.83 0.87 0.78
A.thaliana 0.79 0.82 0.79 0.80 0.83
Table 3: Second Algorithm results.
Target
domain
Source domain
H.sapiens D.rerio D.melanog. C.elegans A.thaliana
H.sapiens 0.82 0.83 0.85 0.78 0.77
D.rerio 0.79 0.81 0.82 0.72 0.80
D.melanog. 0.81 0.67 0.86 0.80 0.78
C.elegans 0.81 0.60 0.84 0.87 0.76
A.thaliana 0.81 0.79 0.79 0.78 0.83
Table 4: Multiple Source Domain results for the first algorithm.
organisms M,R M,T M,S S,R S,T M,E R,T S,E R,E T,E
Sap. 0.86 0.86 - - - 0.85 0.85 - 0.84 0.77
Rer. - 0.81 0.82 - 0.81 0.81 - 0.81 - 0.79
Melang. - - - 0.81 0.82 - 0.85 0.82 0.84 0.85
Eleg. 0.83 0.84 0.83 0.78 0.80 - 0.81 - - -
Thal. 0.80 - 0.79 0.81 - 0.81 - 0.82 0.82 -
Table 5: Multiple Source Domain results for the second algorithm.
organisms M,R M,T M,S S,R S,T M,E R,T S,E R,E T,E
Sap. 0.83 0.83 - - - 0.83 0.83 - 0.83 0.83
Rer. - 0.80 0.81 - 0.76 0.80 - 0.78 - 0.79
Melang. - - - 0.78 0.78 - 0.84 0.81 0.84 0.82
Eleg. 0.81 0.83 0.83 0.75 0.79 - 0.81 - - -
Thal. 0.77 - 0.79 0.76 - 0.80 - 0.80 0.81 -
Figure 8: Comparison with the state of the art.
2012; Herndon and Caragea, 2015). In our approach,
we took advantage of both the n-gram graphs and
the biological information, keeping the feature space
small (only ten features). We noticed that despite the
datasets size, our results are fairly close. Furthermore,
the time needed in order to execute the biggest ex-
periment did not exceeded a day using a state of the
art computer (while (Widmer and Ratsch, 2012) for
example, indicates that it took several days/weeks to
run the experiments). Concerning the two algorithms
we proposed, the obtained results indicate that they
clearly outperform the state-of-the-art approaches for
all organisms. In figures 7 and 8, the results for
D.Melanogaster and A.Thaliana are presented.
BIOINFORMATICS 2017 - 8th International Conference on Bioinformatics Models, Methods and Algorithms
166

4 CONCLUSIONS AND FUTURE
WORK
This work is focused on the problem of finding splice
sites, by developing two transfer learning algorithms
using a new feature representation, based both on n-
gram graphs and biological information
7
.
We noticed from our results that our work con-
tributed in the field of splice site recognition in an im-
portant manner. Using the proposed representation,
we managed to achieve higher prediction accuracy
than the current approaches of the state-of-the-art.
In addition, the proposed representation uses a small
amount of features, which help us achieve high per-
formances quickly and with low computational cost.
As future steps, we consider a deeper investiga-
tion of the biological knowledge that can be used, as
it seems to be the key factor of our method. In addi-
tion, different transfer learning approaches will be in-
vestigated, in order to take into account the proposed
representation more efficiently.
REFERENCES
Arnold, A., Nallapati, R., and Cohen, W. (2007). A compar-
ative study of methods for transductive transfer learn-
ing. pages 77–82.
Giannakopoulos, G. (2009). Automatic summarization
from multiple documents, phd thesis, department of
information and communication systems engineering,
university of the aegean.
Giannoulis, G., Krithara, A., Karatsalos, C., and Paliouras,
G. (2014). Splice site recognition using transfer learn-
ing. In Artificial Intelligence: Methods and Applica-
tions, pages 341–353.
Herndon, N. and Caragea, D. (2015). Empirical study of
domain adaptation algorithms on the task of splice site
prediction. In Biomedical Engineering Systems and
Technologies, volume 511, pages 195–211.
Herndon, N. and Caragea, D. (2016). A study of domain
adaptation classifiers derived from logistic regression
for the task of splice site prediction. IEEE Transac-
tions on NanoBioscience.
Kamath, U., Compton, J., Islamaj-Dogan, R., Jong, K. D.,
and Shehu, A. (2012). An evolutionary algorithm
approach for feature generation from sequence data
and its application to dna splice site prediction. In
IEEE/ACM Transactions on Computational Biology
and Bioinformatics, volume 9, pages 1387–1398.
Li, P. and Goldman, N. (1998). Models of molec-
ular evolution and phylogeny. Genome research,
8(12):12331244.
7
The source code is available on:
https://github.com/SimosKaza/splice site recognition
transfer learning
Mller, A., Asp, T., Holm, P., and Palmgren, M. (2007). Phy-
logenetic analysis of p5 p-type atpases, a eukaryotic
lineage of secretory pathway pumps. In Molecular
Phylogenetics and Evolution, page 619634.
Needleman, S. B. and Wunsch, C. D. (1970). A gen-
eral method applicable to the search for similarities
in the amino acid sequence of two proteins. Journal
of Molecular Biology, 48(3):443 – 453.
Pan, S. and Yang, Q. (2010). A survey on transfer learn-
ing. In IEEE Transactions on Knowledge and Data
Engineering, pages 1345–1359.
Rajapakse, J. C. and Ho, L. S. (2005). Markov encoding for
detecting signals in genomic sequences. IEEE/ACM
Transactions on Computational Biology and Bioinfor-
matics, 2(2):131–142.
R
¨
atsch, G. and Sonnenburg, S. (2004). Accurate splice
site prediction for caenorhabditis elegans. In Kernel
Methods in Computational Biology, MIT Press series
on Computational Molecular Biology, pages 277–298.
MIT Press.
R
¨
atsch, G., Sonnenburg, S., Srinivasan, J., Witte, H.,
M
¨
uller, K.-R., Sommer, R., and Sch
¨
olkopf, B. (2007).
Improving the c. elegans genome annotation using
machine learning. PLoS Computational Biology,
3:e20.
Schweikert, G., Widmer, C., Schlkopf, B., and Rtsch, G.
(2008). An empirical analysis of domain adapta-
tion algorithm for genomic sequence analysis. In
Advances in Neural Information Processing Systems,
pages 1433–1440.
Smith, T. and Waterman, M. (1981). Identification of com-
mon molecular subsequences. Journal of Molecular
Biology, 147(1):195 – 197.
Sonnenburg, S., Schweikert, G., Philips, P., Behr, J., and
Rtsch, G. (2007). Accurate splice site prediction using
support vector machines.
Widmer, C. and Ratsch, G. (2012). Multitask learning in
computational biology. pages 207–216.
Wikipedia (2004). Nucleic acid notation - Wikipedia,
the free encyclopedia. [Online; accessed 29 August
2015].
Yamamura, M., Gotoh, O., Dunker, A., Konagaya, A.,
Miyano, S., and Takagi, T. (2003). Detection of the
splicing sites with kernel method approaches dealing
with nucleotide doublets. Genome Informatics Online,
14:426–427.
Splice Site Prediction: Transferring Knowledge Across Organisms
167
