
Actigraphic Sleep Detection for Real-World Data of Healthy Young
Adults and People with Alzheimer’s Disease
Stefan L
¨
udtke, Albert Hein, Frank Kr
¨
uger, Sebastian Bader and Thomas Kirste
Mobile Multimedia Information Systems Group, Institute of Computer Science, University of Rostock,
18051 Rostock, Germany
Keywords:
Sleep Detection, Actigraphy, Hidden Markov Model, Machine Learning, Dementia.
Abstract:
Actigraphy can be used to examine the sleep pattern of patients during the course of the day in their com-
mon environment. However, conventional sleep detection algorithms may not be appropriate for real-world
daytime sleep detection, since they tend to overestimate the sleep duration and have only been validated for
nighttime sleep in a laboratory setting. Therefore, we evaluated the performance of a set of new sleep detection
algorithms based on machine learning methods in a real-world setting and compared them to two conventional
sleep detection algorithms (Cole’s algorithm and Sadeh’s algorithm). For that, we performed two studies with
(1) healthy young adults and (2) nursing home residents with Alzheimer’s dementia. The conventional algo-
rithms performed poorly for these real-world data sets, because they are imbalanced with respect to sensitivity
and specificity. A more balanced Hidden Markov Model-based algorithm surpassed the conventional algo-
rithms for both data sets. Using this algorithm leads to an improved accuracy of 4.1 percent points (pp) and
23.5 pp, respectively, compared to the conventional algorithms. The Youden-Index improved by 7.3 and 7.7,
respectively. Overall, for a real-world setting, the HMM-based algorithm achieved a performance similar to
conventional algorithms in a laboratory environment.
1 INTRODUCTION
People with dementia often suffer from a disturbed
circadian rhythm manifesting in sleep disorders (Mc-
Curry and Ancoli-Israel, 2003). These sleep disor-
ders are positively correlated with poor health, cogni-
tive impairment and mortality (Ancoli-Israel, 2009).
To apply treatments, it is necessary to know the day-
time sleep pattern of the patients. For example, for
patients having a delayed circadian rhythm, morning
bright light therapy can be beneficial (Mishima et al.,
1994).
However, the gold standard method for
sleep/wake scoring, polysomnography (PSG),
can only be performed in a sleep laboratory, requires
a number of electrodes to be attached to the patient’s
skin, and the data must be evaluated by a trained
expert based on standardized rules (Rechtschaffen
and Kales, 1968). Actigraphy, on the other hand, is a
noninvasive tool for sleep detection that can also be
applied in a non-clinical environment, for example in
the subjects’ homes or care facilities. Furthermore,
using actigraphy, it is possible to record sleep patterns
over longer periods of time.
A number of algorithms for actigraphic
sleep/wake detection have been proposed (Cole
et al., 1992; Sadeh et al., 1989; Kushida et al., 2001;
Paquet et al., 2007; Nakazaki et al., 2014). The
standard procedure for validation of this algorithms
is comparison with PSG. However, algorithms
validated this way may not be applicable for daytime
sleep detection in a real-world environment, because
subjects undergoing PSG suffer from the so-called
first night effect (the effect may actually last longer
than one night (Le Bon et al., 2001)). This means
that, because of the change in environment and the
knowledge of being under observation, subjects show
an aberrant sleep behaviour. Furthermore, Martin et
al. notes that the validity of daytime sleep estimation
of conventional algorithms is limited (Martin and
Hakim, 2011).
Therefore, we investigated the performance of
sleep detection algorithms in a non-laboratory en-
vironment. For this purpose, data of two differ-
ent subject groups has been recorded: (1) healthy
young adults, and (2) nursing home residents with
Alzheimer’s dementia. We proposed a set of new al-
gorithms based on different machine learning meth-
ods (Linear Discriminant Analysis (LDA), Logistic
Regression (LR), Support Vector Machine (SVM),
LÃijdtke S., Hein A., KrÃijger F., Bader S. and Kirste T.
Actigraphic Sleep Detection for Real-World Data of Healthy Young Adults and People with Alzheimerâ
˘
A
´
Zs Disease.
DOI: 10.5220/0006158801850192
In Proceedings of the 10th International Joint Conference on Biomedical Engineering Systems and Technologies (BIOSTEC 2017), pages 185-192
ISBN: 978-989-758-212-7
Copyright
c
2017 by SCITEPRESS – Science and Technology Publications, Lda. All rights reserved
185

Table 1: Performance of different algorithms for sleep/wake classification. Sens.: Sensitivity, Spec.: Specificity, Acc.: Accu-
racy, SD: Sleep disorders.
Author Sens. Spec. Acc. Subjects Algorithm
(Nakazaki et al., 2014) 90 65 85 34 healthy subjects Nakazaki’s
(Sadeh et al., 1989) 88 76 86 4 healthy subjects Sadeh’s
(Paquet et al., 2007) 95 54 91 100 healthy subjects Kushida’s
(Cole et al., 1992) 95 65 88 15 healthy, 26 subjects with SD Cole’s
(Hedner et al., 2004) 89 69 84 228 subjects with sleep apnea Hedner’s
(Kushida et al., 2001) 92 48 77 100 subjects with SD Kushida’s
(Paquet et al., 2007) 96 45 84 23 subjects with sleep deprivation Kushida’s
(Sadeh et al., 1989) 92 56 86 25 subjects with sleep apnea Sadeh’s
(Sadeh et al., 1989) 95 48 78 16 subjects with insomnia Sadeh’s
(Taibi et al., 2013) 96 36 76 16 subjects with insomnia Kushida’s
(Domingues et al., 2014) 76 82 78 29 healthy subjects Domingues’
(Orellana et al., 2014) 98 73 93 119 healthy adolescends Orellana’s
(Tilmanne et al., 2009) 92 58 82 354 infants Tilmanne’s
Hidden Markov Model (HMM)) and compared their
performance with the performance of two conven-
tional algorithms for sleep detection (Cole’s algo-
rithm and Sadeh’s algorithm).
2 RELATED WORK
In this section, algorithms for sleep/wake scoring are
presented, as well as studies investigating the per-
formance of these algorithms with different subject
groups.
Conventional sleep detection algorithms use Ac-
tivity Counts as input. Activity Counts are arbitrary
features of a raw acceleration signal, typically com-
puted for one-minute timeframes. They are generated
as follows: First, the acceleration signal (typically
sampled at 32 - 128 Hz (Van Someren et al., 1996))
is bandpass-filtered (e.g. using a 0.5 - 11 Hz band-
pass filter (Van Someren et al., 1996)). Afterwards,
Activity Counts are generated from the filtered sig-
nal by either counting the number of samples above
a threshold (time above threshold, TAT), counting the
number of zero crossings (ZC) or computing the sum
of the magnitude of all signal values (digital integra-
tion, DI) (Ancoli-Israel et al., 2003). These Activity
Counts are calculated on board the proprietary acti-
graphic devices, which makes replication of results
difficult when a different actigraphic device is used.
For example, de Souza et al. reimplemented two
conventional sleep detection algorithms (Cole et al.,
1992; Sadeh et al., 1989), and obtained significantly
different results (de Souza et al., 2003).
In the following, two conventional algorithms
(Cole’s algorithms and Sadeh’s algorithm) for sleep
detection are presented. These are also used in this
study as a reference value. They have been chosen
because of their wide distribution (Martin and Hakim,
2011) and reported performance.
Cole et al. (Cole et al., 1992) proposed an
algorithm that uses one-minute-timeframe Activity
Counts A
i
for classification. For the classification of
minute i, a linear combination of the four previous to
the two following Activity Counts is computed:
D
i
=0.00001(404A
i−4
+ 598A
i−3
+ 326A
i−2
+ 441A
i−1
+ 1408A
i
+ 508A
i+1
+ 350A
i+2
)
The coefficients have been identified by linear regres-
sion.
Sadeh et al. (Sadeh et al., 1989) also use one-
minute-timeframe Activity Counts for classification,
but compute higher-level features of these Activity
Counts before computing a linear model.
PS
i
= 4.532 −0.06828A
i
− 0.0385 sd(A
i−5
,...,A
i−1
)
− 0.038 sd(A
i−9
,...,A
i−1
) + 0.0298 min(A
i+1
,A
i+2
)
− 0.0299 sd(A
i−2
,A
i−1
)
The classification is obtained by applying a
threshold to D
i
or PS
i
, respectively. There are other
sleep detection algorithms that rely on the same basic
ideas. The algorithms presented in (Nakazaki et al.,
2014), (Kushida et al., 2001) and (Cook et al., 2004)
work similarly to Cole’s algorithm, but use differ-
ent coefficients for the linear model. Furthermore,
Cook’s algorithm allows to choose the classification
threshold to adapt the algorithm to different subject
groups. For example, a lower threshold leads to a
BIOSIGNALS 2017 - 10th International Conference on Bio-inspired Systems and Signal Processing
186

Figure 1: Sensor Bracelet.
higher specificity for subjects with insomnia (Lich-
stein et al., 2006).
The performance achievable with these algorithms
heavily depends on the subject group (Ancoli-Israel
et al., 2003). Table 1 lists performance results for the
algorithms. For healthy subjects, an accuracy of over
85 % can be achieved. Typically, the sensitivity (frac-
tion of data with class “sleep” correctly classified as
“sleep”) of the algorithms is significantly higher than
the specificity (fraction of data with class “awake”
correctly classified as “awake”), the algorithms tend
to overestimate the sleep state (Ancoli-Israel et al.,
2003).
For subjects with sleep disorders (e.g. sleep ap-
nea), and especially for subjects with insomnia, the
achievable specificity and therefore the accuracy is
significantly lower than for healthy subjects. The
low specificity occurs because these subjects spend
a greater portion of the night lying awake without
movement, which is difficult to classify correctly.
Recently, a number of new algorithms for sleep
detection have been proposed that do not rely on lin-
ear models, but on decision trees (Taibi et al., 2013),
Artificial Neural Networks (Orellana et al., 2014) or
Hidden Markov Models (Domingues et al., 2014).
Domingues et al. address the problem of low sensi-
tivity by not optimizing the accuracy, but the geomet-
ric mean of sensitivity and specificity. Orellana et al.
addresses this problem by repeating the less frequent
class in the training data until both classes have the
same frequency in the training data set.
3 METHODS
3.1 Data Acquisition
Actigraphic data has been recorded by a custom wrist-
worn device (Grey Innovation, Melbourne, Australia,
cf. Figure 1). This device contains a 3-axes ac-
celerometer (sampled at 100 Hz), a 3-axes gyroscope
(sampled at 100 Hz) as well as two thermometers for
reference and skin temperature (sampled at 0.1 Hz).
Four healthy, young adults, as well as nine older
subjects with Alzheimer’s dementia participated in
this study. The healthy subjects (age 23.5 ± 1.9 years,
1 Female, 3 Males) participated in the study for five
days each. The sensors were worn by the subjects on
either the wrist or ankle from the afternoon until the
next morning, therefore sleep and wake periods are
present in every recording. The different recording
positions have been chosen to compare the suitability
of these recording positions for sleep detection. The
sleep/wake annotation for this data has been acquired
by a sleep diary recorded by the subjects. The dura-
tion of recorded sensor data for every subject, as well
as the duration of annotated data, is listed in Table
2. In total, 194.4 h of sensor data of healthy subjects
have been recorded. The subjects have been sleeping
45.6 % of the recording time.
The subjects with Alzheimer’s dementia (age 78.4
± 2.9 years, 6 Females, 3 Males) participated in this
study for 24 days each. All of these subjects lived in
care facilities during the course of the study. The sen-
sors have been applied to the wrist and ankle of each
subject by caregivers in the morning. The battery of
the bracelet lasted for about 8 hours, so that valid sen-
sor data are available each day from about 08:00 to
16:00. Night-time data of subjects with dementia has
not been considered, because no annotations are avail-
able at night. The sleep/wake annotation for these
subjects has been acquired by Dementia Care Map-
ping (DCM) (Sloane et al., 2007). DCM has been car-
ried out only for a fraction of the total recording time.
715.9 h of sensor data of subjects with dementia have
been recorded. DCM annotation has been performed
for 169.9 h (or 23.7 % of the total recording time). 7.1
h of the data of the subjects with dementia have been
annotated with the class sleep (4.2 % of the annotated
samples).
3.2 Preprocessing and Feature
Extraction
Two preprocessing operations are performed on the
data: First, the magnitude of the accelerometer and
gyroscope signals are computed. Subsequently, the
Actigraphic Sleep Detection for Real-World Data of Healthy Young Adults and People with Alzheimerâ
˘
A
´
Zs Disease
187
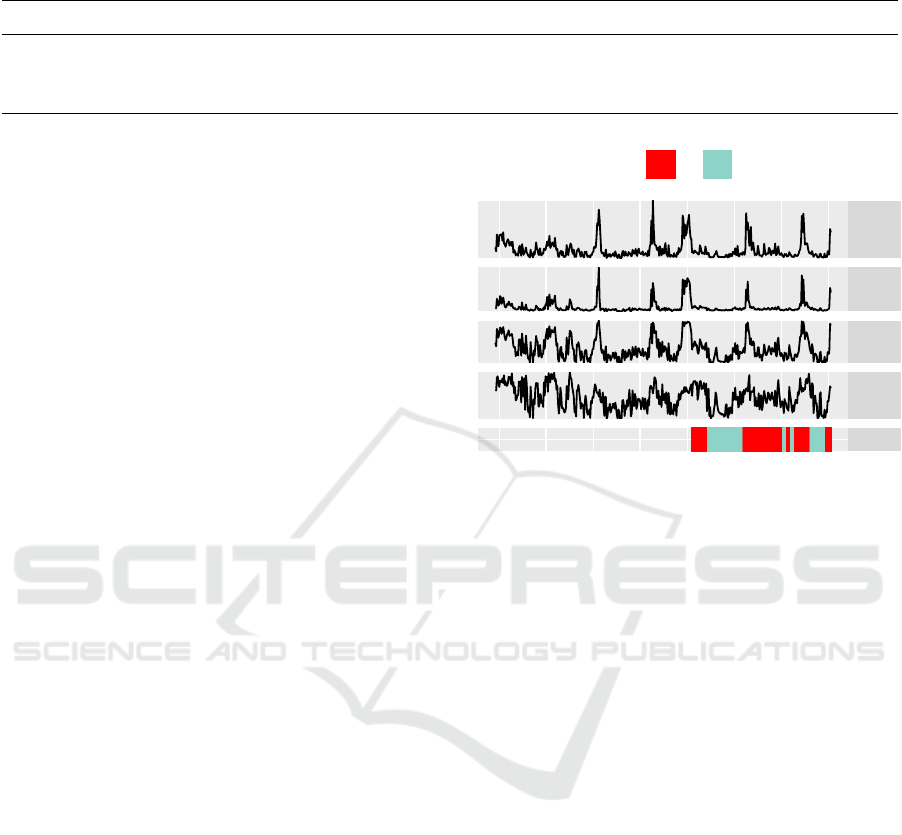
Table 2: Minutes of sensor data, annotated data and minutes annotated with sleep, for each healthy subject (H) and subject
with dementia (D).
Subject H1 H2 H3 H4 D1 D2 D3 D4 D5 D6 D7 D8 D9
Sensor 4955 4261 4202 4849 8762 8429 9103 9310 6211 9108 8280 6302 9880
Annotation 4955 4261 4202 4848 1174 1352 859 532 900 882 1157 1912 1424
Sleep 2279 2314 2379 1785 0 195 20 30 112 30 5 0 35
resulting signals are filtered with a 0.5 - 11 Hz Butter-
worth bandpass filter. The filter bandwidth has been
chosen according to (Van Someren et al., 1996). On
this preprocessed data, the following 37 features are
calculated for one-minute timeframes (an example of
different features for one recording is depicted in Fig-
ure 2):
• Statistical Features: Mean, variance, skewness,
kurtosis, median, 10-, 25-, 75-, and 90-percentile,
Shannon Entropy and energy of the preprocessed
sensor data.
• Features based on Activity Counts conventionally
used with sleep detection algorithms (Cole et al.,
1992; Sadeh et al., 1989): Threshold crossing rate
(thresholds 0.1 g and 1.8
◦
/s, respectively), rela-
tive frequency of samples above threshold.
• Lowpass-filtered versions of mean and Activ-
ity Count-based features with the filter kernel
(1,2,4,8, 16,8, 4,2, 1)/46. This way, the smooth-
ing step that is done by the conventional algo-
rithms by including feature values of adjacent
time frames into the linear model, is performed
directly on the data.
• The angle between the acceleration vector in the
beginning and at the end of a time frame (Bieber
et al., 2014).
3.3 Classification Algorithms
In this section, we describe the necessary adaptions to
Cole’s algorithm and Sadeh’s algorithm to apply them
to our data, as well as the proposed algorithms based
on machine-learning algorithms. The conventional
algorithms are based on the processing of Activity
Counts. However, the Activity Counts described in
the literature cannot be reproduced directly, because
of the different sensor modalities. Instead, all of the
features described above have been tested as input of
the algorithms. Furthermore, because we did not use
the original Activity Counts, the original coefficients
of the linear model cannot be used. Therefore, the
coefficients of the algorithms have been recalculated
using linear regression.
As described above, the class-distribution in our
data is imbalanced: For the subjects with dementia,
Mean
10P
TAT
TCR
Sleep
12 14 16 18
Time
Sleeping
No Yes
Figure 2: Example of some of the features for one record-
ing. The different quality of the features for classifica-
tion can be seen (note the differences in the features for
sleep and awake periods. TAT: Time above threshold, TCR:
Threshold crossing rate. 10P: 10-Percentile. Sleep: Sleep
annotation.
the class awake occurs 95 % of the time. Algorithms
trained with these data can easily achieve a high ac-
curacy by always choosing the class awake. Prelim-
inary tests showed that the conventional algorithms,
trained with the data of the subjects with dementia,
indeed classify all samples as awake. However, this
behaviour is not desired for algorithms that should
be able to detect daytime sleep. Therefore, we use
stratified oversampling (Chawla, 2005) of the train-
ing data, similar to (Orellana et al., 2014). This means
that samples from the less frequent class are repeated,
until both classes have the same prior probability. For
the conventional algorithms, this resampling step has
to keep the sequential order of Activity Counts. This
is done by first generating the set of activity counts
for each time frame and then resampling on these
sets. The LDA, LR and SVM are also trained using
the resampled training data. These algorithms do not
use adjacent features values as input (like the conven-
tional algorithms), but only the current feature value.
The HMM consists of two states, awake and
sleeping. The transition matrix is computed by count-
ing the relative frequency of state transitions in the
training data. For the observation model, a multivari-
BIOSIGNALS 2017 - 10th International Conference on Bio-inspired Systems and Signal Processing
188
0
10
20
30
40
50
−6 −4 −2
log(a)
frequency
0
20
40
−8 −7 −6 −5 −4 −3
log(a)
frequency
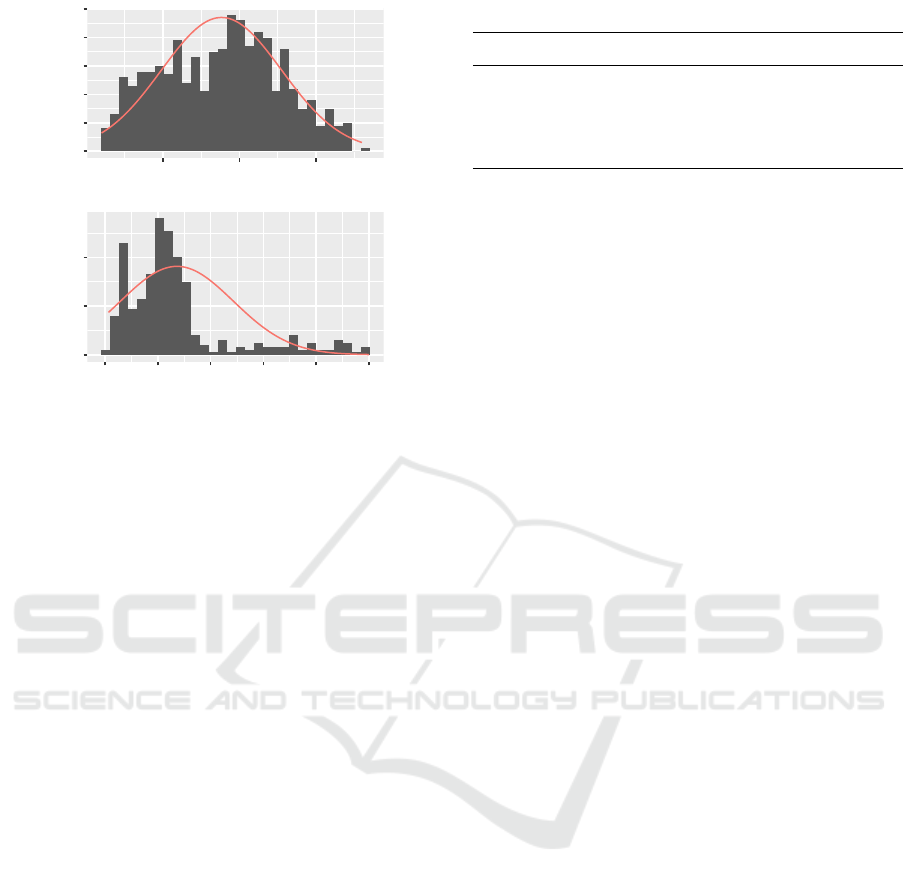
Figure 3: Histogram of sensor data, one recording, class
awake (top) and class sleeping (bottom), logarithmic scale.
Red line: Empirical log-normal distribution.
ate logarithmic normal distribution has been chosen.
This choice is based on the observation that many
processes associated with human movement are log-
normal distributed (Zhang and Popp, 1994). Further-
more, the log-normal distribution is a good represen-
tation of the real distribution of the sensor data (cf.
Figure 3). The parameters of the observation distribu-
tion have been estimated from the training data using
maximum-likelihood estimators. The prior probabil-
ities of the classes are estimated as the relative fre-
quency of the classes in the training data. The classi-
fication is acquired by computing the most probable
state sequence using the Viterbi Algorithm (Viterbi,
1967). We used an HMM because of its ability to
model temporal relations. We suspect that sensor data
of the current time frame may not be sufficient for
sleep/wake discrimination, because short periods of
inactivity may not automatically mean that the sub-
ject was sleeping.
3.4 Performance Evaluation and
Experimental Design
In the case of imbalanced class distribution (as in
our data of the subjects with dementia), accuracy
as performance measure is not sufficient (Chawla,
2005). A classifier that overestimates the more fre-
quent class can achieve a high accuracy while having
a poor ability to detect the less frequent class (sleep,
in our case). Therefore, the performance measures
sensitivity (fraction of data with class sleep correctly
classified as sleep) and specificity (fraction of data
Table 3: Factors and levels of experimental design.
Factor Levels
Subjects H (Healthy) D (Subj. with Dementia)
Position W (Wrist), A (Ankle)
Algorithm Cole, Sadeh, LDA, LR, SVM, HMM
Features Single, PCA, 5 best
with class awake correctly classified as awake) are of
greater interest. A combination of these two measures
is the Youden-Index J = sensitivity + speci f icity − 1
(Youden, 1950). Because the Youden-Index gives a
balanced impression of both the sleep and wakeful-
ness detection ability of the algorithm, it is used as
the primary performance measure in this study.
We used a factorial design for this study. The
factors and levels are depicted in Table 3. The fac-
tors Subjects and Position represent the used data set
(healthy subjects or subjects with dementia, and the
respective recording position). The factor Algorithm
represents the classification algorithm (either Cole’s
algorithm, Sadeh’s algorithm or one of the algorithms
based on LDA, LR, SVM or HMM). The factor Fea-
tures represents the used set of features. Every feature
was tested as univariate input of the algorithms. Fur-
thermore, we computed principal components of the
features and used the first k = 1, ...,37 components.
Moreover, we used the feature combination of the 5
features that achieved the highest Youden-Index when
used univariately with the respective algorithm.
This experimental design results in 2∗2 ∗6∗(37 +
37 + 1) = 1800 configurations. The performance of
every configuration was assessed using leave-one-
subject-out cross validation.
4 RESULTS
In this section, the results of the experiments outlined
in section 3.4 are presented. Examples for the classifi-
cation of a recording of a healthy subject and a subject
with dementia are depicted in Figures 4 and 5. The re-
sults obtained by leave-one-subject-out cross valida-
tion are summarized in Table 4. In this table, the best
results for every data set and algorithm is reported,
i.e. the result of the feature combination achieving
the highest Youden-Index. For the healthy subjects
as well as for the subjects with dementia, the maxi-
mum performance of each algorithm was higher when
recording sensor data on the wrist instead of the ankle.
The reason for this is that people tend to move their
hands more than their feet in phases of rest (e.g. sit-
ting), this result is consistent with (Middelkoop et al.,
Actigraphic Sleep Detection for Real-World Data of Healthy Young Adults and People with Alzheimerâ
˘
A
´
Zs Disease
189
Data
Sleep
HMM
Cole
Sadeh
0 5 10 15 20
Time
Sleeping
No Yes
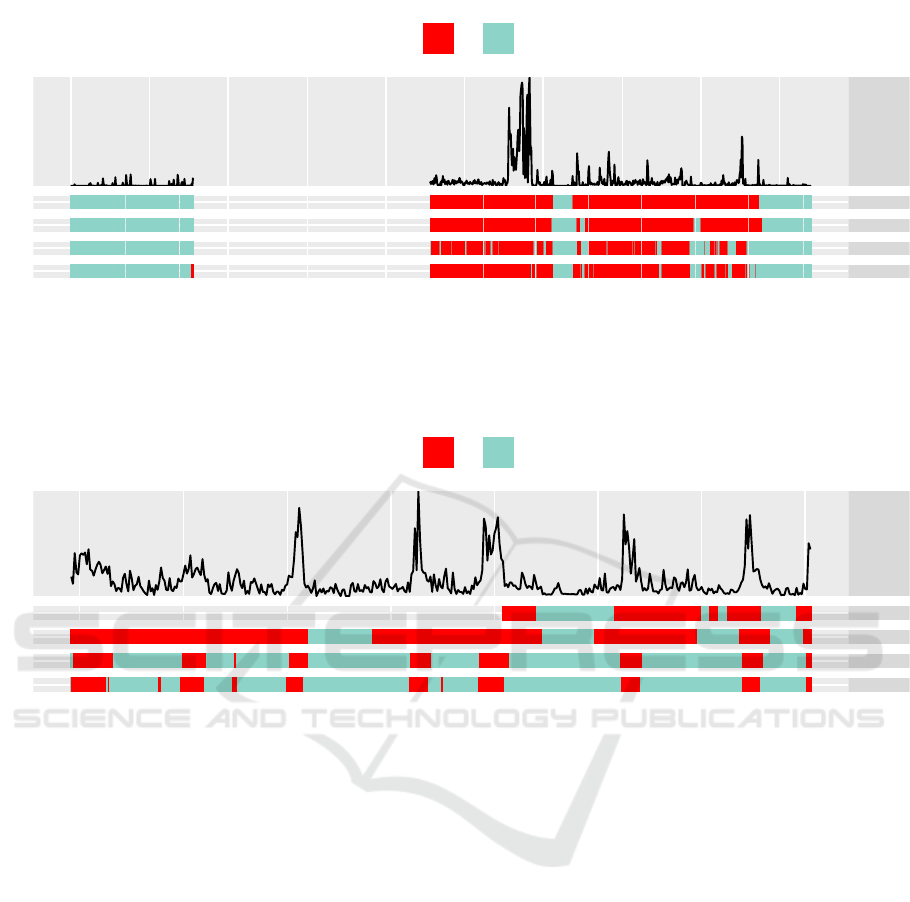
Figure 4: Example classification of one recording period for healthy subjects. Data: Raw acceleration values (lowpass-
filtered for depiction). Sleep: Sleep annotations. HMM, Cole, Sadeh: Classification obtained by respective algorithms. In
this example, the HMM shows a good classification, while Cole’ and Sadeh’s algorithm overestimate the state sleeping and
the number of state transitions.
Data
Sleep
HMM
Cole
Sadeh
12 14 16 18
Time
Sleeping
No Yes
Figure 5: Example classification of one recording period of subjects with dementia. Data: Raw acceleration values (lowpass-
filtered for depiction). Sleep: Sleep annotations. HMM, Cole, Sadeh: Classification obtained by respective algorithms. In
this example, the HMM shows a balanced sleep/wake classification, while Cole and Sadeh overestimate the state sleeping.
1997). Therefore, in the following, only the wrist data
sets are considered, and for the ankle data, only the
best result on each data set is reported in Table 4.
When comparing the different feature sets that
lead to the highest Youden-Indices, two classes of fea-
tures lead to particularly high performances: Features
based on Activity Counts, as well as lowpass-filtered
features (lowpass-filtered statistical features, and
lowpass-filtered features based on Activity Counts).
Using more than one feature (i.e. a multivariate fea-
ture set) has not led to an increase in performance for
the conventional algorithms and the HMM-based al-
gorithm. However, for the other machine learning-
based algorithms, the highest performances could be
achieved using multivariate features. This can be ex-
plained by differences of the algorithms in dealing
with correlated features.
On both data sets, the HMM-based algorithm
achieved the highest accuracy and the highest
Youden-Index. For the healthy subjects, the conven-
tional algorithms achieved a very high sensitivity (>
98 %), and a specificity of 77.5 % or 86.3 %. The sen-
sitivity and specificity of the HMM-based algorithm
is more balanced, therefore, by using the HMM-based
algorithm, the Youden-Index improved by 7.3 and the
accuracy improved by 4.1 percent points (pp), com-
pared to the conventional algorithms.
For the subjects with dementia, the performance
of all algorithms is significantly lower. The conven-
tional algorithms could achieve a sensitivity of over
90 %, but a specificity of only ≈ 45 %. The low speci-
ficity is typical for the conventional algorithms and
caused by the inability of the algorithms to distin-
guish short periods of rest from sleep. In contrast
to other studies, the subjects in this study have been
awake for most of the recording time. Therefore,
the low specificity has a great impact on the accu-
racy: The conventional algorithms could only achieve
BIOSIGNALS 2017 - 10th International Conference on Bio-inspired Systems and Signal Processing
190

Table 4: Performance of tested sleep/wake detection al-
gorithms. For every instance, the results of the feature-
combination achieving the highest Youden-index is re-
ported. HW: Healthy subjects, wirst position. HA: Healthy
subjects, ankle position. DW: Subjects with dementia, wrist
position. DA: Subjects with dementia, ankle position.
Data Method Sens. Spec. Acc. Youden
HW Cole 99.6 77.5 87.8 77.1
HW Sadeh 98.1 86.3 91.9 84.4
HW LDA 97.3 84.5 90.1 81.9
HW LR 91.2 94.5 92.0 85.6
HW SVM 98.0 89.6 93.6 87.6
HW HMM 96.5 95.2 96.2 91.7
DW Cole 94.7 45.8 48.6 40.5
DW Sadeh 93.3 45.7 48.4 39.1
DW LDA 74.6 63.5 64.7 38.1
DW LR 71.8 65.4 66.3 37.1
DW SVM 78.6 56.7 58.5 35.2
DW HMM 77.0 71.2 72.1 48.2
HA HMM 91.5 87.9 90.1 79.5
DA HMM 82.4 58.0 59.0 40.4
an accuracy of ≈ 48 %. The HMM-based algorithm
could again achieve a more balanced result (sensitiv-
ity 77.0 %, specificity 71.2 %), which improved the
Youden-Index by 7.7 and the accuracy by 23.5 pp.
Therefore, the HMM-based algorithm is superior to
the conventional algorithms in all cases, considering
Youden-Index and accuracy.
5 CONCLUSION
This study investigates sleep detection in a real-world
setting, instead of the laboratory environment used
in previous studies. To compare conventional sleep
detection algorithms and proposed machine learning-
based methods, we performed two studies: One with
healthy young adults and one with nursing home res-
idents with Alzheimer’s disease. In contrast to pre-
vious studies, the data has not been annotated us-
ing PSG, but using subjective information (sleep di-
ary or DCM). This annotation may not be as accurate
as PSG, but allows new insights into how sleep algo-
rithms perform when applied in a real-world situation.
For the healthy subjects, the conventional algo-
rithms achieved a higher performance than in previ-
ous studies with healthy subjects, e.g. (Sadeh et al.,
1989), particularly a higher specificity (about 10 per-
cent points more for each algorithm). One explana-
tion is the different data set, i.e. the different record-
ing time frame (day- and nighttime) and the differ-
ent annotation procedure: The subjects themselves
noted their sleep/wake periods, which will not be
completely accurate, especially during the night. This
could lead to an increased reported performance, be-
cause “difficult to detect” wake periods during the
night have been omitted. On the other hand, we
trained the algorithms using features different from
the original Activity Counts, which could also lead
to an increased performance, if the features we used
were more informative for sleep/wake discrimination.
For the subjects with dementia, the sensitivity and
specificity of the conventional algorithms is compara-
ble to studies with subjects with insomnia, e.g. (Taibi
et al., 2013). This is reasonable, because people
with dementia often suffer from severe sleep disor-
ders (McCurry and Ancoli-Israel, 2003). However,
because of the low specificity, and because the sub-
jects have been awake for most of the recording time,
the accuracy of the conventional algorithms is very
low for this data set.
The HMM-based algorithm achieves a higher per-
formance (accuracy and Youden-Index) than the con-
ventional algorithms for both data sets. The reason for
this is that this algorithm is more balanced in terms
of sensitivity and specificity, which means that for a
loss in sensitivity, a higher specificity can be obtained.
Particularly, for daytime sleep detection, a high sen-
sitivity is important, because of the strong impact on
accuracy. With this algorithm, on the data of the sub-
jects with dementia, an accuracy that is similar to pre-
vious studies on subjects with insomnia can be ob-
tained (with a lower sensitivity, but a higher speci-
ficity than in previous studies).
Future work might include using other sensor data
than movement for sleep classification, for example
the time of the day or the heart rate, which can be
obtained unobtrusively by a pulse oximeter.
ACKNOWLEDGEMENTS
This project was supported by the German Federal
Ministry of Education and Research (BMBF, Funding
number: 16SV7349).
REFERENCES
Ancoli-Israel, S. (2009). Sleep and its disorders in aging
populations. Sleep medicine, 10:S7–S11.
Ancoli-Israel, S., Cole, R., Alessi, C., Chambers, M., Moor-
croft, W., and Pollak, C. (2003). The role of actigra-
phy in the study of sleep and circadian rhythms. amer-
ican academy of sleep medicine review paper. Sleep,
26(3):342–392.
Actigraphic Sleep Detection for Real-World Data of Healthy Young Adults and People with Alzheimerâ
˘
A
´
Zs Disease
191

Bieber, G., Kirste, T., and Gaede, M. (2014). Low sampling
rate for physical activity recognition. In Proceed-
ings of the 7th International Conference on Perva-
sive Technologies Related to Assistive Environments,
pages 15:1–15:8. ACM.
Chawla, N. V. (2005). Data mining for imbalanced datasets:
An overview. In Data mining and knowledge discov-
ery handbook, pages 853–867. Springer.
Cole, R., Kripke, D., Gruen, W., Mullaney, D. J., and
Gillin, J. C. (1992). Automatic sleep/wake identifi-
cation from wrist activity. Sleep, 15(3):461–469.
Cook, K., Lichstein, K., Donaldson, J., Nau, S., Lester, K.,
and Aguillard, R. (2004). An exploratory validation of
actigraphic measures of insomnia. Sleep, 27:270–270.
de Souza, L., Benedito-Silva, A. A., Pires, M. N., Poyares,
D., Tufik, S., and Calil, H. M. (2003). Further valida-
tion of actigraphy for sleep studies. Sleep, 26(1):81–
85.
Domingues, A., Paiva, T., and Sanches, J. M. (2014). Sleep
and wakefulness state detection in nocturnal actigra-
phy based on movement information. IEEE Transac-
tions on Biomedical Engineering, 61(2):426–434.
Hedner, J., Pillar, G., Pittman, S. D., Zou, D., Grote, L., and
White, D. P. (2004). A novel adaptive wrist actigraphy
algorithm for sleep-wake assessment in sleep apnea
patients. Sleep, 27(8):1560–1566.
Kushida, C. A., Chang, A., Gadkary, C., Guilleminault, C.,
Carrillo, O., and Dement, W. C. (2001). Comparison
of actigraphic, polysomnographic, and subjective as-
sessment of sleep parameters in sleep-disordered pa-
tients. Sleep medicine, 2(5):389–396.
Le Bon, O., Staner, L., Hoffmann, G., Dramaix, M., San Se-
bastian, I., Murphy, J. R., Kentos, M., Pelc, I., and
Linkowski, P. (2001). The first-night effect may last
more than one night. Journal of psychiatric research,
35(3):165–172.
Lichstein, K. L., Stone, K. C., Donaldson, J., Nau, S. D.,
Soeffing, J. P., Murray, D., Lester, K. W., and Aguil-
lard, R. N. (2006). Actigraphy validation with insom-
nia. Sleep, 29(2):232.
Martin, J. L. and Hakim, A. D. (2011). Wrist actigraphy.
Chest Journal, 139(6):1514–1527.
McCurry, S. M. and Ancoli-Israel, S. (2003). Sleep dys-
function in alzheimers disease and other dementias.
Current Treatment Options in Neurology, 5(3):261–
272.
Middelkoop, H. A., Dam, E. M., Smilde-Van den Doel,
D. A., and Dijk, G. (1997). 45-hour continuous
quintuple-site actimetry: Relations between trunk and
limb movements and effects of circadian sleep-wake
rhythmicity. Psychophysiology, 34(2):199–203.
Mishima, K., Okawa, M., Hishikawa, Y., Hozumi, S., Hori,
H., and Takahashi, K. (1994). Morning bright light
therapy for sleep and behavior disorders in elderly pa-
tients with dementia. Acta Psychiatrica Scandinavica,
89(1):1–7.
Nakazaki, K., Kitamura, S., Motomura, Y., Hida, A.,
Kamei, Y., Miura, N., and Mishima, K. (2014). Valid-
ity of an algorithm for determining sleep/wake states
using a new actigraph. Journal of physiological an-
thropology, 33(1):1.
Orellana, G., Held, C., Estevez, P., Perez, C., Reyes, S.,
Algarin, C., and Peirano, P. (2014). A balanced
sleep/wakefulness classification method based on acti-
graphic data in adolescents. In 2014 36th Annual
International Conference of the IEEE Engineering
in Medicine and Biology Society, pages 4188–4191.
IEEE.
Paquet, J., Kawinska, A., and Carrier, J. (2007). Wake
detection capacity of actigraphy during sleep. Sleep,
30(10):1362.
Rechtschaffen, A. and Kales, A. (1968). A manual of stan-
dardized terminology, techniques and scoring system
for sleep stages of human subjects.
Sadeh, A., Alster, J., Urbach, D., and Lavie, P. (1989). Acti-
graphically based automatic bedtime sleep-wake scor-
ing: validity and clinical applications. Journal of Am-
bulatory Monitoring, 2(3):209–216.
Sloane, P. D., Brooker, D., Cohen, L., Douglass, C., Edel-
man, P., Fulton, B. R., Jarrott, S., Kasayka, R., Kuhn,
D., Preisser, J. S., et al. (2007). Dementia care map-
ping as a research tool. International journal of geri-
atric psychiatry, 22(6):580–589.
Taibi, D. M., Landis, C. A., and Vitiello, M. V. (2013). Con-
cordance of polysomnographic and actigraphic mea-
surement of sleep and wake in older women with in-
somnia. J Clin Sleep Med, 9(3):217–225.
Tilmanne, J., Urbain, J., Kothare, M. V., Wouwer, A. V.,
and Kothare, S. V. (2009). Algorithms for sleep–wake
identification using actigraphy: a comparative study
and new results. Journal of sleep research, 18(1):85–
98.
Van Someren, E. J., Lazeron, R. H., Vonk, B. F., Mirmiran,
M., and Swaab, D. F. (1996). Gravitational artefact in
frequency spectra of movement acceleration: impli-
cations for actigraphy in young and elderly subjects.
Journal of neuroscience methods, 65(1):55–62.
Viterbi, A. (1967). Error bounds for convolutional codes
and an asymptotically optimum decoding algorithm.
IEEE transactions on Information Theory, 13(2):260–
269.
Youden, W. J. (1950). Index for rating diagnostic tests. Can-
cer, 3(1):32–35.
Zhang, C.-L. and Popp, F.-A. (1994). Log-normal distri-
bution of physiological parameters and the coherence
of biological systems. Medical Hypotheses, 43(1):11–
16.
BIOSIGNALS 2017 - 10th International Conference on Bio-inspired Systems and Signal Processing
192
