
Adapting Heuristic Evaluation to Information Visualization
A Method for Defining a Heuristic Set by Heuristic Grouping
Maurício Rossi de Oliveira and Celmar Guimarães da Silva
School of Technology, University of Campinas, Limeira, Brazil
Keywords: Information Visualization, Human-Computer Interaction, Heuristic Evaluation, Usability.
Abstract: Heuristic evaluation technique is a classical evaluation method in Human-Computer Interaction area.
Researchers and software developers broadly use it, given that it is fast, cheap and easy to use. Using it in
other areas demands creating a new heuristic set able to identify common problems of these areas. Information
Visualization (InfoVis) researchers commonly use this technique with the original usability heuristic set
proposed by Nielsen, which does not cover many relevant aspects of InfoVis. InfoVis literature presents sets
of guidelines that cover InfoVis concepts, but it does not present most of them as heuristics, or they cover
much specific concepts. This work presents a method for defining a set of InfoVis heuristics for use in
heuristic evaluation. The method clusters heuristics and guidelines found in a literature review, and creates a
new heuristic set based on each group. As a result, we created a new set of 15 generic heuristics, from a set
of 62 ones, which we hypothesize that will help evaluators to take into account a broad set of visualization
aspects during evaluation with possibly less cognitive effort.
1 INTRODUCTION
Information Visualization (InfoVis) has many
intersections with Human-Computer Interaction
(HCI). Both areas study interaction between user and
system. IHC focuses on improving system interface
usability, whereas InfoVis also focuses on an
appropriate definition of visual structures and views.
Besides, both areas have evaluation procedures. HCI
presents usability tests, heuristic evaluation,
cognitive walkthrough (Nielsen and Mack, 1994) and
semiotic inspection (de Souza et al., 2006). All these
methods aim to assess user interface usability, i.e.,
characteristics such as learnability, efficiency, and
user satisfaction. InfoVis also needs to evaluate if a
visualization is useful and improves users’ cognition,
enabling them to obtain more information about data
than if one represents the same data in a raw format
(such as a table).
There are two categories of InfoVis evaluation
techniques: empirical and analytic (Mazza, 2009).
This work focuses on an analytic technique called
heuristic evaluation (Nielsen and Mack, 1994). It uses
3 to 5 evaluators that search for usability problems
related to a set of heuristics. The original heuristic set
proposed by Nielsen and Mack embraces usability
aspects of a user interface. This set has the following
heuristics: visibility of system status; match between
system and the real world; user control and freedom;
consistency and standards; error prevention;
recognition rather than recall; flexibility and
efficiency of use; aesthetic and minimalist design;
help users recognize, diagnose, and recover from
errors; and help and documentation. This technique is
fast, cheap and easy to apply, therefore other areas
consider it as interesting to use. Indeed, it is
commonly adapted for other areas, which make
changes in the heuristic set due to their specificities.
Mazza (2009) points out that the difficulty of
creating a heuristic set for visualizations reduces the
use of this technique for evaluating InfoVis systems.
Nielsen’s heuristics are still relevant for InfoVis
applications, but they are not enough for dealing with
some aspects, such as evaluating visual mapping and
data manipulation.
Despite of this difficulty, there are efforts to adapt
heuristic evaluation to InfoVis. We found heuristic
sets that are specific for InfoVis, but we observed
some problems with them. First of all, only some
works use the term “heuristic”. They present
guidelines, sometimes without an imperative
sentence (not even in their description), which we
believe that is necessary to ease the use of heuristics
during the evaluation procedure.
Rossi de Oliveira M. and GuimarÃ
ˇ
ces da Silva C.
Adapting Heuristic Evaluation to Information Visualization - A Method for Defining a Heuristic Set by Heuristic Grouping.
DOI: 10.5220/0006133202250232
In Proceedings of the 12th International Joint Conference on Computer Vision, Imaging and Computer Graphics Theory and Applications (VISIGRAPP 2017), pages 225-232
ISBN: 978-989-758-228-8
Copyright
c
2017 by SCITEPRESS – Science and Technology Publications, Lda. All rights reserved
225

Besides, some sets focus only on specific
characteristics, such as usability or statistical
methods. Therefore, they do not cover a broad set of
InfoVis problems. Finally yet importantly, as far as
we know, most of these heuristic sets is not frequently
used (except Nielsen’s one).
Therefore, this work presents a method for
defining a set of InfoVis heuristics for use in heuristic
evaluation. The results of applying this method were
15 heuristics that group a set of 62 heuristics available
in the literature, which covers many aspects of
InfoVis. Our hypothesis is that grouping those
heuristics under a set of generic heuristics will help
evaluators to take into account a broad set of
visualization aspects during evaluation with possibly
less cognitive effort.
This paper is organized as follows: Section 2
presents works found in literature which have sets for
InfoVis (and further used to creating the heuristic set),
and also a review of works focused on creating
heuristic sets for some areas; Section 3 describes our
method for creating heuristics; Section 4 presents the
proposed set; Section 5 concludes this paper and
presents future works.
2 RELATED WORKS
There are several works in literature about heuristics
sets, for different areas, and about evaluation in
InfoVis. In this section, we focus on works relative to
InfoVis heuristics, in which we based the
construction of our heuristic set. We also present
some works about creating heuristic sets for many
different areas.
2.1 InfoVis Sets
We found in our literature review that, in five years,
only Forsell and Johansson (2010) present explicitly
an InfoVis heuristic set. Therefore, we expanded our
research to include older works that they cite. In these
works, we found guidelines, guidance, criteria, tasks,
and some important aspects about the area.
Shneiderman (1996) proposes guidelines in a
mantra format, i.e., some aspects that visualization
design and evaluation must consider; e.g. filters,
zoom, and details-on-demand.
Amar and Stasko (2004) present a framework for
design and evaluation in InfoVis, focused only in
statistical concepts, like correlations and causation
data. Their proposed guidance includes: expose
uncertainty, formulate cause and effect, and confirm
hypotheses.
Freitas et al. (2002) show criteria to evaluate
visualization techniques. Among these criteria, some
are more related to usability (e.g. state transition;
orientation and help; information coding), while
others are related to visualization concepts (e.g. data
set reduction; navigation and querying; spatial
organization). Criteria definition also appears in the
work of Scapin and Bastien (1997). Again, two
groups of criteria can be noted, one related to
usability (e.g. immediate feedback, user control,
user’s experience, consistency), and other to
visualization concepts (e.g. information density, and
grouping and distinguishing items by location and
format).
Finally, two works define heuristic sets. Zuk and
Carpendale (2006) call their guidelines as heuristics.
Most of the proposed heuristics are directly related to
visual concepts, like preattentive properties and
Gestalt principles. Some heuristics presented in the
set are: do not expect a reading order from color;
quantitative assessment requires position or size
variation; color perception varies with size of colored
item; provide multiple levels of detail.
The work of Forsell and Johansson (2010) follows
a different way to present a heuristic set. They create
a new set based on the five previously commented
works, plus the Nielsen’s heuristics. The process
occurs in some steps: first, all the chosen heuristics
are used to evaluate a set of problems (defined by
authors), where each heuristic is related to some
problem. They use a rating scale to classify how well
a heuristic explain a problem. At the end of this step,
the heuristics that better explain the most problems
are selected to integrate the proposed heuristic set.
This process obeys some conditions; e.g., each
heuristic must explain problems yet not related to the
previous chosen heuristics. The result is a set of 10
heuristics that explain 86.7% of the problems set up
by authors.
2.2 Other Sets
The characteristics of Heuristic Evaluation (being
cheap and fast) draws attention for use in other areas.
In some cases, the evaluation remains in its original
form, without changes. However, as discussed
previously, in other cases the usability heuristics
proposed by Nielsen are not enough to identify all the
problems of the area, demanding the use of specific
heuristics. In literature, there are several heuristic sets
for specific purposes, such as human-robot
interaction (Clarkson and Arkin, 2007; Weiss et al.,
2010), software for children (MacFarlane and Pasiali,
2005), smartphones (Inostroza et al., 2016), mobiles
IVAPP 2017 - International Conference on Information Visualization Theory and Applications
226

(Inostroza et al., 2012; Machado Neto and Pimentel,
2013), games (Desurvire, Caplan and Toth, 2004;
Korhonen and Koivisto, 2006; Pinelle et al., 2009;
Soomro, Ahmad and Sulaiman, 2012), augmented
reality (Franklin, Breyer and Kelner, 2014), among
others.
During the creation of a set, most works do not
follow a standard method. Authors apply and
combine several techniques for creating heuristics,
according to their need or interest.
We did a literature review to identify techniques
for creating heuristic sets. Our scope was only the
works that proposed a new set, and we grouped them
according to their techniques.
We identified three common steps for a method
whose goal is to create these sets. First, the method
adopts one or more techniques to create the set of
specific heuristics. The second step is to use this set
in a heuristic evaluation, aiming to assess if the set is
good for finding problems. After a result analysis, if
the result is not satisfactory, the method repeats the
process, in order to refine the set. These steps are not
standardized; one can perform them in different ways,
but always focused on presenting a final set. Some
works have more intermediate steps that aid set
creation or evaluation.
The main difference between the works happens
in the first step, which defines the heuristic set. In this
step, we identified two groups of techniques for
heuristic creation: using human resources, and
extracting information from literature and other
documents. It is important to note that one may apply
both techniques simultaneously.
Techniques based on human resources employ
people in order to establish the heuristic set. These
people can be experts of the area or users of a related
system. Experts have knowledge (personal or
professional) about the area, and/or usability, and/or
system interfaces. They can aid the task of choose
heuristics in several ways, e.g. participating on
brainstorming reunions (Machado Neto and Pimentel,
2013), answering questionnaire (Mohamed Omar,
Yusof and Sabri, 2010; Inostroza et al., 2013), and
rating heuristics (Kientz et al., 2010). Other human
resources that can be used are users of a system
related to the area, and information to create the
heuristics can be obtained, e.g., by user observation
(Geerts and De Grooff, 2009).
In the other hand, techniques based on literature
review embraces analysis of information found in
literature and specific documents of the area. One
may use this information to transform guidelines in
heuristics (Jaferian et al., 2011) or to create heuristics
using a set of problems (Papaloukas, Patriarcheas and
Xenos, 2009; Pinelle et al., 2009; Park, Goh and So,
2014). Other way is to use a specific methodology
based on literature exploration (Rusu et al., 2011;
Muñoz and Chalegre, 2012; Quinones, Rusu and
Roncagliolo, 2014; Inostroza et al., 2016).
3 METHOD
The proposed method for this work aims to create a
small set of heuristics for InfoVis, which cover the
other sets found in literature. We considered several
methods for heuristic creation, and we picked one
according to the available resources.
Our research team have few experts in InfoVis
and HCI, and we opted by not contacting other
experts in this phase of our research. Therefore, we
discarded techniques based on human resources to
create heuristics. On the other hand, there are several
ways to use information found in literature (including
the use of preexisting sets), and this was the approach
we chose.
For the meaning of the method, we called
“heuristics” all the guidelines, guidance and criteria
used. Therefore, we define the proposed method as
follows:
1. Select a group of works (preferably for the
target area), which have relevant heuristics;
2. List the heuristics found into these works;
3. Group these heuristics according to their
pairwise similarity;
4. Name and describe each group, in order that
this name be used as a broad heuristic (relative
to the group);
5. Put the heuristics of the previous step together,
forming a set.
We hypothesize that the amount of heuristics
should be small; otherwise, it would demand
cognitive effort of the evaluator when applying
heuristic evaluation. Indeed, our literature review
(Section 2.1) found sets whose size is between six and
eighteen heuristics. Besides, equal heuristics or
heuristics based on a same concept may happen in this
method. Both situations demand a way to reduce this
amount, and justify the need of Step 3. We defined
the following way to perform this step:
1. Compare all pairs of heuristics;
2. Set a similarity grade for each pair of
heuristics, based on how the research team
understands the heuristics;
3. Create a similarity matrix with these grades;
4. Reorder this similarity matrix for grouping
similar heuristics.
Adapting Heuristic Evaluation to Information Visualization - A Method for Defining a Heuristic Set by Heuristic Grouping
227
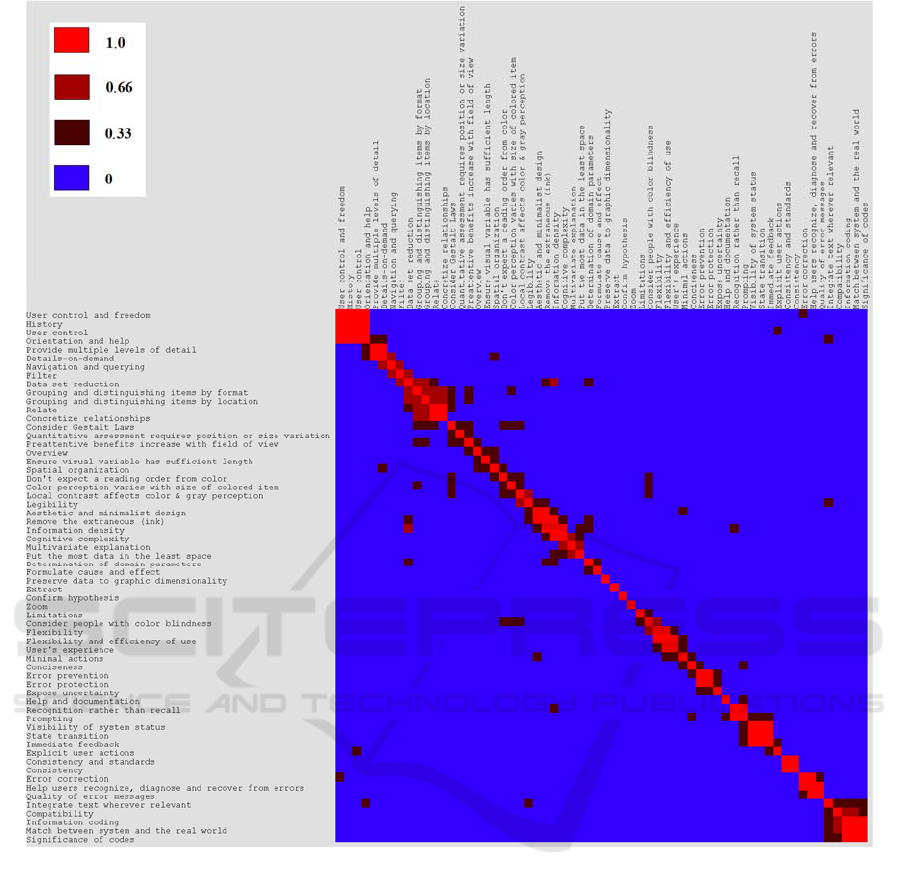
Figure 1: Heatmap of heuristic similarities, ordered by TSP.
We defined the similarity grade as one of these four
possible values: 0 = not similar; 0.33 = somewhat
similar; 0.66 = resembling, but not equal; 1 = equal.
4 RESULTS
We followed the method presented at previous
section. In the first two steps, we chose 62 heuristics
of the six different works presented at Section 2.1:
five from InfoVis, plus the Nielsen’s original set.
In Step 3, we created a similarity matrix of
heuristics. In order to help us to identify groups, we
inserted this matrix into Matrix Reordering Analyzer
tool (Silva et al., 2014) and reordered it by an
algorithm based on Traveling Salesman Problem. The
result was a heatmap that visually clustered most of
the similar heuristics (Figure 1). We used these
clusters as an initial version of heuristic groups.
Next, we refined them and tried to insert into a
group each heuristic that was isolated. This situation
happens because these heuristics showed no
similarity with other heuristics. However, it was
possible to include these heuristics in other groups,
thinking in the broad characteristics of the group.
An example of this scenario is the “extract”
heuristic. It recommends that users must have ways to
extract visualizations in alternative files (such as file
format to print or sending by e-mail). During the
process to input the similarity grades, this heuristic
IVAPP 2017 - International Conference on Information Visualization Theory and Applications
228

did not present similarity with other heuristics.
However, when we analyzed the groups already
created, we perceived that it was possible to include
the “extract” heuristic in “Flexibility and Efficiency”
group, because one characteristic of this group is to
supply users with alternative ways to realize a same
task or action.
Other situation we observed during group
creation was to identify single heuristics that belongs
to two different groups. An example is the “grouping
and distinguishing items by format” heuristic, which
we related both to “Relations” group (because it tells
about grouping similar items and elements) and to
“Visual Properties” group (due to using format as a
property to distinguish items, referring to preattentive
properties and Gestalt principles).
Therefore, we identified 15 groups after this
analysis. We present each group as follows: group
name (and hence a heuristic for the set), brief
description, and a detailed one. The Appendix lists
the heuristics (originated from literature review) that
belongs to each group.
Group A – Multidimensionality: allow users to
visualize three or more dimensions simultaneously.
Data often have several dimensions (a.k.a. attributes
or variables). The system should support showing
several dimensions simultaneously in the
visualization, if the users want. In other words, the
system should provide scalability with regard to
dimensionality. Certain visualization techniques
behave well to show one or two dimensions, but in
some cases may be necessary to provide complex
techniques, that allow viewing more dimensions.
However, it is important that the representation of
several dimensions does not confuse the data
presentation and understanding.
Group B – Data Characterization: assist data
understanding. Visualization systems should present
clearly to users auxiliary information about the data
set, such as, which are the dependent and independent
dimensions, and the existence of missing data. The
user should be able to identify main domain
dimensions, causation data, and uncertainty, in order
to have a better understanding of data set. However,
in some cases, users may need to have experience in
the domain to realize this.
Group C – Data Manipulation: provide tools for
data manipulation, such as filters and detailed view.
Data set may be extensive. Therefore, visualization
systems should provide tools to help users in data
manipulation, e.g. filtering only relevant data and
hiding the irrelevant ones, searching for specific
information not present in visualization, or getting a
detailed view upon an item.
Group D – Spatial Organization and Perspective:
care the visualization overall layout, as well as
provide change of perspective. The visualization
overall layout directly influences the easiness of
locating an information on a display. Avoid data
occlusion, and place data marks in a logical order, in
order to help users to locate a desired information.
Other concerns are display limitations (like display
size or maximum number of elements), and need to
provide tools for perspective changing (such as zoom
in and zoom out features).
Group E – Visual Properties: perform data
mapping correctly, considering preattentive
properties and Gestalt principles. Data mapping must
be performed correctly, using color, size, shape,
position, among others properties, to represent
nominal, ordinal, and quantitative data. Take into
account Gestalt principles in the visualization (e.g.
proximity, similarity, and continuity).
Group F – Relations: allow view relations among
data. Relations are important to data set
understanding. Therefore, the system must help users
to see existent relations among data, for example, by
highlighting similar data or showing clusters. It is also
important that the user knows which data dimensions
determine a given relation.
Group G – Visual Clutter and Data Density:
present only relevant information and elements.
Systems must minimize user’s workload. They must
display only relevant information and elements to the
user. All irrelevant and superfluous information
displayed will increase the user’s workload and draw
attention. Excessive use of colors and contrast also
can hamper data reading.
Group H – Real World Equivalency: use familiar
signs to the user. All signs (codes, names, texts,
figures, and icons) in the interface must be familiar to
the user, and must have an expected meaning. Signs
also should be clear for all the system users.
Group I – Visible Actions: make all possible
actions visible. All actions that the user can realize in
the system must be visible and easily identified, as
well as the help resources and system instructions.
The system must provide means to guide the user, if
he does not know what to do, or aid him to choose the
best option when several are available.
Group J – Consistency: the interface elements
must be coherent. The system must follow the
established standards, i.e., different interface
elements must not have the same meaning. The
system must preserve the meaning of similar elements
in similar contexts.
Group K – Flexibility and Efficiency: provide
accelerators and customization features. The system
Adapting Heuristic Evaluation to Information Visualization - A Method for Defining a Heuristic Set by Heuristic Grouping
229

must provide accelerators, which increase user
interaction speed with the interface. Accelerators
directly benefit experienced users. Examples of
accelerators are shortcuts (e.g., allowing experienced
users to use keys to quickly do something), interface
customization according to user’s particular needs,
and multiple options to do (e.g. extract the
information displayed to different file formats).
System efficiency is also a way to accelerate
interaction, for example, by having conciseness in
data input, or minimizing steps required to perform
some action.
Group L – System Status and Feedback: notify
users about the system status, and always provide
quick and proper feedback. The system must always
inform users about what is happening (status or tasks
under execution). All the user actions must have
response, given through a proper feedback given in a
reasonable time.
Group M – User Control: enable full system
control by user. The user must have full system
control, and must be able to undo or redo any action
(a history with all user’s actions may be used).
Besides, the system must not execute any action
without user permission.
Group N – Error Prevention: prevent error
occurrence, eliminating error-prone conditions. The
system must anticipate user’s errors, not allowing
them to occur, even before the user execute them.
Error prevention strategies include not allowing
invalid entries and commands, and requiring user
confirmation to an action.
Group O – Error Correction: inform users about
errors occurred with clear messages and present
means to correct these errors. If the user or the
system do an error, the system must inform the user
about it with clear and informative messages,
detailing the reasons of the problems, as well as the
available means to correct them.
Table 1 shows the final set of 15 proposed InfoVis
heuristics.
Table 1: The 15 proposed InfoVis heuristics.
InfoVis Heuristic Set
Multidimensionality Real World Equivalency
Data Characterization Visible Actions
Data Manipulation Consistency
Spatial Organization
and Perspective
Flexibility and Efficiency
Visual Properties
System Status and
Feedback
Relations User Control
Visual Clutter and Data
Density
Error Prevention
Error Correction
5 CONCLUSIONS
In this paper, we proposed and used a method for
creating a new set of InfoVis heuristics, based on
grouping heuristics obtained from literature review.
Our grouping strategy enabled us to create a set with
15 heuristics that summarizes 62 other heuristics from
six previous works, most of them from InfoVis area
and with distinct focus among each other. Our
approach covered all these focuses and, at the same
time, preserved the heuristic set small enough for use
in a heuristic evaluation.
One limitation of our work is that reaching good
evaluation results probably relies on evaluator’s
experience in InfoVis, which could better understand
terms and concepts of this area. Other limitation is
that in the current stage of our research, we did not
cover guidelines that some InfoVis classical books
and usability papers present. A third point is that the
similarity grades may be biased because only two
researchers (the authors) defined them.
Future works aim to validate these heuristics by
using them to evaluate a set of InfoVis systems, and
by submitting them to a critical review of InfoVis
experts, in order to refine the heuristic set.
ACKNOWLEDGEMENTS
This work was supported by the São Paulo Research
Foundation (FAPESP) (grant number #2015/14854-
7) and by CAPES.
REFERENCES
Amar, R. and Stasko, J. (2004) ‘A Knowledge Task-Based
Framework for Design and Evaluation of Information
Visualizations’, in INFOVIS ’04 Proceedings of the
IEEE Symposium on Information Visualization. IEEE,
pp. 143–150.
Clarkson, E. and Arkin, R. C. (2007) ‘Applying heuristic
evaluation to human-robot interaction systems’,
Proceedings of the Twentieth International Florida
Artificial Intelligence Research Society (FLAIRS)
Conference, pp. 44–49.
Desurvire, H., Caplan, M. and Toth, J. A. (2004) ‘Using
heuristics to evaluate the playability of games’, CHI ’04
Extended Abstracts on Human Factors in Computing
Systems, pp. 1509–1512.
Forsell, C. and Johansson, J. (2010) ‘An heuristic set for
evaluation in information visualization’, in
Proceedings of the International Conference on
Advanced Visual Interfaces - AVI ’10. New York, New
York, USA: ACM Press, p. 199.
IVAPP 2017 - International Conference on Information Visualization Theory and Applications
230

Franklin, F., Breyer, F. and Kelner, J. (2014) ‘Usability
Heuristics for Collaborative Augmented Reality
Remote Systems’, 2014 XVI Symposium on Virtual and
Augmented Reality, pp. 53–62.
Freitas, C. M. D. S., Luzzardi, P. R. G., Cava, R. A.,
Winckler, M. A. A., Pimenta, M. S. and Nedel, L. P.
(2002) ‘Evaluating Usability of Information
Visualization Techniques’, Proceedings of 5th
Symposium on Human Factors in Computer Systems,
pp. 40–51.
Geerts, D. and De Grooff, D. (2009) ‘Supporting the social
uses of television’, in CHI ’09 Proceedings of the
SIGCHI Conference on Human Factors in Computing
Systems. New York, New York, USA: ACM Press, pp.
595–604.
Inostroza, R., Rusu, C., Roncagliolo, S., Jimenez, C. and
Rusu, V. (2012) ‘Usability Heuristics for Touchscreen-
based Mobile Devices’, in 2012 Ninth International
Conference on Information Technology - New
Generations. IEEE, pp. 662–667.
Inostroza, R., Rusu, C., Roncagliolo, S. and Rusu, V.
(2013) ‘Usability heuristics for touchscreen-based
mobile devices: update’, in Proceedings of the 2013
Chilean Conference on Human - Computer Interaction
- ChileCHI ’13. New York, New York, USA: ACM
Press, pp. 24–29..
Inostroza, R., Rusu, C., Roncagliolo, S., Rusu, V. and
Collazos, C. A. (2016) ‘Developing SMASH: A set of
SMArtphone’s uSability Heuristics’, Computer
Standards & Interfaces. Elsevier B.V., 43, pp. 40–52.
Jaferian, P., Hawkey, K., Sotirakopoulos, A., Velez-Rojas,
M. and Beznosov, K. (2011) ‘Heuristics for evaluating
IT security management tools’, SOUPS ’11:
Proceedings of the Seventh Symposium on Usable
Privacy and Security, pp. 1–20.
Kientz, J. A., Choe, E. K., Birch, B., Maharaj, R., Fonville,
A., Glasson, C. and Mundt, J. (2010) ‘Heuristic
evaluation of persuasive health technologies’, in
Proceedings of the ACM international conference on
Health informatics - IHI ’10. New York, New York,
USA: ACM Press, pp. 555–564.
Korhonen, H. and Koivisto, E. M. I. (2006) ‘Playability
heuristics for mobile games’, Proceedings of the 8th
conference on Humancomputer interaction with mobile
devices and services MobileHCI 06, pp. 9–16.
MacFarlane, S. and Pasiali, A. (2005) ‘Adapting the
Heuristic Evaluation Method for Use with Children’,
Workshop on Child Computer Interaction:
Methodological Research at Interact 2005.
Machado Neto, O. and Pimentel, M. D. G. (2013)
‘Heuristics for the assessment of interfaces of mobile
devices’, in Proceedings of the 19th Brazilian symposium
on Multimedia and the web - WebMedia ’13. New York,
New York, USA: ACM Press, pp. 93–96.
Mazza, R. (2009) Introduction to Information
Visualization. London: Springer London.
Mohamed Omar, H., Yusof, Y. H. H. M. and Sabri, N. M.
(2010) ‘Development and potential analysis of
Heuristic Evaluation for Courseware’, Engineering
Education (ICEED), 2010 2nd International Congress
on, pp. 128–132.
Muñoz, R. and Chalegre, V. (2012) ‘Defining virtual
worlds usability heuristics’, Proceedings of the 9th
International Conference on Information Technology,
ITNG 2012, pp. 690–695.
Nielsen, J. and Mack, R. L. (1994) Usability Inspection
Methods. New York, NY: John Wiley & Sons.
Papaloukas, S., Patriarcheas, K. and Xenos, M. (2009)
‘Usability assessment heuristics in new genre
videogames’, PCI 2009 - 13th Panhellenic Conference
on Informatics, pp. 202–206.
Park, K., Goh, T. and So, H.-J. (2014) ‘Toward accessible
mobile application design: developing mobile
application accessibility guidelines for people with
visual impairment’, Proceedings of HCI Korea, pp. 31–
38.
Pinelle, D., Wong, N., Stach, T. and Gutwin, C. (2009)
‘Usability heuristics for networked multiplayer games’,
in Proceedinfs of the ACM 2009 international
conference on Supporting group work - GROUP ’09.
New York, New York, USA: ACM Press, pp. 169–178.
Quinones, D., Rusu, C. and Roncagliolo, S. (2014)
‘Redefining Usability Heuristics for Transactional Web
Applications’, 2014 11th International Conference on
Information Technology: New Generations, (1), pp.
260–265.
Rusu, C., Roncagliolo, S., Rusu, V. and Collazos, C. (2011)
‘A methodology to establish usability heuristics’, in 4th
International Conference on Advances in Computer-
Human Interactions. Gosier, Guadeloupe; France, pp.
59–62.
Scapin, D. L. and Bastien, J. M. C. (1997) ‘Ergonomic
criteria for evaluating the ergonomic quality of
interactive systems’, Behaviour & Information
Technology, 16(4–5), pp. 220–231.
Shneiderman, B. (1996) ‘The eyes have it: a task by data
type taxonomy for information visualizations’, in
Proceedings 1996 IEEE Symposium on Visual
Languages. IEEE Comput. Soc. Press, pp. 336–343.
Silva, C. G. da, Melo, M. F. de, Paula e Silva, F. de and
Meidanis, J. (2014) ‘PQR sort: using PQR trees for
binary matrix reorganization’, Journal of the Brazilian
Computer Society, 20:3(1).
Soomro, S., Ahmad, W. F. W. and Sulaiman, S. (2012) ‘A
preliminary study on heuristics for mobile games’, in
2012 International Conference on Computer &
Information Science (ICCIS). IEEE, pp. 1030–1035.
de Souza, C. S., Leitão, C. F., Prates, R. O. and da Silva, E.
J. (2006) ‘The semiotic inspection method’, in
Proceedings of VII Brazilian symposium on Human
factors in computing systems - IHC ’06. New York,
New York, USA: ACM Press, pp. 148–157.
Weiss, A., Wurhofer, D., Bernhaupt, R., Altmaninger, M.
and Tscheligi, M. (2010) ‘A methodological adaptation
for heuristic evaluation of HRI’, in 19th International
Symposium in Robot and Human Interactive
Communication. IEEE, pp. 1–6.
Zuk, T. and Carpendale, S. (2006) ‘Theoretical analysis of
uncertainty visualizations’, Electronic Imaging 2006,
6060(March), pp. 1–14.
Adapting Heuristic Evaluation to Information Visualization - A Method for Defining a Heuristic Set by Heuristic Grouping
231

APPENDIX
List of heuristics within each group:
Group A – Multidimensionality:
Multivariate explanation (Amar and Stasko, 2004)
Preserve data to graphic dimensionality; put the most
data in the least space (Zuk and Carpendale, 2006)
Cognitive complexity (Freitas et al., 2002)
Group B – Data Characterization:
Expose uncertainty; formulate cause and effect;
determination of domain parameters; confirm
hypothesis (Amar and Stasko, 2004)
Group C – Data Manipulation:
Filter; zoom; details-on-demand (Shneiderman,
1996)
Navigation and querying; data set reduction (Freitas
et al., 2002)
Provide multiple levels of detail (Zuk and
Carpendale, 2006)
Group D – Spatial Organization and Perspective:
Spatial organization; limitations (Freitas et al., 2002)
Overview; zoom (Shneiderman, 1996)
Ensure visual variable has sufficient length;
preattentive benefits increase with field of view (Zuk
and Carpendale, 2006)
Group E – Visual Properties:
Consider Gestalt Laws; do not expect a reading order
from color; color perception varies with size of
colored item; quantitative assessment requires
position or size variation; consider people with color
blindness (Zuk and Carpendale, 2006)
Grouping and distinguishing items by location;
grouping and distinguishing items by format (Scapin
and Bastien, 1997)
Group F – Relations:
Concretize relationships (Amar and Stasko, 2004)
Relate (Shneiderman, 1996)
Grouping and distinguishing items by location;
grouping and distinguishing items by format (Scapin
and Bastien, 1997)
Group G – Visual Clutter and Data Density:
Aesthetic and minimalist design (Nielsen and Mack,
1994)
Cognitive complexity (Freitas et al., 2002)
Information density; legibility (Scapin and Bastien,
1997)
Remove the extraneous (ink); local contrast affects
color & gray perception (Zuk and Carpendale, 2006)
Group H – Real World Equivalency:
Significance of codes; compatibility (Scapin and
Bastien, 1997)
Match between system and the real world (Nielsen
and Mack, 1994)
Information coding (Freitas et al., 2002)
Integrate text wherever relevant (Zuk and
Carpendale, 2006)
Group I – Visible Actions:
Prompting (Scapin and Bastien, 1997)
Recognition rather than recall; help and
documentation (Nielsen and Mack, 1994)
Group J – Consistency:
Consistency (Scapin and Bastien, 1997)
Consistency and standards (Nielsen and Mack, 1994)
Group K – Flexibility and Efficiency:
Minimal actions; flexibility; conciseness; user’s
experience (Scapin and Bastien, 1997)
Flexibility and efficiency of use (Nielsen and Mack,
1994)
Extract (Shneiderman, 1996)
Group L – System Status and Feedback:
Visibility of system status (Nielsen and Mack, 1994)
Immediate feedback; explicit user actions (Scapin
and Bastien, 1997)
State transition (Freitas et al., 2002)
Group M – User Control:
User control; explicit user actions (Scapin and
Bastien, 1997)
User control and freedom (Nielsen and Mack, 1994)
History (Shneiderman, 1996)
Orientation and help (Freitas et al., 2002)
Group N – Error Prevention:
Error protection; conciseness (Scapin and Bastien,
1997)
Error prevention (Nielsen and Mack, 1994)
Group O – Error Correction:
Quality of error messages; error correction (Scapin
and Bastien, 1997)
Help users recognize, diagnose and recover from
errors (Nielsen and Mack, 1994)
IVAPP 2017 - International Conference on Information Visualization Theory and Applications
232
