Indoor Localization of the Points of Interest using RO-SLAM
Yamnia Rodríguez Esteves
1
, Julio Barbancho Concejero
2
and Antidio Viguria Jiménez
1
1
FADA-CATEC - Center for Advanced Aerospace Technologies, Seville, Spain
2
University of Seville, Seville, Spain
Keywords:
RO-SLAM, Beacons, Indoor Localization, RSSI, Sensor Network.
Abstract:
This paper describes an indoor localization system based on RO-SLAM technique, which has been led to
experimentation. The proposed system has been considered to have low power consumption. The nodes of the
network are based on the well-known architecture TelosB. A distance estimation study has been developed in
order to determine the relationship between radio power signal strength in a radio link and distance between
nodes. This relationship has a high variability and given its importance for successful tracking, much of this
work has been devoted to its study. This system could be applied as a usefull solution for localization in a
warehouse, where GPS-based system does not work. Based on the results obtained, this system is deemed as
feasible because the motes have been localized with an acceptable error (1.2 m) under real conditions.
1 INTRODUCTION
This work, on the one hand, evaluates experimentally
the accuracy of a particular estimation of the distance
from the power level of received signals using a sen-
sor network deployed with TelosB motes (J. Polastre,
2005), and on the other hand, it uses such estimations
as input to an implementation of the RO-SLAM al-
gorithm (Range-Only Simultaneous Localization and
Mapping) (F.R. Fabresse, 2013) to find the coordi-
nates x and y for each device.
The organization of this paper is described as fol-
lows. First, the objectives of this work are described.
Second a panoramic of the distance estimation meth-
ods based on RSSI is addressed. From this study a
method of estimation, which will be led to experi-
mentation, will be selected. The whole description
of the system used is given in section named System
Study. Then, the evaluation of the estimated distance
calculation and the mote position estimations are ex-
plained in section Experimental Results. Finally, the
paper includes a section of conclusions and certain
approaches for future work.
2 OBJECTIVES
The main objective of this work is the localization of
multiple fixed targets or markers, distributed in a com-
pletely unknown environment using a mobile system
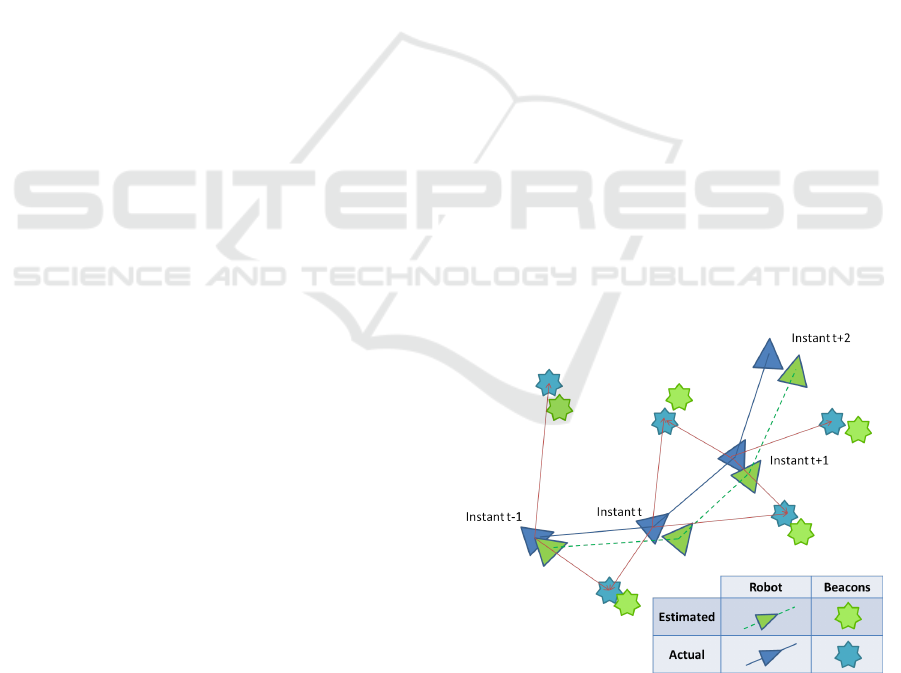
Figure 1: SLAM problem diagram.
or robot which do not know its position.
An application of this approach could be the lo-
cation of goods (beacons) on a large warehouse (un-
known environment) taking advantage of a common
mobile system, such a truck cleaning, a crane, a trol-
ley, etc. In other words, the problem is to solve the
case in which a mobile system is in an unknown map
and an unknown position. When the system moves,
the system builds incrementally a map and determines
its position in this map.
This problem, as shown in Figure 1, can be solved
using different approaches. A booming technique in
recent years, with interest to research is to employ the
35
Rodríguez Esteves Y., Barbancho Concejero J. and Viguria Jiménez A..
Indoor Localization of the Points of Interest using RO-SLAM.
DOI: 10.5220/0005569400350042
In Proceedings of the 6th International Conference on Data Communication Networking (DCNET-2015), pages 35-42
ISBN: 978-989-758-112-0
Copyright
c
2015 SCITEPRESS (Science and Technology Publications, Lda.)

RO-SLAM method. An interesting article about RO-
SLAM is described in (J.L. Blanco, 2008).
The beacons or landmarks, which are shown in
Figure 1, are the characteristics of the map that pro-
vide a quantifiable measure of what has been the
movement of the system. For this purpose, it is possi-
ble to use a wide variety of sensors: lasers, cameras,
sonar, wireless sensor networks, etc.
The difference between SLAM and RO-SLAM is
based on the fact that, RO-SLAM solves this problem
considering that the information received by the sys-
tem is only the distance to the beacons. That is, the
system knows that it has a beacon at a distance fixed
but the direction is unknown. SLAM also knows the
direction in which the beacon is located. The RO-
SLAM scenario allows the use of simplified sensors:
less sophisticated and therefore less expensive sen-
sors.
A frequent and cheap way to implement a distance
sensor is based in the use of wireless communications.
There are many manufacturers that provide this kind
of sensors. Therefore, to make a localization based
on the power level of the RF signals (Received Sig-
nal Strength Intensity, RSSI), the first step is to have
a quantitative correlation between distance and power
level of a radio link. This essential first step has re-
quired a big percentage of the time spent on the devel-
opment of the work described in this paper. The suc-
cess of the localization technique designed is based
on the accuracy of this step.
3 PANORAMIC OF RSSI VS
DISTANCE MODELS
This section collects a summary of the most impor-
tant models presented in the literature that relates the
strength of the radio signal received in a wireless de-
vice and emitted by a transmitter and the distance be-
tween them.
Currently, the RSSI propagation models in wire-
less sensor networks (WSN) include the model of free
space, the bidirectional ground reflectance model and
the log-normal shadow model or log distance path
loss model (J. Xu, 2010).
The free space loss (FSL) measures the spread of
the power in free space without obstacles. If the dis-
tance (d) is measured in meters and the frequency (f)
is measured in hertz, the formula of the FSL could be:
FSL(dB) = 20log
10
d + 20log
10
f − 187.5 (1)
In practice, the relationship between distance and re-
ceived signal power is more complex than the above
expression. Actually, the received power will be the
sum of a series of signals coming from different di-
rections, due to reflections objects and obstacles that
partially block the signal. Thus, the received power
resulting may be higher or lower than the output when
space free.
The ground bidirectional reflectance model is very
accurate when used in urban environment (J. Xu,
2010) but can not be applied to the context of this
work due to the heights of the antennas (below 50 me-
ters).
Furthermore, the log-normal shadow model is a
more general propagation. It is suitable for both in-
door and outdoor communications. The model pro-
vides a number of parameters that can be configured
according to different environments (J. Xu, 2010).
The model is usually expressed as the following equa-
tion:
L(dB) = P
o
+ 10nlog
10
(
d
d
o
) + X
σ
(2)
Where L is the loss of power on the path, n is the path
loss exponent, d is the distance between transmitter
and receiver, X
σ
is a Gaussian random variable with
standard deviation σ and P
o
is the received power ref-
erenced in the distance d
o
.
Over the years there have been a large number
of models to predict the path loss in typical wire-
less environments as large urban cells, small urban
cells, and more recently in buildings. These models
are mainly based on empirical measurements at dif-
ferent distances for a given range of frequencies and
in a particular geographical area or building. Exam-
ples of these models are the model Okumura, Hata
model or model of COST 231 (H. Rábanos, 2006).
All these models are complex for their application in
the present work, therefore the simplified model of
the log-normal shadow model is chosen for the exper-
imentation.
This simplification is specified by Chipcon in (A.
Faheem, 2010). Chipcon is a transceivers manufac-
turer of the TelosB motes. The RSSI is given by the
following expression:
RSSI(dBm) = −10nlog
10
d + A (3)
Where n is the propagation exponent, d is the distance
from the transmitter measured in meters and A is the
strength of the received signal at a distance of one me-
ter. In this approach to the problem, RSSI and A pa-
rameters are known. In this way, n (4) can be cleared
and estimated as an average with each pair of (RSSI,
distance) collected in the experiment to find a plau-
sible parameter value. Then, the distance (5) can be
cleared in order to calculate its estimated value ac-
cording every RSSI value. Finally, it is interesting to
DCNET2015-InternationalConferenceonDataCommunicationNetworking
36
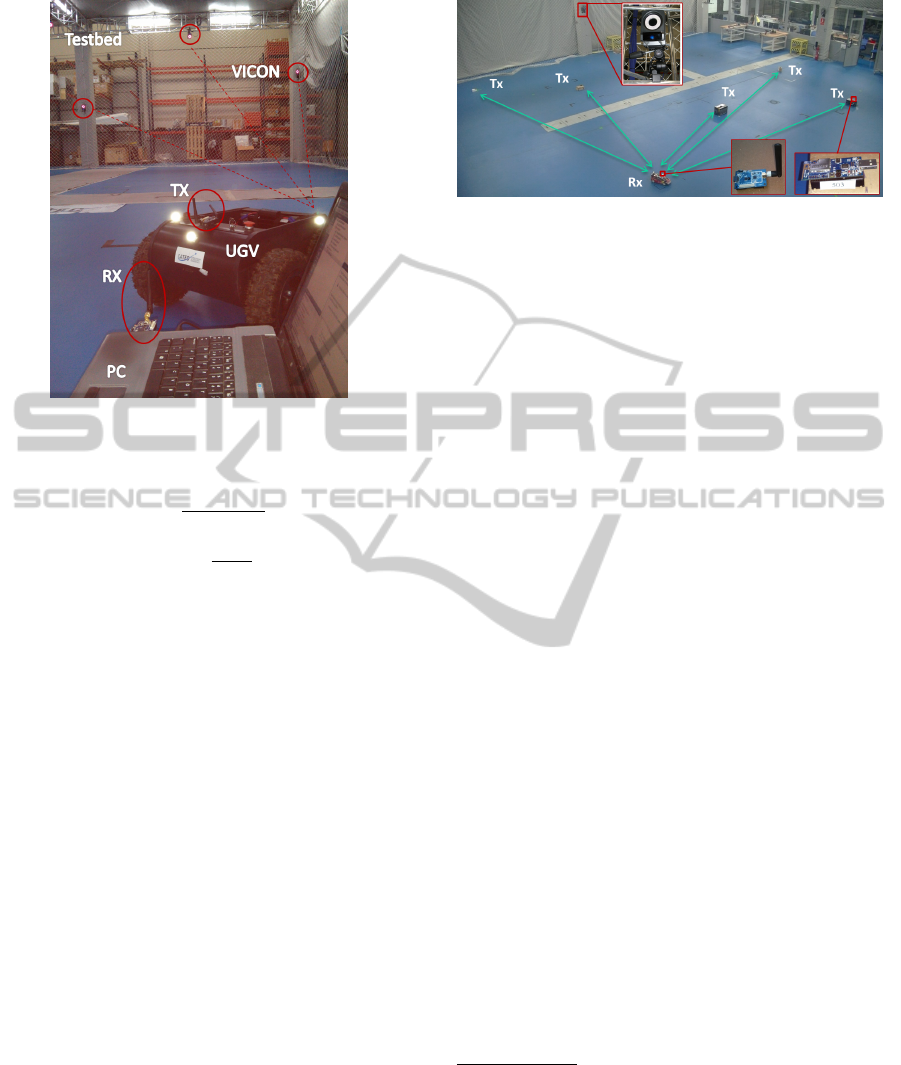
Figure 2: System with UGV (Unmanned Ground Vehicle).
quantify the error with that approximation.
n = −
RSSI − A
10nlog
10
d
(4)
d = 10
−
RSSI−A
10n
(5)
This approach presents a problem of validation. Ex-
perimentally it is proven to be valid only beyond one
meter distance between transmitter and receiver.
4 SYSTEM STUDY
During the workflow, the system used for the study
has evolved. The systems used in chronological order
have been:
• Simulation system based on ROS (Robot Op-
erating System) (ROS, 2015) and MRPT (Mo-
bile Robot Programming Toolkit) (MRPT, 2015),
which estimates the positions of beacons using
RO-SLAM algorithms. Using this simulator, the
accuracy of estimated positions was tested versus:
– Number of beacons.
– Concentration of beacons.
– Error distance.
– Error odometry.
– Robot route.
• Actual system (Figure 2) formed by:
– an UGV (Unmanned Ground Vehicle),
– two TelosB motes with external antennas,
MTM-CM3000 MSP Rev 01 model (TelosB,
2015) and
Figure 3: System for RO-SLAM.
– the infrared positioning system, VICON (VI-
CON, 2006) as ground-truth
1
.
This system has been used to evaluate the esti-
mated RSSI/distance relationship.
• Actual system formed by:
– an autonomous car in scale,
– six TelosB motes with intern microstrip anten-
nas and other one with external antenna for the
reception.
– The VICON system as ground-truth.
This system has been used to evaluate the esti-
mated localization of the motes using the RO-
SLAM technique.
Thanks to the simulation system, three major con-
clusions are obtained:
• Odometry information is necessary in a RO-
SLAM system if you want an acceptable RMS in
position (e.g less than 5 meters).
• The concentration of beacons and path robot are
decisive. The best situation is a rich homoge-
neous concentration characteristics (shown in Fig-
ure 4(a)).
If at the beginning of RO-SLAM algorithm no in-
put data are obtained (as shown in Figure ??), it
will accumulate biggest error in the above situa-
tion. Similarly, the error decreases (uncertainty
of the beacon positions is reduced) more rapidly
as soon as the robot turn. Therefore, if the robot
does not rotate at the start of its travel, the ob-
tained location is worst (as can be seen in Figure
4(c)).
1
The VICON system is the most advanced optical mo-
tion capture system available. Determines the position of
the moving objects in the volume which controls with a mil-
limeter accuracy and very low latency (2.5 ms). Reflective
marks will be placed on those objects that we want to cap-
ture their movement. As shown in Figure 2, these marks are
added to UGV. In this manner, its position is known at any
instant and the distances to TelosB motes (whose positions
have also learned using VICON) can be calculated.
IndoorLocalizationofthePointsofInterestusingRO-SLAM
37
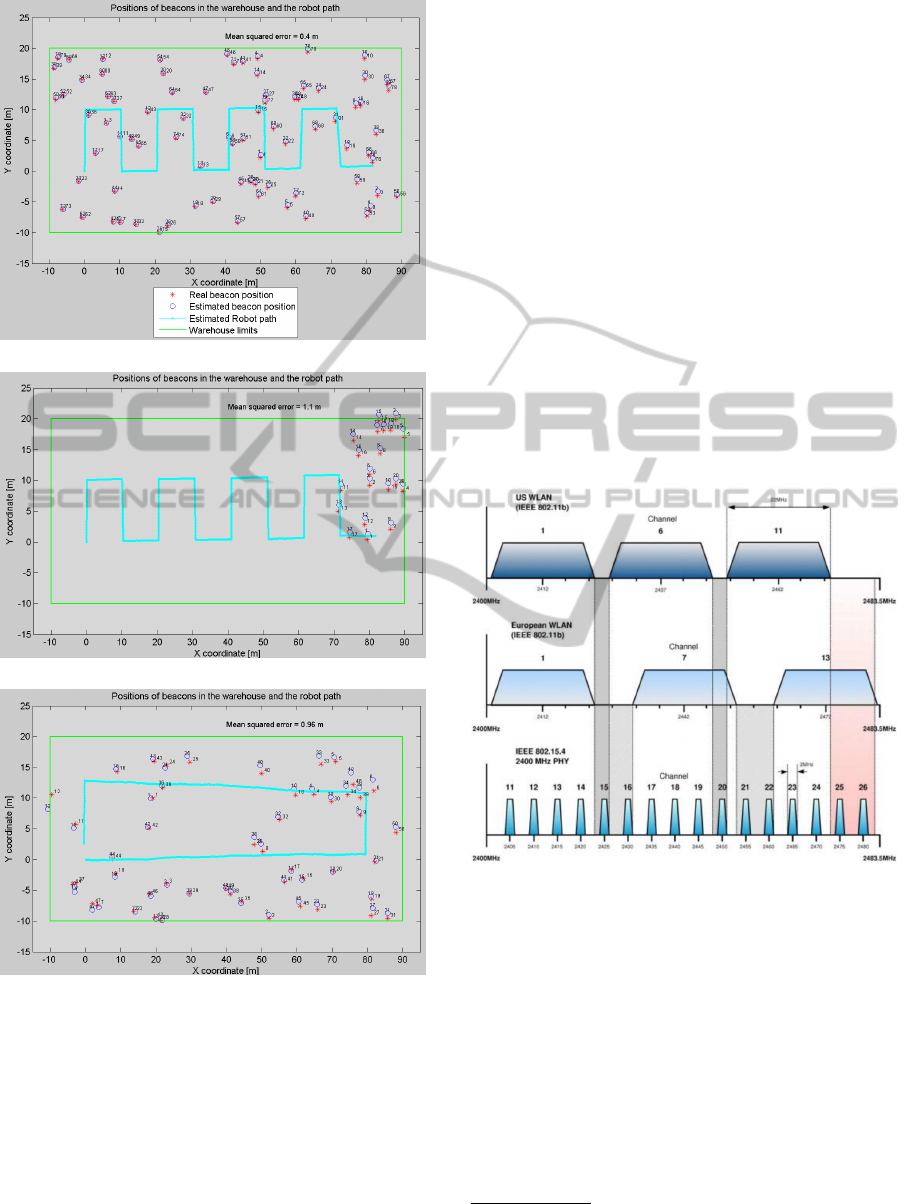
(a) Analysis of the number of beacons.
(b) Analysis of the arrangement of beacons.
(c) Robot path analysis.
Figure 4: Simulation results.
• Distance errors are obtained as far away surround-
ings [0.6,1.2] m under favorable conditions.
Based on these results, the actual experiments fo-
cus on a homogeneous deployment of beacons. This
way since t = 0, the robot receives signal transmitting
motes considering a reliable odometry.
All the software used in this study was designed
and implemented in C/C++ language. Including com-
munications systems, logging, configuration and con-
trol. The control part refers to the drivers of mobile
platforms implemented in Matlab/Simulink
c
. Also,
the scaled RC car has been modified to have an au-
tonomous position control by adding a new design
hardware based on the board Raspberry Pi (Raspbery
Pi, 2015).
The software embedded on the motes manages
the communications between motes. This software is
based on the tutorial Demo RSSI (RSSI Demo, 2015).
The communication is configured to send data every
100 ms and the transmission power is not restricted
so that there is constant communication throughout
the testbed. The communication channel used in the
CC2420 transceiver is channel 26 (TinyOS toolchain,
2014) corresponding with the center frequency 2480
MHz. In this way, there are no problems of in-
terference between wireless communication (IEEE
802.11g) as shown in Figure 5 because the channel
13 is not used in the work environment.
Figure 5: No channel overlapping between WLAN and LR-
WPAN
2
.
5 EXPERIMENTAL RESULTS
In this section all results and analysis of the files
stored during the experiments are included. The pro-
cessing of these data was performed using the Matlab
tool.
It is needed to know that the CC2420 transceiver
of TelosB devices calculates the RSSI of 8 sym-
bol periods and stores the result in the record
2
Keep in mind that the division of channels in 802.11b
is the same as in 802.11g.
DCNET2015-InternationalConferenceonDataCommunicationNetworking
38
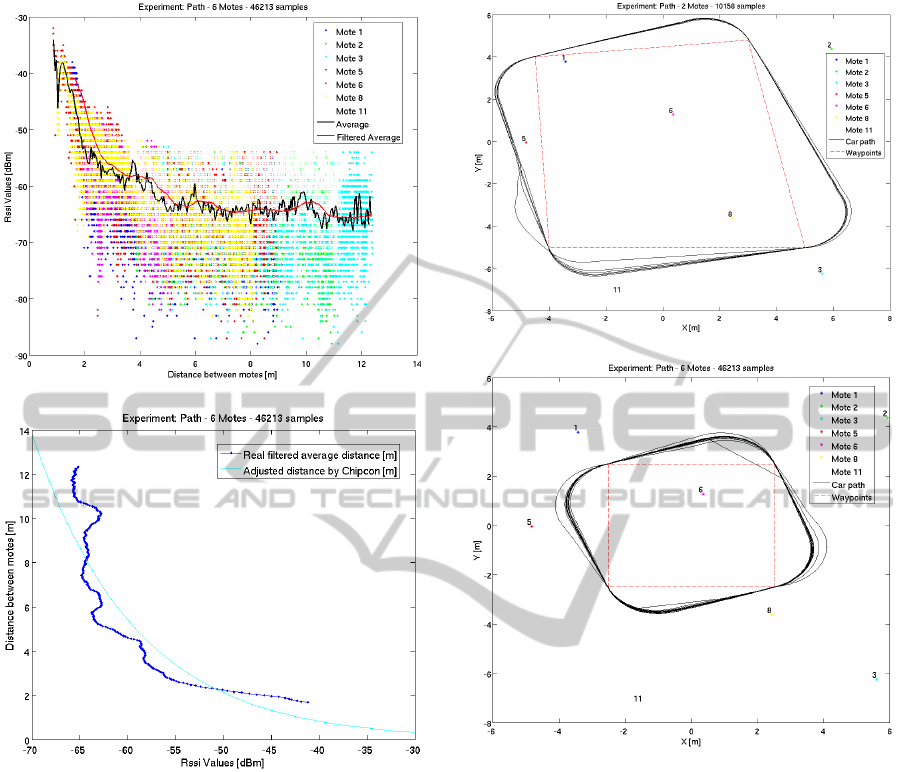
(a) RSSI measurements versus radio link distance.
(b) Chipcon model adjusted to the samples.
Figure 6: Received Signal Strength Intensity (RSSI) sam-
ples and generated model.
RSSI.RSSI_VAL. Texas Instruments specifies the for-
mula 6 to calculate the received signal power (P) in
dBm.
P = RSSI_VAL + RSSI_OFF_SET (6)
The RSSI_OFFSET of CC2420 is empirically found
during development of the system. It is approximately
−45dBm (CC2420 Datasheet, 2007). The graphics
contained in the present document have that offset
added to the captured data during the experiments.
5.1 Results of the Distance Estimation
In Figure 6(a), it is possible to appreciate the
great variability of RSSI data and data discretization
(a) Ground-truth 1.
(b) Ground-truth 2.
Figure 7: Robot paths and mote locations.
(1dBm). This is the discretization of the sensor hard-
ware.
Given the variability of RSSI data for a same dis-
tance, a previous treatment is applied in order to min-
imize the data variability. The procedure to minimize
it is based on the calculus of the average of the data.
This is an approach used in various studies such as (J.
Xu, 2010). Furthermore, a 20th order data filtered has
been made, as shown in Figure 6(a) to calculate the
unknowns Chipcon model.
The model obtained against the actual distance
based on the RSSI values is shown in Figure 6(b)
where the root-mean-square error (RMSE) is 0.9 m
in the distance range [1, 10] m. This is the validity
range of the approach. All these measures were col-
lected during the execution of the experiments shown
in Figure 7 at slow velocity (0.01 m/s).
Samples collected at high speeds (1 m/s) have
IndoorLocalizationofthePointsofInterestusingRO-SLAM
39
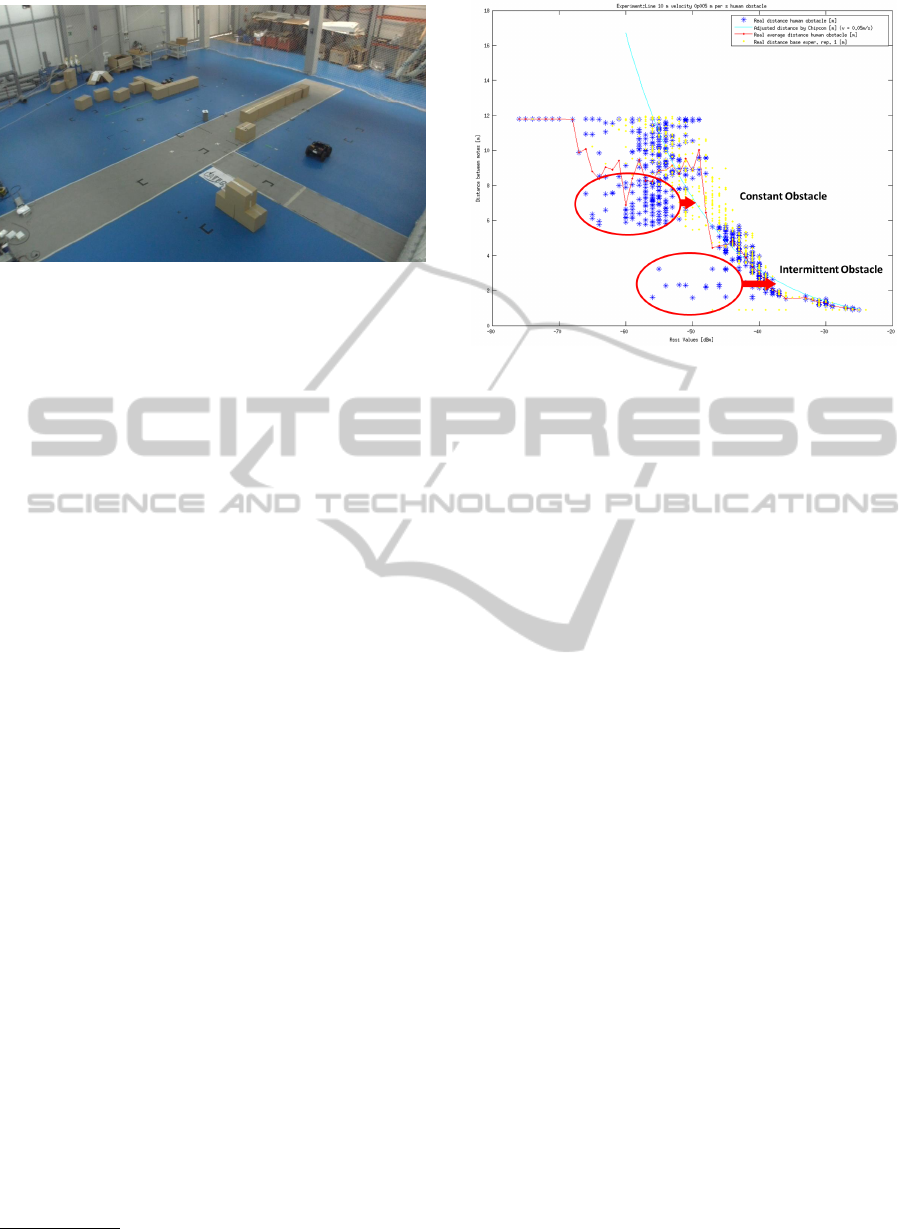
Figure 8: Experiment with constant obstacle in the radio
link.
been also analyzed, and except for the logical reduc-
tion of the samples, no significant change in the pre-
vious ratio RSSI/distance is appreciated.
Furthermore, experiments have been conducted to
evaluate the effect of obstacles. First, by the transit of
a person in the LOS
3
and second, using a permanent
carton wall placed in the LOS of the communication,
as shown the Figure 8.
In the case of the person transit, given the mul-
tipath communication of the scenario and the obsta-
cle used in the experiment which does not obstruct
the entire Fresnel zone, the communication between
motes is not interrupted. But it is causing a decreased
level of received signal and therefore, the estimated
RSSI/distance using the relationship of the basic ex-
periment (same conditions but without obstacle) has
major errors.
When there is decrease in the received signal
strength, the estimation indicates a farther distance
between the motes when in fact they are closer. This
situation is caused by the fact that the communication
between nodes is occluded. This is shown in Figure
9, where a set of samples have been shifted to lower
RSSI values having the same distance from the basic
experiment.
In the case of carton box, the obstacle has no
impact on the Fresnel zone due to the absorption
of the radio signal by this material is insignificant.
Therefore, the collected samples during the experi-
ment does not reflect the existence of an obstacle in
the LOS.
Finally, experiments have been performed using
the technology 802.11g, where it has been evidenced
that the estimated model fits the data worse (the RMS
error of the approximation increases) when the hard-
ware is changed.
3
Line Of Sight
Figure 9: Relationship RSSI/distance with intermittent ob-
stacle in LOS.
5.2 Results of the Localization
Estimation using RO-SLAM
In this section the estimation of the positions of the
motes for three conditions are evaluated:
• No odometry error (Figures 10(a) and 11(a)).
• Low odometry error, 0.001 m and analyzing only
the measures included in the validity range of the
estimated model (Figures 10(b) and 11(b)).
• Odometry error 0.01 m (Figures 10(c) and 11(c)).
In the most favorable situation (without odometry
error), three motes are perfectly located (RMS less
than a meter). If the mote disposition is observed,
these three motes coincide with the motes that are
within the route and therefore, available RSSI mea-
sures are over 360 degrees. The worst located motes
are far away from the robot path.
If the odometry error is increased to 0.001 m (by
adding a normally distributed variable error to the ac-
tual displacement), the location of the central motes
(5, 6 and 8) is worse but using the validity range of
the Chipcon model, distances between 1 and 9 me-
ters, the location of far motes is improved by a meter.
Finally, the rise of odometry error to 0.01 m
causes a significant increase in RMS (several meters),
except in the mote 8 in which it remains close to one
meter.
Based on these results, it can be concluded that the
validity range of the model should be applied. It could
be even limited to the best modeled area [2.5,7]m.
Furthermore, a mote is better localized if the mobile
robot includes measures in all directions around it.
In the first instance, this system is valued due to
the fact that the motes can be located with an accept-
able error (1-2 meters) under real conditions. An error
DCNET2015-InternationalConferenceonDataCommunicationNetworking
40
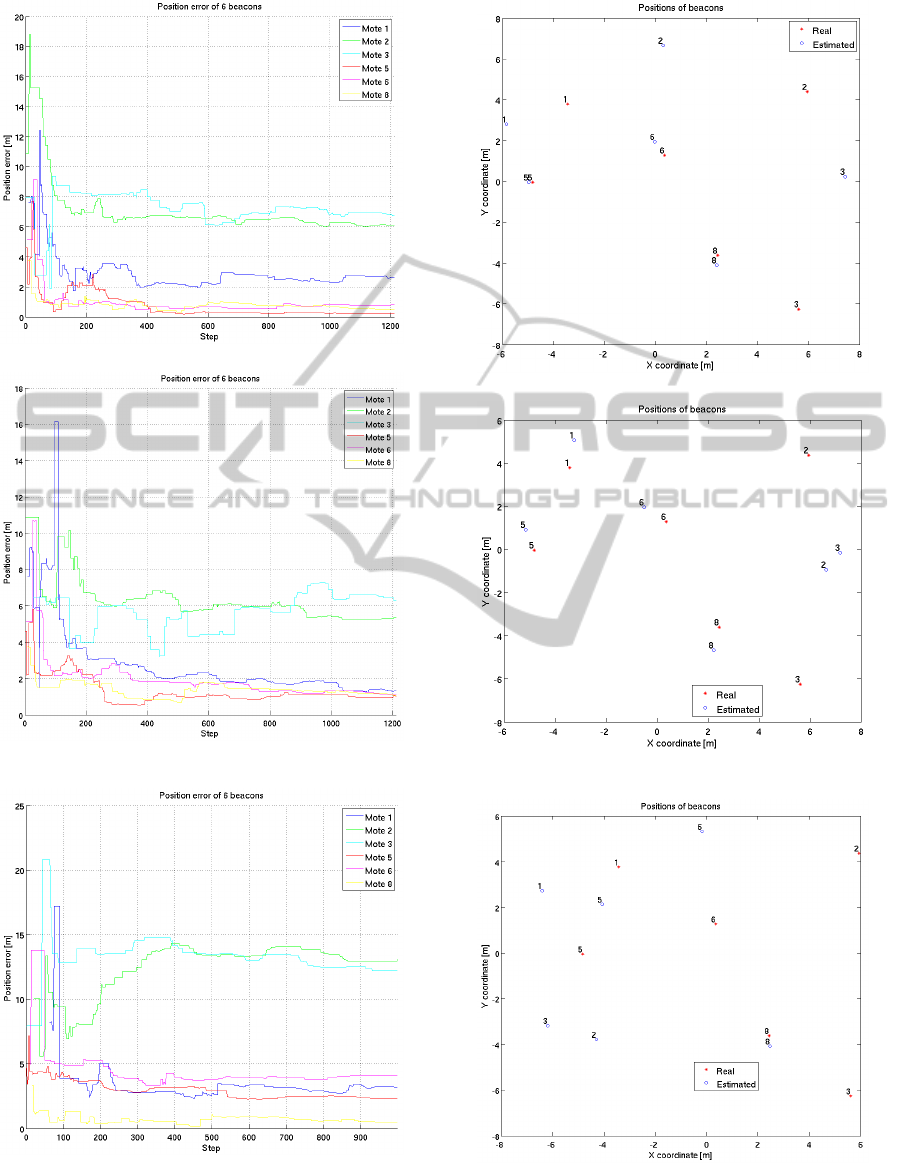
(a) Case: No odometry error.
(b) Case: Odometry error 0.001 m and measurements into
valid range.
(c) Case: Odometry error 0.01 m.
Figure 10: Error evolution during the mote location estima-
tion.
(a) Case: No odometry error.
(b) Case: Odometry error 0.001 m and measurements
into valid range.
(c) Case: Odometry error 0.01 m.
Figure 11: Actual mote locations and its estimation.
IndoorLocalizationofthePointsofInterestusingRO-SLAM
41

odometry 0.01 m can be assumed by sensors on the
market today. However, the system must be brought
into a more extensive testing campaign covering top-
ics such as obstacles.
6 CONCLUSIONS
Thanks to this work certain limitations and aspects of
the RSSI/distance relationship that have been applied
in the development of an indoor positioning system
based on RSSI measurements are known.
Talking about the distance estimation and the es-
timation of the mote positions, the results are promis-
ing. More data collection, refinement parameters and
the application of techniques more advanced could
reduce the obtained errors and make the system ro-
bust to adverse conditions. The indoor localization
for most applications, such as navigational assistance
or finding property (about one or two cubic meters) in
a warehouse (100 or 200 m), an error of 1 or 2 meters
is acceptable.
7 FUTURE WORK
The central problem of this work is very wide and
can be extended along different paths and objectives.
Some of them are:
• Repeating the experiments in other different en-
vironments: free space, rich in metal scenarios,
communication between rooms, floors, etc.
• Study of the filtering techniques and data fusion
as the radio link quality, LQI, for best results as
(S.J. Halder, 2012).
• Comparison with other wireless devices with dif-
ferent hardware and features.
• Greater experimentation with RO-SLAM, even
approaching it to a 3D location.
• Investigation of the obstacles effect and interfer-
ence on RSSI-distance relationship. Keeping this
relationship updated in an adaptive system using,
for example, known reference nodes (A. Awad,
2007).
• Research about the localization systems based
on the relationship studied, methodologies, tech-
niques, precision applications.
REFERENCES
J. Polastre, R. Szewczyk and D. Culler, (2005). Telos: en-
abling ultra-low power wireless research. In Interna-
tional Symposium on Information Processing in Sen-
sor Networks (IPSN).
F.R. Fabresse, F. Caballero, I. Maza and A. Ollero, (2013).
Undelayed 3D RO-SLAM based on Gaussian-Mixture
and Reduced Spherical Parametrization. In IEEE/RSJ
International Conference on Intelligent Robots and
Systems (IROS).
J.L. Blanco, J.A. Fernandez-Madrigal and J. González,
(2008). Efficient Probabilistic Range-Only SLAM.
In IEEE/RSJ International Conference on Intelligent
Robots and Systems (IROS).
W. Liu, F. Lang, Y. Zhang, C. Wang, (2010). Distance Mea-
surement Model Based on RSSI in WSN. In Wireless
Sensor Network.
H. Rábanos, (2006). Transmisión por radio. Edition Ramón
Areces 2006.
A. Faheem, R. Virrankoski and M. Elmusrati, (2010). Im-
proving RSSI based distance estimation for 802.15.4
wireless sensor networks. In IEEE International Con-
ference on Wireless Information Technology and Sys-
tems (ICWITS).
Robot Operating System, ROS. (2015). http://www.ros.org
Accessed: 2015-03-15.
Mobile Robot Programming Toolkit, MRPT. (2015). http://
www.mrpt.org Accessed: 2015-03-15.
TelosB datasheet. (2015). http://www.advanticsys.com/
shop/mtmcm3000msp-p-6.html Accessed: 2015-01-
20.
Vicon company, (2006). Vicon MX Hardware System Ref-
erence. Edition Revision 1.4.
Official web Raspbery Pi, (2015). http://
www.raspberrypi.org Accessed: 2015-04-1.
TinyOS Tutorial RSSI Demo, (2015). http://tinyos.
stanford.edu/tinyos-wiki/index.php/Rssi_Demo Ac-
cessed: 2015-01-10.
Manual TinyOS toolchain, (2014). http://www.tinyos.net/
dist-2.0.0/tinyos-2.x/doc/html/tutorial/lesson13.html
Accessed: 2014-11-21.
Chipcon CC2420 Datasheet, Texas Instruments, 2007.
http:// focus.ti.com/ lit/ ds/ symlink/ cc2420.pdf Ac-
cessed: 2014-11-21.
S.J. Halder and W. Kim, (2012). A Fusion Approach of
RSSI and LQI for Indoor Localization System Using
Adaptive Smoothers. In Journal of Computer Net-
works and Communications.
A. Awad, T. Frunzke and F. Dressler, (2007). Adaptive
Distance Estimation and Localization in WSN us-
ing RSSI Measures. In 10th Euromicro Conference
on Digital System Design Architectures, Methods and
Tools.
DCNET2015-InternationalConferenceonDataCommunicationNetworking
42
