
Error Modeling and Simulation for Directional Testing of Space
Block
Hongquan Wu
1
, Guangling Dong
1
, Chi He
2
, Wei Ma
1
, Jietao Xie
1
, Ruibing Shi
1
and Hongqiang Wei
1
1
Department of Test Technology, Baicheng Ordnance Test Center of China, P. O. Box 108, Baicheng, China
2
School of Mechatronic Engineering, CUST, 7089 Weixing Road, Changchun, China
Keywords: Derivative Error Propagation, Monte Carlo, Non-contact Measurement.
Abstract: A directional testing model of space block is studied for effective utilization of optical equipment as
theodolite, which gives out the influencing range of testing error on the calculated results. Thus, gists for
guaranteeing actual measuring accuracy and improving testing efficiency are provided. And, the open
question in accurate measurement of space block direction can be solved. In this paper, angular information
of two different marker points on space block are used for directional testing, through which a partial
derivative based error propagation model is built. The rationality and credibility of this model is verified by
Monte Carlo simulation. Besides, its calculation results are validated through conventional variance test
method in the end. The validation results indicate the rationality and credibility of the partial derivative
based error propagation model. The error propagation model can be used to study measuring error
distributions on different areas of space block, which lays a firm foundation for optimizing measuring
stations distribution, and guarantees measure precision.
1 INTRODUCTION
Research on error modeling and directional testing
of space block is primarily focus on measurement
calculation of accurate space block axis direction
and its error propagation model, which is significant
for precision measurement. And takes on wide
applied range. For example, initial azimuth angle
alignment and maintainance for high accuracy
inertial navigation system (INS) require adjusting,
assessment and calibration on the system. Besides,
as to some long range ground-based weapons with
indirect aiming, their shooting accuracy depend
directly on loaded initial azimuth data and
corresponding calibrated azimuth directional
accuracy.
In this paper, the 'space body' refers to the
system that has higher directional requirements.
Such as the gun barrel axis direction of remote
launched weapon system, the axis direction of
guided weapon with inertial navigation system, the
different parts of ship stitched in accordance with
the accurate direction, the different parts of bridge
connected in accordance with the accurate direction,
etc. The direction testing of these systems is mainly
done by measuring the direction of its axis.
Direction testing for space block axis are
generally divided into contact and non-contact types,
each with corresponding measuring method. As for
non-contact testing type, double theodolites based
(Zeng and Lai, 2011) and unit-set total station based
(Zeng et al, 2013) measuring methods are
frequently-used at present. Some double theodolites
based measuring methods bring range information
into angle calculation (Shi, 2014).
In most case, space blocks are vehicle-mounted
or ship-based, whose azimuth pointing direction can
not be given out directly by high precision
orientation equipment as turntable. Therefore,
measurement and calibration of high precision
azimuth pointing direction could only be obtained
through non-contact testing with optical equipments
as theodolite. In pointing direction testing of space
block, factors as electromagnetic environment,
installation site, movement process, even
atmospheric environment on carrier platform have
effects on testing results.
Conventional measuring methods for
propagating errors include derivative propagation
method and Monte Carlo method. Conventional
derivative algorithm takes on different
461
Wu H., Dong G., He C., Ma W., Xie J., Shi R. and Wei H..
Error Modeling and Simulation for Directional Testing of Space Block.
DOI: 10.5220/0005511704610468
In Proceedings of the 5th International Conference on Simulation and Modeling Methodologies, Technologies and Applications (SIMULTECH-2015),
pages 461-468
ISBN: 978-989-758-120-5
Copyright
c
2015 SCITEPRESS (Science and Technology Publications, Lda.)

computational efficiency for different angel measure
model. Statistical based Monte Carlo method is
suitable for problems difficult to analytical method
(Shang and Yang, 2009), whose merits include
immune to system complexity and unrestricted by
probability distribution types (Liu and Zhao, 2013).
Although it can improve computational efficiency
under limited calculation counts(Zhang et al, 2010),
certain stochastic bias would always exit compared
to result of derivative propagation model, which
restricts its application on systems requiring high
precision measurement.
In actual testing process, there are many errors
influencing test results, such as theodolite precision
(Fang et al, 2013), tri-axial mechanical error in
machining and installation (Li and Wang, 2010),
shaft encoder error, human operation error, etc. So,
no matter in Monte Carlo simulation or in partial
derivative error propagation calculation, rational
error source choice is of vital importance.
Common used method in test scheme selection is
to choose an optimal specific station site (Zhang et
al, 2011). In actual testing process, when optimized
station distribution regions for different working
conditions of system under test are given out, we
just need to select station site on the public area. In
this way, frequent setting up of instruments is
avoided, which not only guarantees measure
precision, but also improves working efficiency.
In conclusion, a directional testing model of
space block for effective utilization of optical
equipment as theodolite would be studied in this
paper, which would give out the error influencing
model for making rational testing scheme, reducing
error influence and realizing high precision
measurement. Thus, pointing direction measurement
model of space block and corresponding error
propagation model are built, whose simulation
model are realized by object-oriented programming
language C++. The rationality of error propagation
model is demonstrated through simulation, which
provides some basis for further research.
2 DOUBLE-THEODOLITES
BASED MEASURING METHOD
Directional testing of space block is basically
angular variation measurement of a spacial line
segment between start and stop position, which can
be classified into contact and non-contact types.
Contact measurement can be realized through
turntable or installed high precision INS, and setting
up theodolite directly on space block can also be
used.
In order to solve the disadvantages in contact and
non-contact types of measurement, we take full
advantage of angle information from non-contact
double theodolites intersection measurement to build
angle calculation model without distance parameter.
In addition, the corresponding error propagation
model is studied, whose calculated results are used
to prove the feasibility and rationality of the built
model.
2.1 Angle Calculation Model
With known connection line of two theodolites and
pointing direction of standard base line, directional
information of space block can be obtained from its
azimuth and elevation angles relative to base line of
theodolites. As shown in Figure 1, theodolite 1
should measure azimuth angles
1
,
2
and elevation
angles
1
,
2
on maker points a, b. While theodolite
2 should measure azimuth angles
1
,
2
on maker
points a, b. Thus, the calculation model can be
described as follows: model inputs include
theodolites measured angles
1
,
2
,
1
,
2
,
1
,
2
on maker points, while model outputs include
azimuth angle
and elevation angle
of space
block to theodolites base line.
Figure 1: Schematic diagram of azimuth and elevation
angle calculation.
Calculation model:
1
y =
1122
tantantantan
2
y =
2211
tantantantan
3
y =
2121
tantantantan
a
=
)arctan(
3
21
y
yy
(1)
1
x =
1122
sintansin
2
x =
2211
sintansin
3
x =
22
2
1
2
sinsin
SIMULTECH2015-5thInternationalConferenceonSimulationandModelingMethodologies,Technologiesand
Applications
462

4
x =
11
2
2
2
sinsin
5
x =
2121
cossinsin2
6
x =
2211
sinsin
= )arctan(
6543
21
xxxx
xx
(2)
Where a denotes Azimuth angle of space block.
denotes elevation angle of space block.
2.2 Calculation Model Validation
Pointing direction of vehicle-mounted space block is
measured and calculated with this method, where
some vehicle takes on INS. Comparing the
calculated azimuth and elevation angles with those
given by direction-finding system (as shown in
Table 1 and Table 2), we can see that the calculation
results meet the requirement, which indicates the
rationality of the built angel measure model.
Table 1: Comparison of azimuth angles from calculation
model and direction-finding system.
No.
X1
(mrad)
X2
(mrad)
error
(mrad)
1 5782.353
5782 0.353
2
5332.291 5332 0.291
3
232.468 232 0.468
4
232.587 232 0.587
In Table 1, X1 is calculated azimuth pointing direction of
space block. X2 is pointing direction of vehicle-mounted
direction-finding system.
Table 2: Comparison of elevation angles from calculation
model and direction-finding system.
No.
X3
(mrad)
X4
(mrad)
error
(mrad)
1 890.707
890 0.707
2
890.674 890 0.674
3
750.024 750 0.024
4
890.022 890 0.022
In Table 2, X3 is calculated elevation pointing
direction of space block. X4 is pointing direction of
vehicle-mounted direction-finding system.
3 ERROR PROPAGATION
CALCULATION MODEL
Thus, we establish the angel measure model and
corresponding measuring method for pointing
direction of space block based on non-contact type
of method with double-theodolites, which is mainly
used in pointing direction testing of space block with
complex carrier platform. In actual testing process,
system software control precision and hardware
factors as carrier motion state, atmospheric
environment, electromagnetic environment, servo
system precision of carrier platform, sensor
accuracy, backlash, base-ring deformation influence
measurement precision for pointing direction of
space block. Meanwhile, influences of theodolite
error and pointing error on measurement precision
are not negligible. All the influencing factors are
displayed through space block pointing direction
error of measurement calculation model.
Determining the induced error of different
influencing factors on pointing direction of space
block is an important problem for precision
measurement of pointing direction, which also plays
an important role in subsequent research on optimal
station distribution. As to optimizing of station
distribution scheme, optimum seeking of a specific
station site is a common used method. By now, no
literature has been found on how to get a feasible
station distribution region with satisfied precision
according to error distribution range.
On above-mentioned conditions, corresponding
angel measure model is built first in this paper.
Then, relevant error model is studied on its
scientificity and rationality in simulation, which lays
a solid foundation for subsequent study on error
distribution range, Thus, it provides good pre-study
for choosing a big enough station distribution area
under required precision.
3.1 Random Error Propagation
Calculation of Azimuth Angle
In equation (1), let
Y
X
A
tan .
Where X is numerator, Y is denominator.
Taking partial derivatives, the results are shown
in the following:
22
2212
121
2
1
1
tantantantan
tantansec
YA
ErrorModelingandSimulationforDirectionalTestingofSpaceBlock
463

22
1121
212
2
2
1
tantantantan
tantansec
YA
22
2221
211
2
1
1
tantantantan
tantansec
YA
22
1112
122
2
2
1
tantantantan
tantansec
YA
2
1
1
2
2
2
2
1
3
2
2
4
Substituting above results into error propagation
expression, we get equation (3).
2
4
2
3
2
2
2
1
2121
(3)
Where, 0.0116 mrad are taken for
1
,
2
,
1
,
2
.
Where
denotes azimuth error calculated by
partial derivative model.
3.2 Random Error Propagation
Calculation of Elevation Angle
In equation (2), let
Y
X
A
tan
Where X is numerator, Y is denominator.
Taking partial derivatives, the results are shown
in the following:
]2sinsin
2cossinsinsin2
costansin2[
12
1
112
2
2112221
1122
32
1
X
X
Y
YA
]2sinsin
2cossinsinsin2
costansin2[
12
1
221
2
1221121
2211
32
2
X
X
Y
YA
]sintancos2
2sincossinsin2
sin2sinsin2sin
costansin2[
12
1
2211
1121222
2
2
1122
2
1
1122
32
1
Y
X
Y
YA
]costansin2
2sincossinsin2
2sinsin2sinsin
sintancos2[
12
1
2211
2221111
211
2
221
2
1122
32
2
Y
X
Y
YA
YA
2
2211
2
1
1
sinsinsec
YA
2
1122
2
2
1
sinsinsec
2
1
1
2
2
2
2
1
3
2
2
4
2
1
5
2
2
6
Substituting above results into error propagation
expression, we get equation (4).
2
5
2
5
2
4
2
3
2
2
2
1
212121
(4)
Where, 0.0116 mrad are taken for
1
,
2
,
1
,
2
,
1
,
2
.
Where
denotes elevation error calculated by
partial derivative model;
4 MONTE CARLO SIMULATION
Partial derivative based error propagation model
describes the error transmission in calculation
model, which causes influence on model outputs by
computing process. It takes on concise form, and
theoretically should be the expected value after an
infinite number of actual testing. So, it is impractical
to validate the error propagation model through
limited actual measurements. Besides, the
SIMULTECH2015-5thInternationalConferenceonSimulationandModelingMethodologies,Technologiesand
Applications
464
calculation model takes on 6 input variables, whose
combination modes are extremely complicated in
actual working process. Therefore, model validation
is very difficult. In this paper, we use Monte Carlo
method to validate the rationality and scientificity of
error propagation model. It takes on wide
universality and uses direct simulation, which is
very suitable for problem difficult to analytical
method.
4.1 Working Steps of Monte Carlo
Method
The working steps of Monte Carlo are following:
(1) Simulating sufficient large size of normal
distributed observed value of theodolite.
(2) Substituting the simulated data into pointing
direction calculation model of space block to get the
corresponding elevation and azimuth angles,
calculating the statistical results of azimuth
propagation error and elevation propagation error.
(3) Validating error propagation calculation
model.
4.2 Analysis of Model Input Error
Many error sources influence measurement
calculation results in this method. For example,
common used electronic theodolite in actual testing
has many errors influencing test results, such as
mechanical errors in machining and installation of
vertical axis, pitch axis, and optical axis, shaft
encoder error, human operation error, etc. Generally,
precision of measurement results is mainly
determined by theodolite accuracy.
Therefore, error sources having major influence
on model input and general character are selected,
such as angel measure error of theodolite, centering
alignment error and sighting error.
Table 3: Error sources and their distribution law.
No.
Error source Distribution law Standard
deviation
1
1
Normal
distribution
2.5"
2
2
Normal
distribution
2.5"
3
1
Normal
distribution
2.5"
4
2
Normal
distribution
2.5"
5
1
Normal
distribution
2.5"
6
2
Normal
distribution
2.5"
Generally, angel measure error of theodolite is
2", centering alignment error and sighting error is
1.5", whose composite error is shown in the
following expression.
=
22
5.12
=2.5"
Model inputs are constructed according to above
distribution law and statistic character of error
source. Then calculation model (1), (2) are used to
carry out Monte Carlo simulations from 1 to 780.
So, statistical calculation for propagated error of
azimuth and elevation angles can be obtained
serially. Under same calculation conditions,
propagated error of azimuth and elevation angles can
also be calculated from the built error propagation
model. Thus, we can make a comparison for two
calculation results.
Calculation example 1: vertical distance of
theodolites is 3m, with 4m lateral deviation to the
right, the calculating results for propagated error of
azimuth and elevation angles when Monte Carlo
simulation runs up to 780 times.
Table 4: Calculating results of calculation example 1.
Model 1 Model 2
1 10 50 100 500 780
0.023 0.019 0.02 0.025 0.023 0.024
0.044 0.065 0.039 0.045 0.043 0.044
Calculation example 2: vertical distance of
theodolites is 3 m, with 4 m lateral deviation to the
left, the calculating results for propagated error of
azimuth and elevation angles when Monte Carlo
simulation runs up to 780 times. The first line is
elevation angle calculation results, the second line is
azimuth angle calculation results, and both units are
mrad.
Table 5: Calculating results of calculation example 2.
Model 1 Model 2
1 10 50 100 500 780
0.025 0.024 0.028 0.024 0.024 0.025
0.031 0.022 0.035 0.029 0.032 0.032
In Table 4 and Table 5, Model 1 is partial derivative
based error propagation model.
Model 2 is Monte
Carlo model. The second line is counts of
calculation. The third line is elevation angle
calculation results, the fourth line is azimuth angle
calculation results, and both units are mrad. It can be
seen from Table 4 and Table 5 that with the increase
ErrorModelingandSimulationforDirectionalTestingofSpaceBlock
465
of Monte Carlo simulation times, the calculated
propagated error approaches the result of partial
derivative based error propagation model. Some
results are in accordance with those of partial
derivative based error propagation model, while
some show certain fluctuation. As in Table 4,
propagated error of elevation angles with 780 times
simulation is 0.024, yet partial derivative based error
propagation model gives 0.023. Namely, there exists
minor difference. In the following, we proceed with
credibility analysis of above-mentioned two models,
and proving the rationality of partial derivative
based error prorogation calculation model.
5 RESULTS CALCULATION AND
ANALYSIS OF TWO MODELS
Since it is inefficient and impractical to validate the
rationality of partial derivative based error
propagation model with large numbers of actual test,
Monte Carlo model for error propagation is built.
According to statistical property of Monte Carlo
method, high credible results can be obtained with
large enough size of simulation tests. That is, its
consistency to partial derivative based error
propagation model can be checked by certain
numbers of Monte Carlo simulations. So, the
rationality of partial derivative based error
propagation model can be validated. Thus, the
problem is summarized into consistency check for
calculation results of Monte Carlo model and partial
derivative based error propagation model under
certain confidence level, where they belong to same
population with unknown mean and variance.
5.1 Chi-square Test for Two Error
Propagation Models
Suppose X
1
, X
2
, ... X
i
represent actual measured
values or calculated values in Monte Carlo
simulation. X denotes samples following normal
distribution N(μ, σ
2
),
X
and
2
S
are sample mean and
variance respectively, construct following statistics.
2
=
2
2
)1(
Sn
2
2
)1(
Sn
~
)1(
2
n
Where
a
S denotes propagation error calculated by
Monte Carlo simulation.
denotes propagated
azimuth error calculated by partial derivative based
error propagation model. Then the problem can be
describes as follows: for a given confidence level 1-
α, rejection region W:
2
2
2
a
or
2
2
2
1
a
Hypothesis testing H: whether
=
Namely
)(
2
2
1
22
2
2
aa
P
=a
Where
denotes propagated azimuth error
calculated by error propagation model.
denotes
overall propagation error calculated by simulation
samples (i.e. standard deviation of population).
Hypothesis testing for elevation propagation
error can be carried out according to that of azimuth
angle. Chi-square tests for propagated error of
azimuth and elevation angles in calculation example
1 are realized according to methods introduced
above. With a given confidence level 1-α = 0.99,
statistics and its rejection region are calculated from
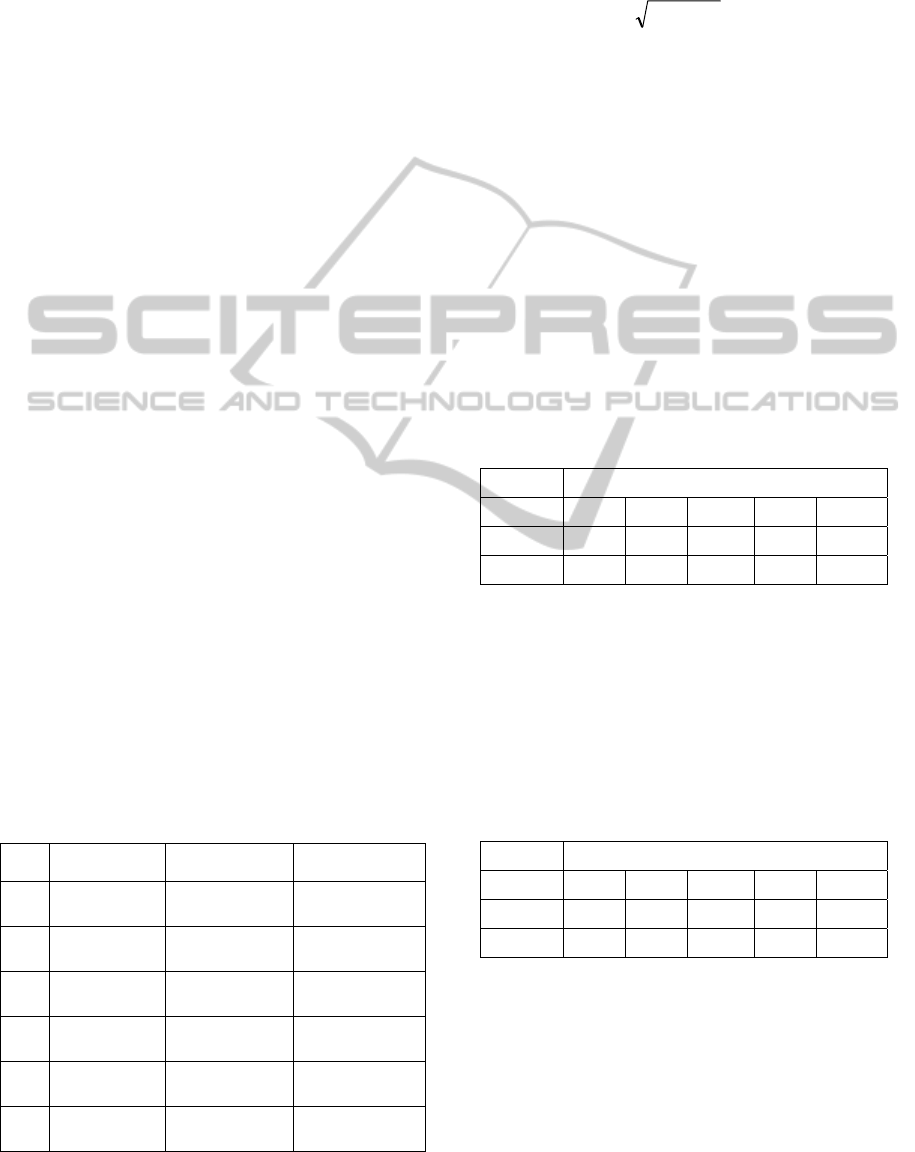
simulation counts 2 to 781. Sequences L1 and L3 in
Figure 2 and Figure 3 are curves corresponding to
simulation counts, where rejection region lies above
L1 and below L3.
0
100
200
300
400
500
600
700
800
0 100 200 300 400 500 600 700 800
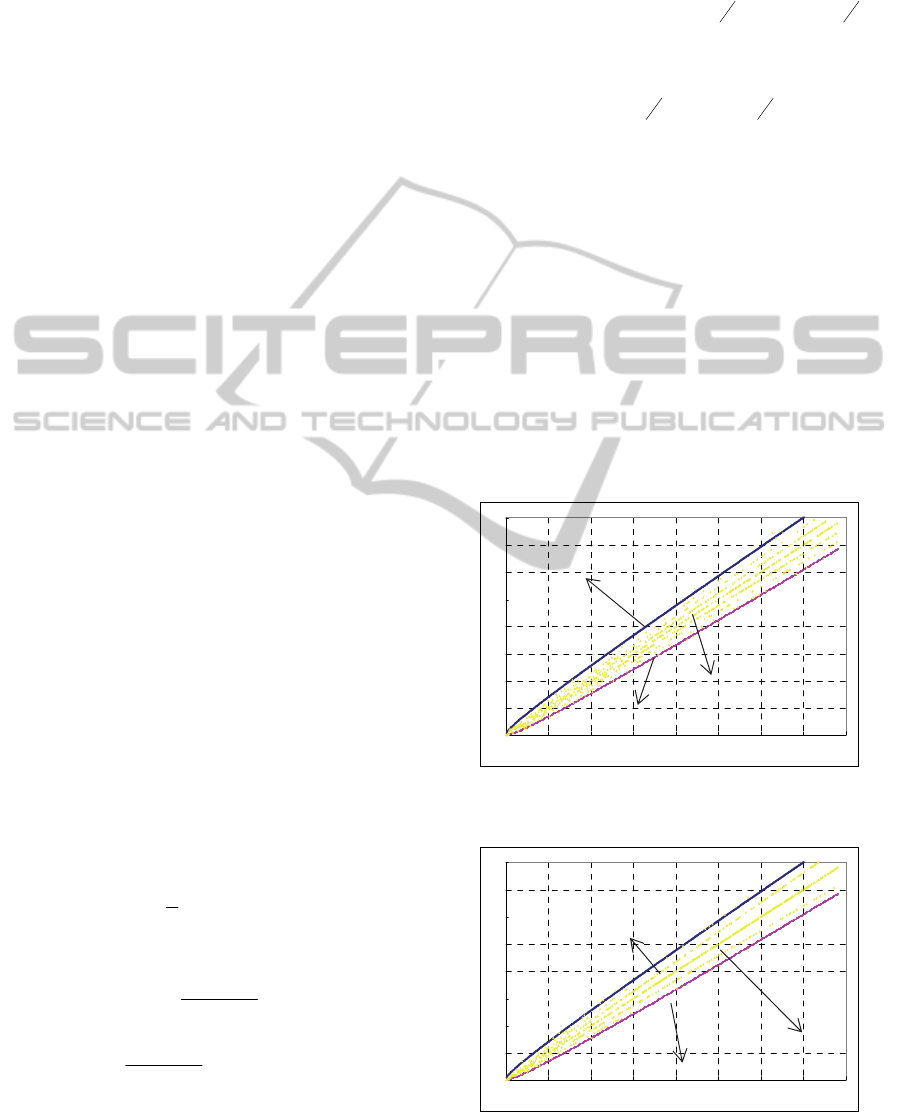
Figure 2: Chi-square test results for propagated error of
simulated azimuth angle under confidence level 99%.
0
100
200
300
400
500
600
700
800
0 100 200 300 400 500 600 700 800
Figure 3: Chi-square test results for propagated error of
simulated elevation angle under confidence level 99%.
L2
L3
L1
L2
L3
L1
SIMULTECH2015-5thInternationalConferenceonSimulationandModelingMethodologies,Technologiesand
Applications
466
Chi-square test statistics and rejection region
under confidence level 99% are shown in Figure 2
and Figure 3, where horizontal axis represents
simulation counts, and vertical axis represents value
of Chi-square statistics. Sequence L2 is Chi-square
statistics under test, L1 and L3 are boundaries of
rejection region, as shown in Figure 2 and Figure 3.
L2 lies between L1 and L3, namely outside rejection
region, so we can take
=
. The same results can
be obtained for propagated error of simulated
elevation angle.
5.2 Propagated Error Variation Range
Analysis of Two Models
According to above-mentioned results,
2
2
(1)nS
~
2
(1)n
can be obtained from
2
2
(1)nS
~
2
(1)n
and
=
.
As to confidence level 1-α = 0.99,
))1(
)1(
)1((
2
2
1
2
2
2
2
n
Sn
nP
aa
=1-a=0.99
Namely
)
1
))1(
1
)1(
(
22
2
1
2
22
2
n
n
S
n
n
P
aa
=0.99
Thus, we can get the confidence interval of
a
S
under confidence level 1-α = 0.99:
)1(
)1(
)1(
)1(
22
2
1
2
2
n
n
n
n
aa
Table 6: Calculating results of calculation example 3.
Project
name
Monte Carlo simulation (counts)
10 50 100 500 780
Azimuth lower
limit
0.009 0.024 0.029 0.037 0.038
Azimuth upper
limit
0.110 0.069 0.061 0.051 0.049
Elevation lower
limit
0.003 0.126 0.015 0.019 0.020
Elevation upper
limit
0.066 0.037 0.032 0.027 0.026
Calculation example 3, given 1-α = 0.99, confidence
interval to different simulation counts are calculated
for calculation example 1 according to above
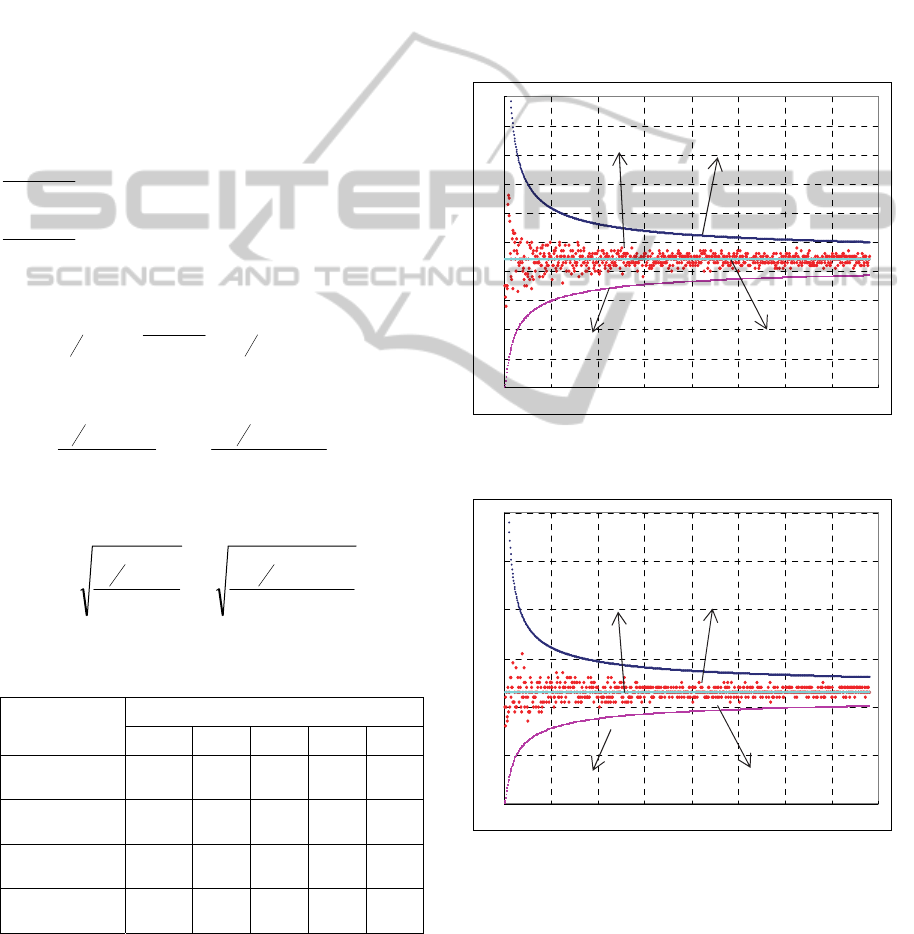
method, whose results are shown in Figure 4 and
Figure 5.
The calculation result unit of Table 6 is mrad.
According to confidence intervals of azimuth and
elevation angles for calculation example 1 under
different simulation counts given in Table 6, we can
see that the calculated propagation error by Monte
Carlo simulation in Table 4 lie in confidence
interval.
In Figure 4 and Figure 5, horizontal coordinates
denote simulation counts, vertical coordinates
denote propagated error (expressed with mean
square error), upper curve (sequence L1) and lower
0
0.01
0.02
0.03
0.04
0.05
0.06
0.07
0.08
0.09
0.1
0 100 200 300 400 500 600 700 800
Figure 4: Simulation results comparison for propagated
error of azimuth angle under confidence level 99%.
0
0.01
0.02
0.03
0.04
0.05
0.06
0 100 200 300 400 500 600 700 800
Figure 5: Chi-square test results for propagated error of
simulated elevation angle under confidence level 99%.
curve (sequence L3) are boundaries of confidence
interval, middle line (sequence L4) is result
calculated by partial derivative based error
propagation model, scatter diagram (sequence L2) is
propagation error corresponding to different
L1
L2
L3
L4
L1
L2
L3
L4
ErrorModelingandSimulationforDirectionalTestingofSpaceBlock
467

simulation counts.
Propagated error of azimuth and elevation angle
from Monte Carlo simulation and partial derivative
based model are shown in Figure 4 and Figure 5,
where boundary changes for calculation results of
Monte Carlo simulation are also given out. The
following conclusions can easily be drawn from
Figures: the calculated propagation error from
Monte Carlo simulation will tend to that of partial
derivative based error propagation model as
simulation counts increase; the calculated
propagation error from Monte Carlo simulation
always lie in confidence interval; values in
confidence interval tend to those calculated by
partial derivative based error propagation model
with increment of simulation counts. Obviously, the
calculated values from Monte Carlo simulation and
partial derivative based model take on consistency.
AS uncertainties always exist in Monte Carlo
simulation, and high precision system requires both
accuracy and consistency for calculation results. So,
the more simulation counts, the better calculation
results we can obtain from Monte Carlo method.
Above Figures show that under confidence level
99%, confidence interval gets short with increase of
simulation counts. That is upper and lower
boundaries of propagation error from Monte Carlo
simulation converge to partial derivative based
calculation value, which further demonstrates the
rationality and credibility of the built partial
derivative based error propagation model.
6 CONCLUSIONS
Although Monte Carlo method takes on good
operation, its calculation results have some
uncertainty. While precision requirement of system
under test is high, we need a propagated error
calculation result with good consistency and high
precision. So, thousands of simulating calculation is
impracticable. The partial derivative based error
propagation model built in this paper improves
computational efficiency under required error
propagation precision, whose rationality is validated
by Monte Carlo simulation.
In this paper, we studied a double-theodolites
based non-contact pointing direction measuring and
calculation method of space block, and built a partial
derivative based error propagation model. Also,
Monte Carlo statistical test method is used in error
propagation modelling, which also validates the
rationality of the established partial derivative based
error propagation model. The results show that the
partial derivative based model takes on high
credibility, which provides basis for further research
on calculated pointing direction error distribution of
space block. Thus, it can be used in high precision
directional testing of space block.
REFERENCES
Fang, A. G., Xu, R., and Zhang, J. P. (2013). The
comparison study on several survey method of rocket
launcher’s adjustment accuracy. Chinese Journal of
Gun Launch & Control, (9), 76-78.
Liu, Q. W., and Zhao, P. L. (2013). An analysis method of
system mission reliability based on Monte Carlo
method. Electronic Product Reliability and
Environmental Testing, 31(5), 17-22.
Li, P., and Wang, Y. (2010). Gun slaving accuracy
measurement unit based on digital theodolite detect.
Fire Control and Command Control, 35(s8), 96-98.
Shi, F. (2014). A static accuracy measurement of servo
system based on double theodolites. Shanxi Electronic
Technology, (4), 23-25+43.
Shang, L. Y., and Yang, S. (2009). Research on the
guidance precision distribution method based on the
variance analysis. Flight Dynamics, 27(3), 93-96.
Zeng, K., and Lai, W. J. (2011). Gun slaving precision
detecting system of double-theodolites. Ordnance
Industry Automation, (7), 73-75.
Zeng, K., Lai, W. J., and Lei, Y. N. (2013). Gun slaving
accuracy measurement system based on total station
apparatus. Journal of Sichuan Ordnance, 34(4), 18-28.
Zhang, G., Zhang, Y. T., Ren, G. Q., and Wang, M. Q.
(2010). Precision assessment for gun aiming check
system based on Monte-Carlo method. Journal of
Academy of Armored Force Engineering, 24(3), 41-44.
Zhang, G., Ren, G. Q., Zhang, Y. T., Fu, J. P., Gao, B.,
and Chen, H. C. (2011). Research on optimizing
disposition method of double theodolites in gun
rotated pricision detection. Fire Control and
Command Control, 36(9), 176-179.
SIMULTECH2015-5thInternationalConferenceonSimulationandModelingMethodologies,Technologiesand
Applications
468
