
From Static to Agile - Interactive Particle Physics Analysis in the SAP
HANA DB
David Kernert
1
, Norman May
1
, Michael Hladik
1
, Klaus Werner
2
and Wolfgang Lehner
3
1
SAP SE, Dietmar-Hopp-Allee 16, 69190 Walldorf, Germany
2
Universit
´
e de Nantes, D
´
epartement de Physique, Nantes, France
3
Technische Universit
¨
at Dresden, Database Technology Group, Germany
Keywords:
In-memory Databases, Scientific Applications.
Abstract:
In order to confirm their theoretical assumptions, physicists employ Monte-Carlo generators to produce millions
of simulated particle collision events and compare them with the results of the detector experiments. The
traditional, static analysis workflow of physicists involves creating and compiling a C++ program for each
study, and loading large data files for every run of their program. To make this process more interactive and
agile, we created an application that loads the data into the relational in-memory column store DBMS SAP
HANA, exposes raw particle data as database views and offers an interactive web interface to explore this data.
We expressed common particle physics analysis algorithms using SQL queries to benefit from the inherent
scalability and parallelization of the DBMS. In this paper we compare the two approaches, i.e. manual analysis
with C++ programs and interactive analysis with SAP HANA. We demonstrate the tuning of the physical
database schema and the SQL queries used for the application. Moreover, we show the web-based interface that
allows for interactive analysis of the simulation data generated by the EPOS Monte-Carlo generator, which is
developed in conjunction with the ALICE experiment at the Large Hadron Collider (LHC), CERN.
1 INTRODUCTION
Researchers in the high energy particle physics com-
munity were one of the first who had to deal with the
impact of massive data deluge because their experi-
ments have produced petabytes of data per year since
the mid-2000s. For example, the Large Hadron Col-
lider (LHC) at the research center CERN in Geneva,
Switzerland, produced data at a rate of 15 PB per
year in 2009 (CERN, 2014). The sheer amount of
raw data together with the requirement for efficient
query processing techniques are among the reasons
why this domain has recently gained attention in the
database community (Ailamaki et al., 2010; Karpathio-
takis et al., 2014; Stonebraker et al., 2009).
To evaluate their theoretic models, particle physi-
cists compare the detector measurements with their ex-
pectations. Therefore, they use particle collision sim-
ulations, which consist of millions of particle events
generated by Monte-Carlo-based algorithms. In a first
step, the data produced by the event generators, such
as EPOS (Drescher et al., 2001), are stored in large
binary data files. In the following analysis step, the
simulation data are filtered, joined with metadata and
aggregated into distributions of certain physical ob-
servables. These distributions, which are commonly
represented as 2D-histograms, are then compared with
the actually observed distribution that is obtained from
the actual detector measurements.
The usual analysis workflow of particle physicists
involves writing C++ analysis scripts that are then com-
piled and run on many large data files (Karpathiotakis
et al., 2014). These programs use the open source
framework ROOT (Brun and Rademakers, 1997),
which includes the data format to write and read parti-
cle data in binary files, and contains methods to calcu-
late the physical observables, visualization tools, such
as histograms, and statistical methods to quantify the
accordance between simulation and measurement.
However, the requirement of rewriting and recom-
piling the C++ code, makes the common analysis a
rather static workflow (Fig. 1(a)). For example, every
time when a filter changes, the physicist usually has
to modify the C++ program, compile it, and run again.
Moreover, for each ad-hoc test on a smaller data subset,
the corresponding data files have to be loaded again,
in the worst case from hard disk.
A key requirement for an agile analysis is to get
16
Kernert D., May N., Hladik M., Werner K. and Lehner W..
From Static to Agile - Interactive Particle Physics Analysis in the SAP HANA DB.
DOI: 10.5220/0005503700160025
In Proceedings of 4th International Conference on Data Management Technologies and Applications (DATA-2015), pages 16-25
ISBN: 978-989-758-103-8
Copyright
c
2015 SCITEPRESS (Science and Technology Publications, Lda.)
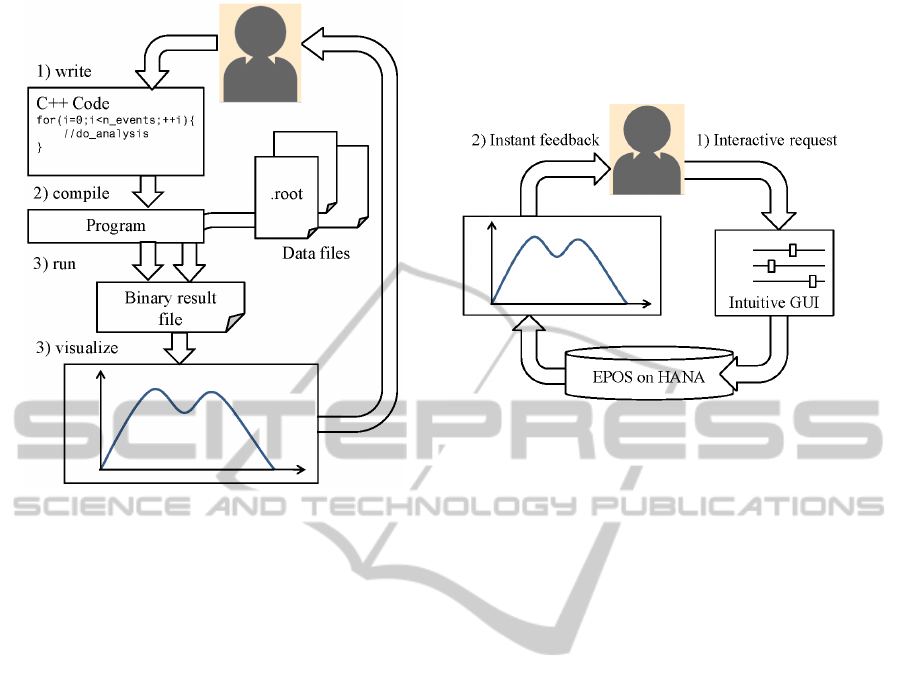
(a) The common static workflow using C++ programs
(b) The agile workflow with “EPOS on HANA”
Figure 1: From static to agile workflows in particle physics analysis by using an in-memory RDBMS.
instant feedback, since the scientists might want to
adjust the input parameters on the basis of the output
histogram. Our idea is to achieve a dynamic workflow
with immediate responses, without being penalized
by long waiting times when parameters are altered
(Fig. 1(b)). Being able to quickly adapt query parame-
ters together with low response times is an important
optimization goal in the context of online analytical
processing (OLAP) in relational business database sys-
tems. Many of the typical particle analysis algorithms
consist of a mix of expression evaluations, filters and
aggregations – operations that are highly optimized in
recent RDBMS. However, databases today still rely on
simple heuristics to optimize expensive predicates or
aggregates because optimal solutions or expensive to
compute (Eich and Moerkotte, 2015; Neumann et al.,
2005).
In this paper we present the efficient integration
of state-of-the-art particle physics analysis algorithms
on a large data set in SAP HANA DB (F
¨
arber et al.,
2012), an in-memory column-store DBMS. We tackle
the issue of optimizing complex queries with expen-
sive expressions, predicates, aggregates and joins by
explicitly modelling the crucial aspects of the query
and leaving the easier optimization steps to the query
optimizer. In particular, the contributions are:
1.
We propose a natural mapping of particle data onto
a relational snowflake schema and show how state-
of-the-art particle physics analysis algorithms are
expressed in SQL.
2.
We describe the steps to tune our database schema
and the relational queries to achieve interactive
response times by using Analytical Views.
3.
We compare the query response times of the static
workflow based on C++ programs used today with
the modelled approach followed in our system. By
modelling the core parts of the queries exploiting
domain knowledge we achieve more than an order
of magnitude lower query response times. As a
consequence users can interactively adapt parame-
ters of the analysis which was not possible before.
4.
We present an intuitive graphical user interface
with a histogram display and easy-to-use filter bars.
2 DISMANTLING THE STATIC
WORKFLOW
As part of the application, we first describe the anal-
ysis scenario, and second how a typical particle data
analysis is implemented the conventional way using
custom C++ programs.
2.1 Application Description
At the LHC protons and heavy ions are accelerated in
a beam and steered to collide with each other at very
high energies. This way the physicists get information
about high energetic particle states and can validate
FromStatictoAgile-InteractiveParticlePhysicsAnalysisintheSAPHANADB
17

their theories, such as the existence of the Higgs Bo-
son. In collision experiments, physicists are generally
interested in measures that are derived from the mo-
menta
~p = (p
x
, p
y
, p
z
)
of the particles directly after
the collision, since they give hints about resonating
particle states.
In this work, we consider the analysis of two ob-
servables in high energy particle physics experiments
that are of particular interest: the observables trans-
verse (orthogonal to beam) momentum
p
T
and the
pseudorapidity
η
, which describes the angle of a parti-
cle relative to the beam axis. Both observables are de-
rived from the particle momentum components
p
x
,
p
y
,
and p
z
as follows:
1. Transverse Momentum:
p
T
=
q
p
2
x
+ p
2
y
(1)
2. Pseudorapidity:
η(p
x
, p
y
, p
z
) =
1
2
ln
q
p
2
x
+ p
2
y
+ p
2
z
+ p
z
q
p
2
x
+ p
2
y
+ p
2
z
− p
z
(2)
The distributions of the measured
p
T
and
η
ob-
servables are usually visualized with histograms that
display the number of particles
dN
per bin
d p
T
or
dη
for a configurable fine- or coarse-grained binning. The
graph plotted in our graphical user interface (Fig. 3)
gives an idea of the shape of the η distribution.
In addition, there are certain filter constraints of
interest, such as multiplicity classes which narrow the
amount of the considered data further down. How-
ever, we omit the details here and discuss them in
section 4.2.
2.2 Conventional Static Analysis
Workflow with Root
The conventional workflow of particle physics includes
writing custom C++ analysis programs and working
with binary files using the framework ROOT (Brun and
Rademakers, 1997). These static analysis programs
usually contain the following building blocks:
1. Prerequisites:
Each program usually starts with commands to load
one or multiple root data files. Moreover, data
buffers are created which will be filled by the file
interface for the data of interest. Depending on the
number of analyzed data files, file checks and the
number of addressed data attributes the prerequi-
sites easily account for ten to hundred lines of C++
code. A snippet of our running example is shown
below. In our full example this part requires 76
lines of code (LOC).
// ope n fil e and create ev e n t data buf f e r s
TFile *f = TFi l e :: Open ( f ile );
float px [1000 0 ] ;
...
// set tree pointer s to binary file
TTree * t h e a d = ( TTree *) f - > Get (" t e p oshead " );
TTree *t = ( TTree *) f - > Get (" t e poseve n t " );
t - > S e tBra n chAd d r ess ( " px " , & px );
...
2. Main Analysis:
The main component is effectively a loop over the
data of all particles, where each iteration may in-
clude the computation of physical observables and
filter criteria, e.g., thresholds for high energetic
particles.
// mai n loo p over events ( p a r ticle coll i s ions )
for ( int i = 0; i < nevents ; i ++) {
t - > GetE n t r y (i ); // sets all refere n c es
// loo p ove r pa r t i cles in event
for ( int j = 0; j < np ; j ++) {
// filter and calculat e o b serva b l es
if (! f i l t e r (px ,py ,pz , . . . ) ) c o n tinue ;
buf = calc u late O bse r vabl e (px ,py , pz );
// write into bu f f e r
...
}
}
The size of this code part heavily depends on the
kind of analysis. It can be as few as ten or as much
as hundred lines of code, depending on the anal-
ysis complexity (our – rather minimal – example
took 18 LOC). Note that in our example of the
pseudorapidity analysis, the inner event filter crite-
rion is based on pre-aggregated multiplicity classes,
which we discuss in section 4.2. Thus, the analysis
program requires two loops on the whole dataset,
which effectively bloats the script size further.
3. Generate Results and Visualization:
Since the C++ programs are run on command line,
there is no direct visualization of the computed re-
sults. Instead, the resulting plots are contained in
histogram container class objects, which are again
stored in binary result files. To visualize the result,
the scientists can then either open the file using the
graphical ROOT file browser, or print the histogram
canvas directly from within the C++ analysis pro-
gram into a pdf- or png-file.
// pos t p roces s and write into result file
...
TH1 D * et a _hist = new TH1D ( name , x_bins , y );
TFil e r e sult_ f i le ( ‘ ‘ results . r oot ’ ’, ’ ’ NEW ’ ’ );
// write into bi n a r y root file
eta_hist . Wri t e ( ‘‘ r esulth i s t ’ ’);
DATA2015-4thInternationalConferenceonDataManagementTechnologiesandApplications
18
In total, ROOT-based C++ analysis scripts consume
usually from hundreds up to several thousands lines of
code. Moreover, they contain a considerable amount of
redundant code components, such as the file and refer-
ence handling, and the implementation of the binning
and the custom aggregation. Also, the C++ programs
have to be maintained by users, which are often not
perfectly familiar with efficient C++ programming. In
particular, the ROOT framework is implemented with-
out multi-threading in mind. In particular, the library
functions are not thread-safe. Hence, tuning complex
analysis scripts is quite limited on modern multicore ar-
chitectures. These limitations of the ROOT framework
are one reason for the limited scalability observed in
our experimental validation.
The turnaround time for an analysis
1
on a local sys-
tem is constant for a given set of parameters. For every
change of the parameters (in our example: the multi-
plicity class configuration) the analysis has to be run
again, which includes parsing the data files repeatedly
and also performing redundant computations.
3 EPOS ON HANA
For ad-hoc analysis, scientists want to adjust analy-
sis parameters incrementally based on the previously
obtained results in a dynamic feedback loop, as im-
plied by Fig. 1(b). This is in contrast to the static
analysis workflow outlined in section 2 which involves
rewriting, recompiling and reloading data files. This
motivated us to implement a web-based application
– “EPOS on HANA” – which allows scientists to up-
load their experimental or simulation data for high
energy physics and compare the results in histograms
that are commonly used in the particle physics domain.
While our application is extensible for other kinds of
analysis tasks, we focused in this work on the
η
- and
p
T
-analysis. However, any other calculated measure
that are derived from the raw data can be implemented.
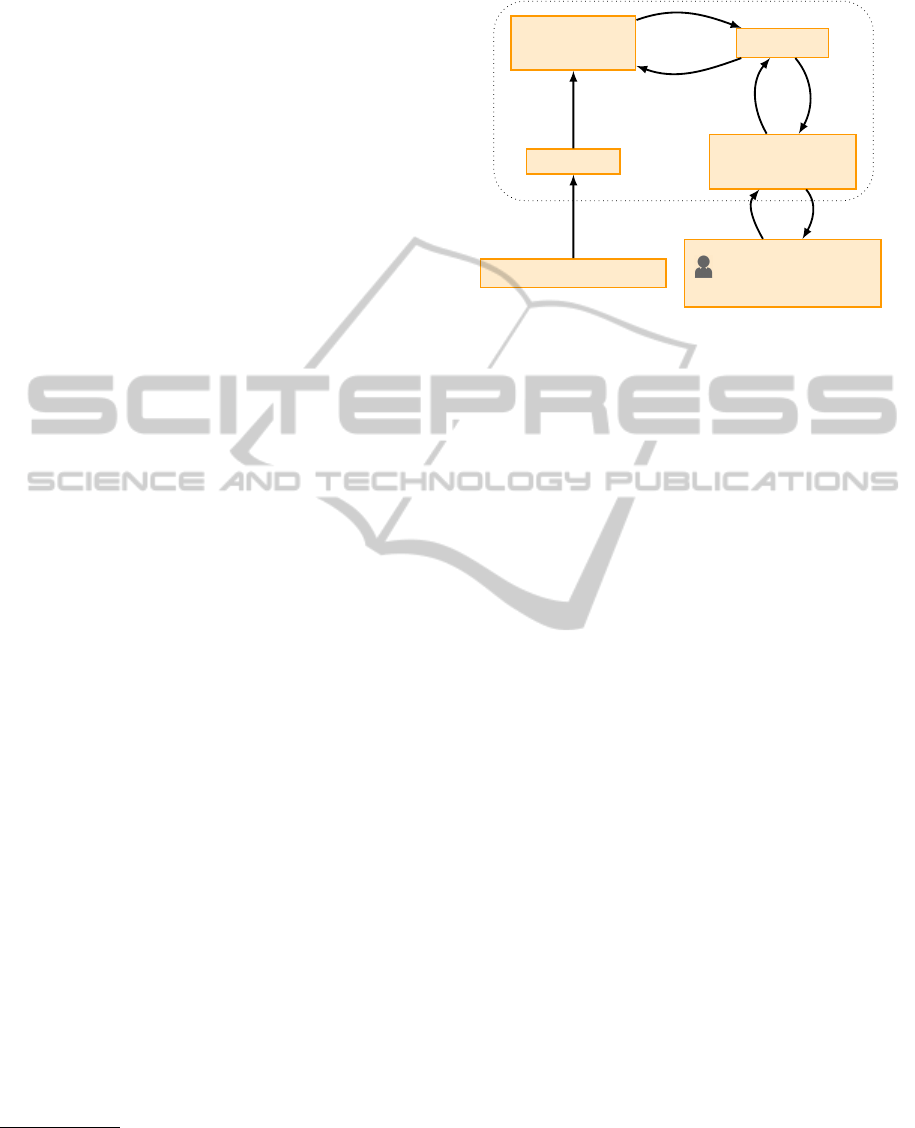
As the core part, we now discuss the architecture
of our application shown in Fig. 2 in detail. In the
remainder of this paper, we show how the incremental
workflow using our “EPOS on HANA” application can
speed up the time for testing a different set of parame-
ters by more than an order of magnitude compared to
the static workflow using C++ programs and ROOT.
1
In this paper, we only consider local analysis on local
data subsets which are in the order of gigabytes. For large
scale analysis with data sizes starting from several terabytes,
the CERN-associated research groups usually employ a com-
puting grid with turnover times of up to several days.
EPOS on HANA
CERN Data Repository
Bulkloader
SAP HANA
database engine
XS Engine
JS Client
SAPUI5 & D3.js
Users:
Researchers in
fundamental physics
1. fetch simulation
event data stored
in Root files
2. import
Root files
6. return
result set
5. execute SQL query
7. return JSON
4. call ODATA service
8. Render UI3. configure analysis
Figure 2: System Architecture of “EPOS on HANA”.
3.1 System Architecture and Workflow
The general architecture of our application is sketched
in Fig. 2. The graphical user interface is shown in
Fig. 3. In this section we explain each component in
detail. We also discuss each step that is performed
when using “EPOS on HANA”.
Data Generation.
In a first step, the Monte-Carlo
generated event data and the corresponding metadata
are stored in ROOT files. This is done by domain-
specific programs as discussed in Section 2 and not
part of our application. At the moment, generated and
experimental data are provided from a global CERN
data repository. However, part of our future considera-
tions is to integrate the Monte-Carlo data generation
to the database system.
Data Loading.
Next, this simulated event data is
loaded into column store tables of the SAP HANA
DB using a customized parallel bulk-loading tool. The
bulk-loader parses a set of Root files and performs
batched inserts into the database using the HANA
ODBC interface. This data usually remains unchanged
for subsequent analysis tasks in various studies, so the
data has to be loaded only once for multiple analyses.
Moreover, the UI offers the option to upload ex-
perimental data, i.e., data that has been measured with
the detectors at CERN and are publicity available as
a CSV-file, for example from the Durham HepData
Project (Durham University, 2014). The correspond-
ing experimental data curve can be displayed together
with the lines in the chart, providing a convenient way
of comparing the experiments with the Monte-Carlo
simulation. Theoretical physicists are eager to develop
the best simulation model for real high-energy physics
experiments. A central tool like “EPOS on HANA” is
FromStatictoAgile-InteractiveParticlePhysicsAnalysisintheSAPHANADB
19
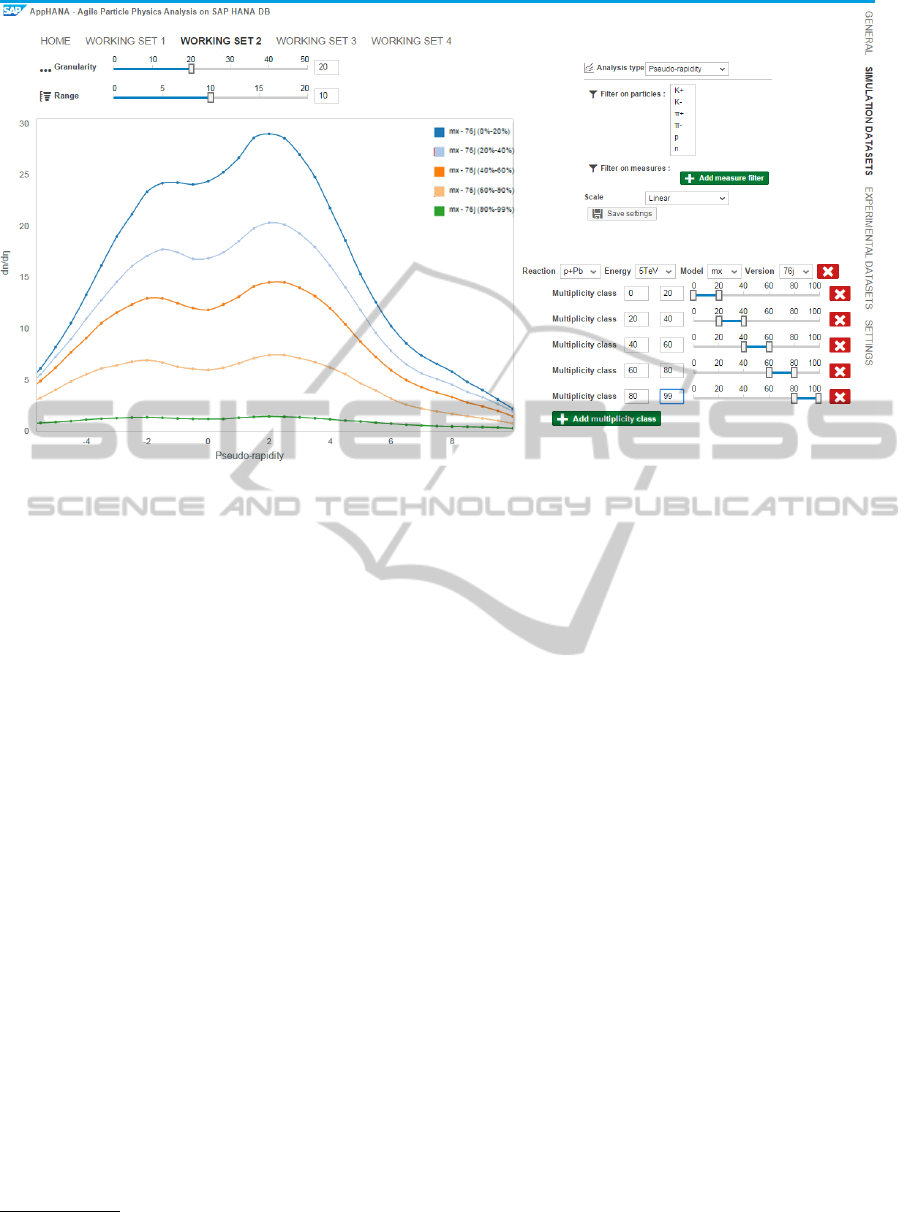
Figure 3: The EPOS on HANA GUI showing the pseudorapidity (η) curves for different multiplicity classes
expected to be very useful to be able to share simula-
tion and experimental data in a central platform and to
compare the quality of simulations to other simulations
or experimental data.
Interactive Querying.
In the third step a physicist
enters the web-based user interface of the “EPOS on
HANA” application, which is shown in Fig. 3, and
configures the analysis task. This includes choosing
simulation or experimental data sets used for the phys-
ical analysis. The interactive querying capability is the
main feature of our application. In the configuration
part, the scientists can define the general settings, such
as the analysis type (pseudorapidity
η
, or transverse
momentum
p
T
), and/or global filters on any physical
measure in the data set. Then, arbitrary multiplic-
ity classes
[α
i
,β
i
]
can be added to the panel. Each
multiplicity class corresponds to a line in the chart.
The display part on the left-hand side of Fig. 3 shows
the histogram, which is implemented with the D3.js
2
framework. Two control bars enable the user to dy-
namically change the granularity and the range of the
histogram.
The web-based interface is realized as a JavaScript
client-side application that uses the SAP UI5 li-
brary (May et al., 2014) for the basic widgets and
D3.js for the histograms.
Internal Update Request.
In the fourth step, after
the parameters for a diagram have been modified, the
2
A JavaScript library for manipulating documents based
on data. http://d3js.org
JavaScript client requests the updated data from the
server-side JavaScript application. This server-side
logic is delivered by the Extended Scripting (XS) en-
gine of the SAP HANA data platform. The data can
be accessed via an ODATA interface defined for the
main view used for this particular analysis.
Efficient SQL Execution.
The ODATA services im-
plemented in the XS engine transforms the ODATA
request into the corresponding SQL query. The SQL
query is executed by the high-performance in-memory
columnar engine of SAP HANA (F
¨
arber et al., 2012).
The main memory DBMS offers highly optimized ex-
ecution by using parallelized database operators for
aggregations, filters, joins, and others. Moreover, we
have tuned the physical schema of the database to
achieve interactive response times, even when access-
ing data for billions of particles. The tuning steps will
be described in more detail in the following section.
Return Feedback.
In step six, the query result is
returned to the ODATA service in the XS engine. This
service generates the corresponding JSON-response
which is sent back to the client-side JavaScript front
end. In the final step the client renders the diagrams
based on the received data.
As a result, any changes to either the multiplicity
classes or the general filters lead to a realtime recal-
culation and redrawing of the corresponding curves.
Just like physicists would do, the demonstration al-
lows users to dynamically adjust the data curves via
the intuitive control bars, and experience immediate
DATA2015-4thInternationalConferenceonDataManagementTechnologiesandApplications
20
feedback for their parameter configuration. This has
not been possible with the static workflow using C++
code.
Extensibility.
Although we are only presenting the
pseudorapidity/
p
T
-analysis in this application paper,
the framework can easily be extended by further anal-
ysis types. To add an additional analysis type, an anal-
ysis reference SQL query has to be implemented once
and linked to the ODATA request in the JavaScript
client source code, which is editable by the applica-
tion administrator. In the same way, existing analysis
queries can be manipulated until they suit the require-
ments of the scientists.
4 RELATIONAL
IMPLEMENTATION AND
TUNING STEPS
In this section, we describe step-by-step the relational
implementation of the analysis described in section 2.
The complete pseudorapidity analysis can be covered
by standard SQL commands provided in SAP HANA.
According to our notion, SQL is general enough to
express many typical queries of particle physics analy-
sis. However, if special functionality is required that
can not be expressed by the means of SQL, it could
potentially be integrated into user defined functions,
which however, is out of the scope of this paper.
Although an initial naive SQL implementation of
the pseudorapidity analysis according to the architec-
ture in Fig. 2 already reduced the response times by a
factor of about 4x, we applied additional tuning steps
to achieve a greater performance. Hence, the second
part of this paper is about the different variants of the
queries used in our performance evaluation. Below,
we first present the relational mapping, followed by an
incremental description of the steps we have taken to
improve performance by more than a factor of 40x.
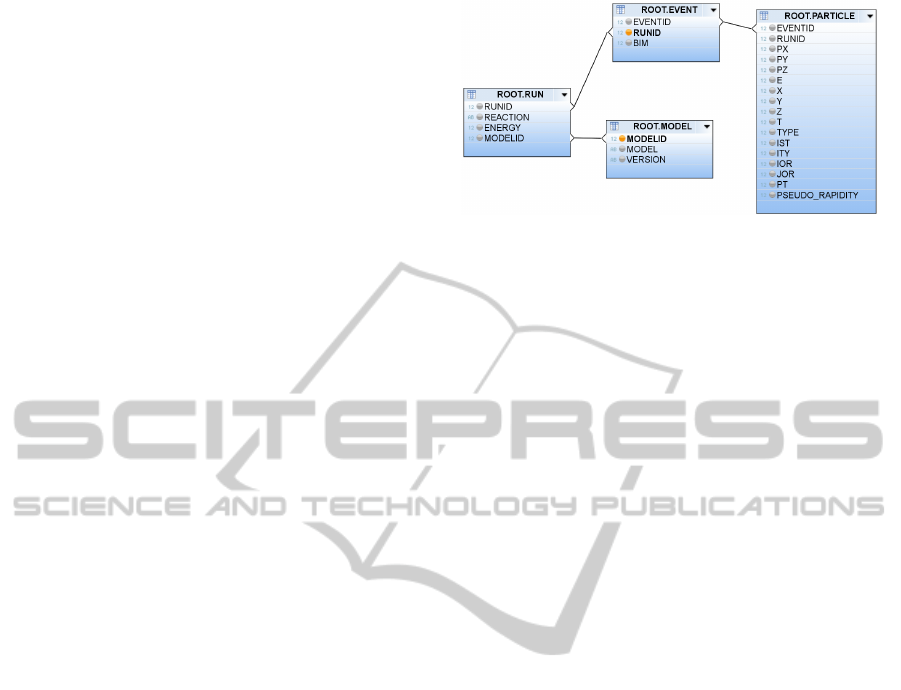
4.1 Relational Particle Schema
Fig. 4 shows the relational schema used to represent
the particle data structure for the simulation data.
At the highest level, experiments and simulations
can be separated into runs. In the context of the Monte-
Carlo generated data, each simulation run is labeled
with the reaction type, the center-of-mass energy of
the particle collision, and the theoretical model that
was used in the simulation. Runs are inserted into the
run
table. The simulation meta information, which
Figure 4: Table Schemes and the Join Paths of the
Multiplicity View.
includes the Monte-Carlo generator model and ver-
sion used for the corresponding run, are stored in the
separate table model.
Runs are made of ten-thousands of events which
form the next level in the hierarchy. An event repre-
sents a particle collision, each consisting of around
1000 tracked particles in our data set. Each event can
be assigned an impact parameter BIM which defines
how central the beams have collided. The events are
stored in the event table.
The last table in our hierarchy, the
particle
ta-
ble, stores the actual physical information of the mea-
surement. Each row refers to one particle which has
attributes that refer to its position (
x
,
y
,
z
) or its mo-
mentum (
p
x
,
p
y
,
p
z
), as well as further attributes that
describe its type, and others.
In terms of a data warehouse, the
particle
table
is the fact table, and the other tables are dimension
tables of a very simple snowflake schema.
Calculated Attributes.
Calculating the derived
physical observables, e.g.
p
T
(Equation 1) or
η
(Equa-
tion 2), with each query is usually expensive. In par-
ticular, the data is loaded once in batches, and after
that never changed again. However, the event data is
typically queried many times, and this motivates the
first tuning step: By creating
p
T
and
η
as a calcu-
lated attributes, the database system materializes
η
and
p
T
at insertion time. Thereby, we trade additional
memory consumption for the redundant data for faster
query response times because expensive expression
evaluation is avoided when retrieving the rows of the
particle
table. Moreover, we turn expensive expres-
sions into cheap ones which simplifies the task of the
query optimizer (Neumann et al., 2005).
4.2 The Analysis as SQL Query
The textual description for a single
η
(
p
T
) analysis
query is as follows:
FromStatictoAgile-InteractiveParticlePhysicsAnalysisintheSAPHANADB
21

For each
η
(
p
T
) bin of the histogram, return the
normalized number
¯
N
of the particles that have the
corresponding
η
(
p
T
) value and were produced in
events of a certain multiplicity class [α, β ].
Additionally, there can be multiple filter constrains
on the observables, such as a minimum value thresh-
olds on p
T
or a range filter on η (centrality filter).
The multiplicity refers to the number of particles
that were produced in one event, which is non-constant
and depends on the particular interactions that oc-
curred in the corresponding collision. As mentioned
in section 2, the physicists often want to narrow the
distributions down by separating the collision events
into several multiplicity classes to get insights on a
more fine-granular level. This part of the query is of
particular interest for the SQL implementation, since
it has a major influence on the execution runtime. In
general, a single pass over the data is required to de-
termine the multiplicity classes, before a second pass
can perform the actual aggregation of the calculated
measures.
We use the range
[α, β ]
,
0 ≤ α ≤ β ≤ 1
to denote
all events that are part of a certain multiplicity class.
To be more precise, assume the data set has a total of
N
events. Then, a multiplicity class with [α, β ] refers to
all events that have a multiplicity that is higher than the
N
L
= αN
events with the lowest multiplicity, but lower
than the
N
H
= βN
events with the highest multiplicity.
Listing 1: The η-analysis as SQL query.
select bin , sum ( eve n t_coun t .c ) AS hist01
fro m
( select eventid , count (*) as c
fro m particle , run , m o del
wher e r e a c tion = ? and energy = ?
and mode l = ? and vers i o n = ?
and run . mode l i d = mode l . modelid
and particl e . runi d = run . runid
and particl e . ps e u do_r a pidi t y > ?
and particl e . ps e u do_r a pidi t y < ?
grou p by eventid
orde r by c desc limit ? of f s e t ?
) as multiplicity , -- NESTED MULT I P LICIT Y
( select runid , event id , round ( p s eudo r a pidi t y )
as bin , count (*) as c from p a r t i cle
wher e ( px != 0 or py != 0 )
grou p by runid , eventid , round ( p s eudo r a pidi t y )
) as event _ count -- NESTED EVENT _ C OUNT
where abs (bin ) < 20
and mul t i plic i t y . even t i d = eve n t _coun t . eventid
group by bin order by bin
The SQL query in Listing 1 implements the analy-
sis; outer parameters are denoted by the “
?
”-symbol.
The expression contains two nested queries: The
first nested query determines which events are con-
forming to the filter constraints on the reaction type
and the definition of the used Monte-Carlo model.
Moreover, it selects only events that belong to the
given multiplicity class
[α, β ]
– by applying the
limit <ncount> offset <nmin>
command on the
ordered result list of event multiplicities. The corre-
sponding parameters are derived from the multiplicity
class delimiters as follows:
ncount = (β − α)N
and
nmin = αN
, where
N
denotes the number of events,
which is pre-calculated using the event table.
The resulting events (identified by
eventid
) are
then joined with the second nested query which per-
forms the histogram binning by aggregating the large
particle
table per bin and per event. The condition
px != 0 or py != 0
is required to avoid division
by zero in Eqn. 2. Finally, the top-level aggregation
sums up the events in all bins to create the result his-
togram. Note that as pointed out in section 2, it is
impossible to perform the whole query with a single
pass over the data.
Nevertheless, the prepared SQL statement in List-
ing 1 is yet simplified, since it only contains a single
histogram query. For multiple histograms (i.e., mul-
tiple lines in Fig. 3) we construct a composite query
using unions of the two nested queries with parame-
ters specific for the diagram line. Moreover, we used
the calculated attribute
pseudorapidity
, instead of
calculating
η
by means of SQL expressions. We will
use this query – but with the explicit computation of
the pseudorapidity attribute – as the base line for the
naive SQL-based approach in our evaluation.
4.3 Analytical Views
HANA offers a number of modeling capabilities to
tune the execution of complex queries like the one pre-
sented in Listing 1. In a business context, this allows
application developers to precisely define business se-
mantics of queries, for example by encapsulating logi-
cal query units into views. However, these capabilities
can also be used to tune the execution of complex
queries, and this will be the focus in the remainder of
this section. Analytic views are used in a conventional
business warehouse environment to model OLAP data
that includes measures. For example, a transactional
fact table representing the sales order history would
include measures for the quantity and the price. In
our scenario, the measures are the calculated columns
η
and
p
T
, respectively. We use two analytical views
to model the
η
analysis query in a calculation sce-
nario (Große et al., 2011), which are related to the
two nested queries as indicated by the comments in
Listing 1.
The
CV_MULTIPLICITY
is used to obtain an or-
DATA2015-4thInternationalConferenceonDataManagementTechnologiesandApplications
22
Listing 2: The η-analysis using analytical views.
select bin , sum ( eve n t_coun t .c ) as hist01
fro m CV_EVENT_CO U N T ,
( select eventid , count (*) as c
fro m CV _ MULT I P LICI T Y
limit ? offset ?
) as mult i p licit y
where abs ( bin ) < 20
and mul t i plic i t y . even t i d =
CV_E V ENT_ C O UNT . eventid
group by bin order by bin
dered list of the event multiplicities, ordered by the
event ID (
eventid
). It joins the
particle
table with
the dimensional attributes (Fig. 4) and counts all parti-
cles that conform the optional filter constraints on
η
and/or p
T
.
The
CV_EVENT_COUNT event count
view con-
tains the first stage of the histogram aggregation that
counts the particles grouped by the bins of the physical
observables and the event IDs.
The resulting analysis query, shown in List-
ing 2, selects the matching event IDs from the
CV_MULTIPLICITY
view according to the parame-
ters for the multiplicity range
[α, β ]
, by using again
the
limit
and
offset
commands as described be-
fore. The event IDs are then joined with the
CV_EVENT_COUNT
view, followed by the final aggre-
gation, which creates the histogram by grouping the
normalized number by the observable of interest,
η
or
p
T
.
Modeller.
We modelled the final query execution
plan using the graphical plan analysis tool available
for the SAP HANA database. The modeller allows
the application developer to exploit domain-specific
knowledge, and thus it is possible to realize optimiza-
tions that cannot be derived by query optimizers today,
e.g. deriving common sub-expressions or utilizing
specific database operators. This part of “EPOS ON
HANA” is of practical interest beyond our application,
since some of the techniques used by us are also em-
ployed in other web-based applications on the SAP
HANA DB (SAP Fiori, 2014).
Result Cache.
Since some of the filters, such as the
global
p
T
threshold, do usually not change during the
analysis, it is not necessary to recalculate intermediate
results all the time. In particular, this applies to the
analytical views described above. Therefore, SAP
HANA DB uses a result cache for analytical views.
If the respective view query is time consuming, and
the view size is comparatively small, the result cache
buffers the view and enables a fast execution of the
adjacent queries.
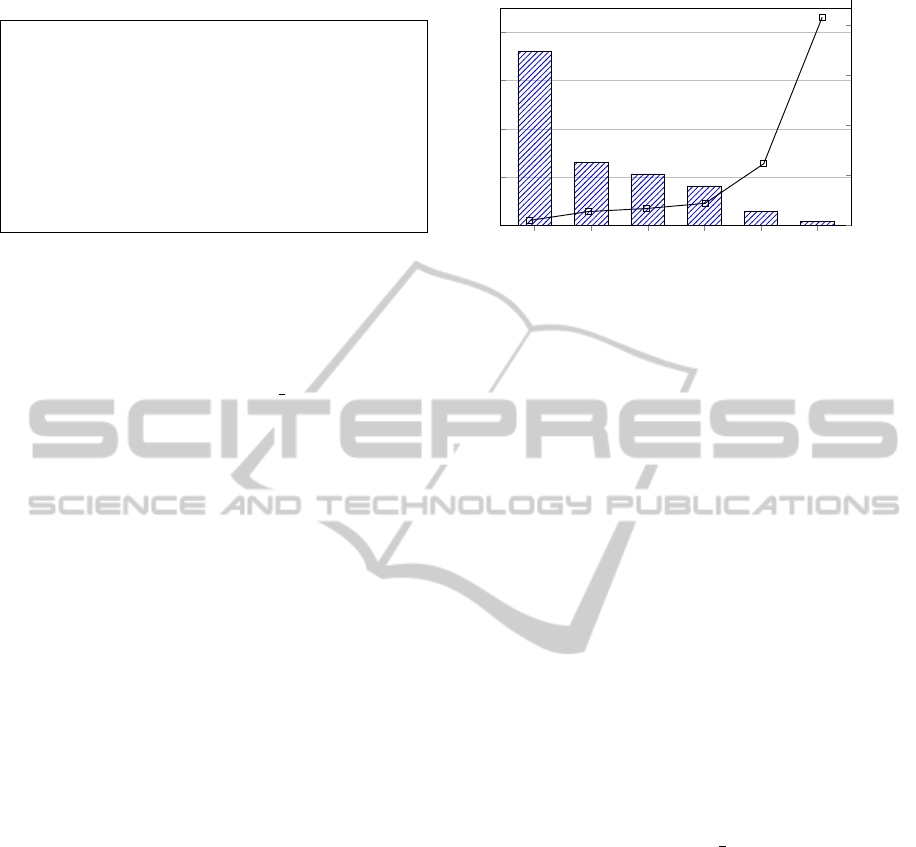
C++/ROOT
SQL Calc.Col. An.View fully Mod. Res.Cache
0
10
20
30
40
Execution Runtime [s]
0
10
20
30
40
Speed-up [x]
Figure 5: Execution runtime (bars) and speed-up gain (curve)
due to our different tuning steps of the particle physics anal-
ysis in HANA.
5 EVALUATION
In our evaluation, we show how our performance tun-
ing described in the previous sections step-by-step
improved the overall query runtime. As test system,
we used a 32-core server with Intel Xeon X7560 CPUs
@2.27 GHz and 500 GB of main memory.
In particular, we compare (from left to right in
Fig. 5):
1.
The conventional execution, performed on files
using a C++ program and the ROOT framework.
2.
A naive SQL execution in SAP HANA DB using
our schema of Fig. 4.
3.
The SQL execution using the calculated columns
instead of expression evaluation as in Listing 1.
4.
The SQL execution using the
multiplicity
ana-
lytical view.
5.
A fully modeled SQL execution using the views
multiplicity
and
event count
as in Listing 2.
6. Same as 5.) but with enabled view result cache.
Figure 5 shows that already the naive SQL-based
approach taken by our web-based application is faster
than the C++-based implementation. The reasoning
behind this performance boost is two-fold: first, the
data is kept in main memory and hence, there are no
expensive file reads, which are slower even though the
files are cached in the file system. Second, operations
like aggregations, filters, and joins that are implicitly
done in the hand-written C++ Code are implemented
more efficiently in the database system.
In our experience, the computation of the complex
expressions and the complex grouping logic were dom-
inating factors of the query execution time. Hence, the
utilization of the materialized calculated columns fur-
ther improved the query performance by about 25%.
FromStatictoAgile-InteractiveParticlePhysicsAnalysisintheSAPHANADB
23

When using the first analytical view, the
multiplicity
view, we achieve another 25% speed-
up. With the fully modelled query using both the
multiplicity
and
event count
views the execu-
tion runtime is reduced to below 3 seconds, and a total
speedup of 13x, showing the potential of HANA’s inter-
nal optimizer when using the modelling infrastructure
and analytical views discussed in Section 4.
The result cache enables the caching of smaller
intermediate results, for example the
event count
view, which does not change throughout the analysis.
Thus, it helps to reduce the execution runtime down to
about a third compared to step 5.
As a result, we achieve an overall performance
improvement of more than a factor 40 compared to the
hand-crafted C++ code using the ROOT framework. Of
course hand-tuned C++-code should outperform our
system, but as discussed the usage of frameworks like
ROOT inhibits common optimizations, e.g push-down
of expressions and filters.
Not only is this interface more easy to use, it now
also allows for truly interactive and incremental anal-
ysis of the simulation and experimental data. As fu-
ture work we intend to compare our approach with
the direct access to the RAW Root-files as presented
in (Karpathiotakis et al., 2014), e.g. using the Smart
Data Access framework available in SAP HANA.
6 RELATED WORK
The increase in data size and demand for scalable data
processing of several scientific domains has led to an
increased attention for scientific data processing in
the database community (Ailamaki et al., 2010). In
that context, some specialized database systems with
scientific focus have emerged and advanced in the
recent decade.
Array DBMS.
In many scientific domains, for ex-
ample astronomical image processing, data is usually
stored in structured representations, such as multidi-
mensional arrays. Since the relational data model of
conventional DBMS did not match the requirements
for scientific data processing, which is often based
on arrays to achieve data locality, systems like Ras-
DaMan (Baumann et al., 1998) or SciDB (Stonebraker
et al., 2009) emerged. However, particle physics data
does not have an array-like structure that requires ele-
ment locality, but are rather a huge set of many inde-
pendent measurements, hence, our analysis would not
benefit from using an array-based DBMS. Although
the authors of a related project come to a similar con-
clusion (Malon et al., 2011), there have been efforts
to utilize SciDB for the ATLAS Tag Database (Malon
et al., 2012).
Particle Physics and Database Systems.
The AT-
LAS Tag Database (Cranshaw et al., 2008; Malon
et al., 2011; Malon et al., 2012) stores event-level
metadata in a relational database system, so that sci-
entists can preselect events according to their analysis
criteria by relational means. Based on the preselection,
the analysis is then run conventionally using C++ pro-
grams on ROOT files, but only using the selected raw
data files rather than on the whole set. This approach
deviates significantly from our work, since in EPOS
on HANA the complete analysis is performed in the
DBMS, and selection criteria are a part of the main
analysis.
The idea of combining customized in-situ process-
ing on raw data files with the advantages of the colum-
nar data processing capabilities of a modern DBMS
has already been mentioned in (Malon et al., 2011). A
similar – “NoDB” – approach was implemented in the
work of Karpathiotakis et. al. (Karpathiotakis et al.,
2014), which addresses another workflow from high
energy physics (Higgs Boson Search). In their work,
the authors propose an adaptive strategy, which utilizes
Just-In-Time (JIT) access paths and column shreds for
query processing.
We agree with the authors that it would be infeasi-
ble to store as much as 140 PB of raw data generated
at CERN in a database system, in particular when re-
garding main-memory DBMS. However, the query of
the Higgs Boson search considered in (Karpathiotakis
et al., 2014) resembles a highly selective exhaustive
search on the vast amount of all raw data files. In
contrast, our EPOS on HANA application is rather
geared towards an incremental analysis of medium-
size data sets, in the range of up to several terabytes,
which are typical sizes for Monte-Carlo simulation
data. We argue that the column-oriented data layout
and efficient data processing capabilities of modern in-
memory DBMS enable to shift the actual computation
into the database engine. Together with the JavaScript-
based SAPUI5 framework that allows flexibility and
extensibility of the analysis application, our system
offers the infrastructure to host the complete analysis
workflow in the database, making commercial systems
like SAP HANA more interesting for the high energy
physics community in the future.
7 CONCLUSIONS
In this paper, we showed how an interesting applica-
tion from the challenging and data intensive domain of
DATA2015-4thInternationalConferenceonDataManagementTechnologiesandApplications
24

particle physics, can be accelerated using a high-end
column-store RDBMS. We mapped the static parti-
cle physics analysis workflow based on custom C++
code and the ROOT framework (Brun and Rademak-
ers, 1997) efficiently onto SQL queries on relational
tables. This opens the door for physicists to benefit
from the parallelized join and aggregation operators
of the in-memory DB SAP HANA. Moreover, by care-
fully utilizing analytical views and result caching we
achieve instant result feedback on intermediate data
sizes, and an overall speedup of more than an order
of magnitude. In contrast to the static conventional
approach, we turned the static into an agile workflow,
and enabled the user to adjust parameter settings just
in time. Besides the extensibility and capability of our
framework to serve more than just the presented anal-
ysis requests, we believe that this approach shows is
a right step into speeding up traditional science work-
flows.
ACKNOWLEDGEMENTS
We thank the group of Prof. Werner from the Unversit
´
e
de Nantes and the SUBATECH research laboratory for
providing us insights into their domain-specific prob-
lem setting and provided data from the EPOS Monte-
Carlo generator. We also thank Julien Marchand and
Arne Schwarz for developing the initial version of the
tool and helping to improve it. Moreover, we express
our gratitude to our fellow colleagues in Walldorf for
fruitful discussions and support.
REFERENCES
Ailamaki, A., Kantere, V., and Dash, D. (2010). Managing
Scientific Data. Commun. ACM, 53(6):68–78.
Baumann, P., Dehmel, A., Furtado, P., Ritsch, R., and Wid-
mann, N. (1998). The Multidimensional Database
System RasDaMan. SIGMOD Rec., 27(2):575–577.
Brun, R. and Rademakers, F. (1997). ROOT: An object
oriented data analysis framework. Nucl.Instrum.Meth.,
A389:81–86.
CERN (2014). About Cern - Computing.
http://home.
web.cern.ch/about/computing.
Cranshaw, J., Doyle, A., Kenyon, M., and Malon, D. (2008).
Integration of the ATLAS Tag Database with Data Man-
agement and Analysis Components. J. Phys.: Conf.
Ser.
Drescher, H., Hladik, M., Ostapchenko, S., Pierog, T., and
Werner, K. (2001). Parton-based Gribov-Regge Theory.
Physics Reports, 350:93–289.
Durham University (2014). The Durham HepData Project.
http://hepdata.cedar.ac.uk/.
Eich, M. and Moerkotte, G. (2015). Dynamic programming:
The next step. In ICDE.
F
¨
arber, F., May, N., Lehner, W., Große, P., M
¨
uller, I., Rauhe,
H., and Dees, J. (2012). The SAP HANA Database
– An Architecture Overview. IEEE Data Eng. Bull.,
35(1):28–33.
Große, P., Lehner, W., Weichert, T., F
¨
arber, F., and Li, W.
(2011). Bridging two worlds with RICE integrating R
into the SAP in-memory computing engine. PVLDB,
4(12):1307–1317.
Karpathiotakis, M., Branco, M., Alagiannis, I., and Ailamaki,
A. (2014). Adaptive Query Processing on RAW Data.
PVLDB, 7(12):1119–1130.
Malon, D., Cranshaw, J., van Gemmeren, P., and Zhang, Q.
(2011). Emerging Database Technologies and Their
Applicability to High Energy Physics: A First Look at
SciDB. J. Phys.: Conf. Ser.
Malon, D., van Gemmeren, P., and Weinstein, J. (2012).
An exploration of SciDB in the context of emerging
technologies for data stores in particle physics and
cosmology. J. Phys.: Conf. Ser.
May, N., B
¨
ohm, A., Block, M., and Lehner, W. (2014).
Beyond SQL: Query processing lifecyle in the SAP
HANA Database Platform. In submitted for publica-
tion.
Neumann, T., Helmer, S., and Moerkotte, G. (2005). On the
optimal ordering of maps and selections under factor-
ization. In ICDE.
SAP Fiori (2014). SAP Fiori for SAP Business Suite.
http:
//help.sap.com/fiori.
Stonebraker, M., Becla, J., DeWitt, D. J., Lim, K., Maier, D.,
Ratzesberger, O., and Zdonik, S. B. (2009). Require-
ments for science data bases and SciDB. In CIDR.
FromStatictoAgile-InteractiveParticlePhysicsAnalysisintheSAPHANADB
25
