
Experimental/FEM Optimization of Medium Voltage Rubber
Insulated Electric Cables Vulcanized with Steam Water
Numerical Simulations and Inverse Analyses
Gabriele Milani
1
and Federico Milani
2
1
Technical University in Milan, Piazza Leonardo da Vinci 32, 20133, Milan, Italy
2
CHEM.CO Consultant, Via J.F.Kennedy 2, 45030, Occhiobello (RO), Italy
Keywords: Power Cables Production Lines, Steam Curing, FE Evaluation of Temperature Profiles, Genetic Algorithm.
Abstract: A comprehensive combined numerical model based on Genetic Algorithm (GA) optimization and heat
transfer Finite Element computations is presented. The numerical analyses are carried out to evaluate the
final crosslinking degree of a medium voltage electric cable subjected to industrial peroxide reticulation.
The final task is to minimize the difference between numerically predicted and experimentally determined
crosslinking degree along the thickness of the insulator, when a variable steam temperature profile along the
pipe length is assumed to explain the unexpected under-vulcanization of the cable in the internal layers. To
minimize the gap between experimentally determined curing degree and numerical predictions, a Genetic
Algorithm (GA) optimization is used.
1 INTRODUCTION
In a companying paper (Milani and Milani 2015), a
real production line 103 meters long has been
analyzed from an experimental point of view.
Experimental Differential Scanning Calorimetry
(DSC) results shown that, at four different
vulcanization conditions with steam, the resulting
reticulation degree at the end of the production
process is sensibly lower than that expected from
simplified evaluations based on the knowledge of
the half time life of the peroxides used, especially
when the steam temperature is low and the exposure
time is reduced. The situation is critical in the
internal layers.
The present paper is aimed at analyzing the
vulcanization process from a numerical point of
view, trying to identify the reasons at the base of
such an unexpected under-vulcanization of the cable.
The Finite Element analysis of the heat transfer
process during rubber vulcanization has long
tradition and has been successfully applied by many
authors to predict the reticulation degree at the end
of several different production processes Lenir
(1984) and Kosar and Gomzi (2007).
In this framework, the combined approach
proposed in the present paper may be regarded as
innovative and beneficial for producers interested in
a quantitative evaluation of the level of cure
obtained in the production process.
The input parameters optimization is performed
by means of an inverse analysis with a non standard
meta-heristic approach based on Genetic Algorithm
concepts. The procedure appears particularly
appealing instead of the utilization of gradient based
routines into a standard least squares minimization
on experimental data, because the crosslinking
density function at the end of the industrial process
is not analytically known.
At fixed input parameters, the determination of
the curing level is typically obtained by means of
Finite Element simulations.
When FEs are used to determine the crosslinking
degree of the cable with constant vulcanization
temperature, a partial match between numeric
predictions and experimental evidences from DSC is
found, indicating a clear discrepancy between set
parameters and real values. Such result suggests that
the steam curing temperature along the pipe length
probably decreases, at the same time addressing that
one of the key input parameters to optimize in the
GA is the variable steam temperature.
Individuals of the GA are represented by the
temperatures at different positions of the pipe,
27
Milani G. and Milani F..
Experimental/FEM Optimization of Medium Voltage Rubber Insulated Electric Cables Vulcanized with Steam Water - Numerical Simulations and Inverse
Analyses.
DOI: 10.5220/0005503100270035
In Proceedings of the 5th International Conference on Simulation and Modeling Methodologies, Technologies and Applications (SIMULTECH-2015),
pages 27-35
ISBN: 978-989-758-120-5
Copyright
c
2015 SCITEPRESS (Science and Technology Publications, Lda.)

-a
-b
Figure 1: Schematic representation of the vulcanization
process of a wire. -a: heating phase. –b: cooling phase.
whereas the objective (fitness) function is represent
by the sum of the squared difference between
numeric prediction and experimental determination
of the crosslinking degree. The proposed GA is
robust and non-standard, based on a specifically
developed zooming strategy which consists in the
subdivision of the population at each iteration into
two sub-groups, depending on individuals grade of
fitness (elitist strategy). Different genetic procedures
are applied to the sub-groups, namely both two
typologies of admissible mutations for the elite sub-
population and mutation and reproduction for the
remaining individuals. In order to improve algorithm
convergence, a user-defined population percentage,
depending on individuals fitness, is replaced with
new phenotypes at the end of each iteration,
enforcing in this way the chromosomes renewal.
The aim of the numeric approach proposed is not
only to fit experimental data through least squares
best fitting, but also to suggest a simple and efficient
computational tool able to determine the expected
level of crosslinking.
2 GOVERNING PARTIAL
DIFFERENTIAL EQUATIONS
The real production plant has to be idealized before
applying any mathematical model. At this aim, the
vulcanization process can be schematically
subdivided into two simply phases (Figure 1): (1)
heating zone and (2) a cooling zone.
Index
j
indicates the metallic conductor (semi-
diameter
j
R
) and index
p
indicates the insulation
width (ray
p
R
).
The axial symmetry of cable leads to a two
independent variables system: the distance
r
of an
insulation layer respect to cable axis and exposure
time
t . At constant cable speed, a cable section at a
distance
z
with respect to the starting point of the
production line, is characterized by an exposure time
equal to
c
uzt /
. This means
z
is a variable
dependent from t.
During the heating phase pressurized steam at
n
T
temperature is used, exchanging heat with Ethylene-
Propylene Diene Monomer Rubber (hereafter
abbreviated as EPDM for the sake of clearness)
surface mainly by convection. Fourier’s heat
equation law in cylindrical coordinates is used to
numerically determine temperature profiles along
cable thickness Milani and Milani (2008). For the
insulation layer the heat balance field equation is the
following:
0
1
2
2
rpp
p
pp
Hr
r
T
r
r
T
t
T
c
(1)
Where
-
p
,
p
p
c
and
p
are EPDM density, specific
heat capacity and heat conductivity respectively;
-
r
H
is the insulation specific heat of reaction;
-
p
r
is the rate of crosslinking;
The term
rp
Hr
in equation (1) is the heat
produced by the decomposition of the peroxide.
r
H
depends both on type of peroxide used and on
type of hydrogen to extract (allylic, vinylic, etc.).
For simplicity, we assume a linear behavior for
p
r
with respect to concentration, i.e.
dt
dC
r
p
.
Similar considerations can be repeated for the
conductor, obviously assuming
0
r
H
:
z=u /t
r
R
j
R
p
L
h
steam water at
hi
g
h
pressure
T
n
T
n
T
n
T
n
T
n
R
n
c
EPDM
Conductor (Al Cu)
Phase I
H O ambient temperature
2
L
w
Phase II
u
c
T
w
T
w
T
w
T
w
T
w
SIMULTECH2015-5thInternationalConferenceonSimulationandModelingMethodologies,Technologiesand
Applications
28

0//1//
22
rTrrTtTc
j
p
jj
(2)
Where the index
j
refers to the conductor layer.
Since heat equation is of second order in space,
two boundary conditions must be specified. In
particular, for the problem at hand, at
0
r
a
symmetry condition on the temperature field is
imposed in the well-known form
0/
rT
,
whereas at
p
Rr
we impose:
0,
radnpp
qTtRTh
r
T
(3)
Where
h
is the heat transfer coefficient between
EPDM and steam,
n
T
is steam temperature and
rad
q
is the heat flux transferred by radiation. Here it
is worth noting that, in the present case (i.e. for
vulcanization with steam), the evaluation of
rad
q
would be a rather difficult task. As a matter of fact,
the well-known radiation formulas in polar
coordinates cannot be applied rigorously since the
water vapor participates in the radiation exchange
between the tube wall and insulation surface. Since
typical values of the convection coefficient are used
for the steam condensation, radiation is not included
in the model due to the complexity of accurately
including the radiation effects.
Finally, at the interface between conductor and
insulation, an equilibrium equation on the heat flux
exchanged is imposed in the form:
rtRTrtRT
ppjj
/,/,
(4)
For transient conduction, heat equation is of first
order in time, requiring the assumption of an initial
temperature distribution:
pjp
jj
RrRTrT
RrTrT
0
0
0,
00,
(5)
No differences occur in the cooling zone, except
that boundary equation (3) is replaced by a pure
convection equation
0,
wpwp
TtRTh
r
T
,
where
w
h
is the water heat transfer coefficient and
w
T
is the water cooling temperature.
Initial temperature conditions are obtained from
the profile evaluated at the last step of the cooling
zone, i.e. at
c
trT ,
, where
ccc
uLt /
with
c
L
curing zone length.
Figure 2: Schematic representation of the numeric
procedure adopted to determine final tensile strength of
each layer.
3 NUMERIC PREDICTIONS
UNDER CONSTANT
TEMPERATURE PROFILES
CONDITIONS
The determination of temperature profiles across
cable section does not require inverse analysis
optimization, but simply the Finite Elements
solution of problem (1)-(5), as illustrated
schematically in
Figure 2 when a temperature profile
for the vulcanization agent (stem), i.e. an individual
within a Genetic Algorithm scheme (GA, see after),
is considered .
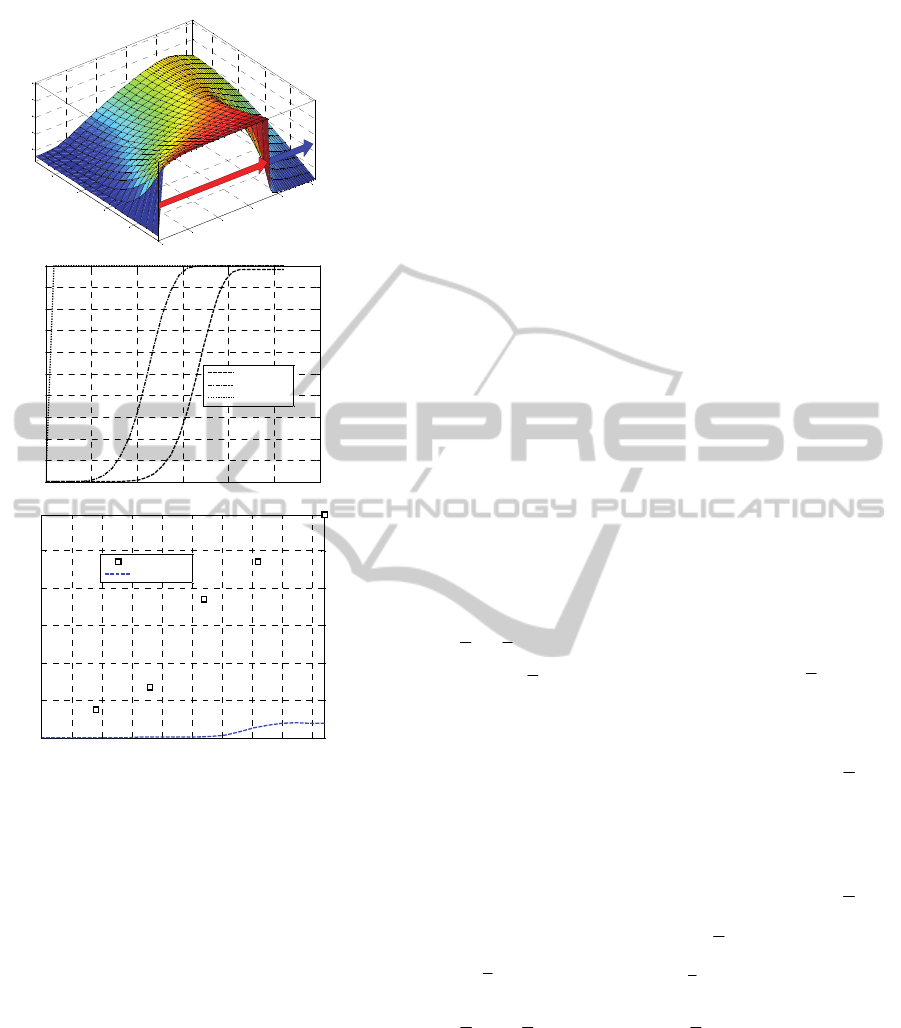
Numerically estimated temperature profiles and
residual unreacted peroxide concentrations in one
vulcanization conditions experimentally tested is
represented in Figure 3.
In subfigure –a the temperature profiles at
constant steam temperature are represented. In
subfigure –b the reacted peroxide concentration of
internal middle and external layers are depicted,
whereas a comparison between simulated and
experimental data is provided in subfigure -c.
The data show a great diversion between the
deduced percentage of unreacted peroxides and the
experimental evidences.
i
x
Individuals generation
Step 0
Temperature profile
evaluation for each
insulator layer
Step 1
i=1,...,N
ind
T
z , t=z/u
c
Step 2
Best fitting on
experimental DSC
data
cable
thickness
Subdivision of the
insulator in layers
Repeat for each layer
t
C
t
Step 3
Repeat for each individual
Individuals fitness
evaluation
Vulcanization agent
concentration for each
insulator layer
Kinetic
model &
Kinetic
constants
evaluation
For each layer identification of the ureacted peroxide
concetration at the end of vulcanization
Experimental/FEMOptimizationofMediumVoltageRubberInsulatedElectricCablesVulcanizedwithSteamWater-
NumericalSimulationsandInverseAnalyses
29
-a
-b
-c
Figure 3: Test #1. –a: temperature profiles at water steam
constant temperature. -b: evolution of peroxide reaction in
three positions of the cable. –c: comparison with
experimental data.
It can therefore be concluded that an inverse
analysis would be extremely useful to optimize and
control the final level of crosslinking of the cable.
4 THE GA APPROACH
PROPOSED FOR THE
OPTIMIZATION
When the temperature profile of the steam along the
line is not known, inverse analyses are needed to
determine the profile that allows the best fitting of
the final crosslinking level across the cable section.
Meta-heuristic approaches are particularly indicated
because the analytical function representing the
steam temperature variation along the length is
unknown.
The meta-heuristic approach utilized is a non-
standard and robust GA that has been already used
in the same or different contexts by the authors in
Milani and Milani (2007, 2008, 2009, 2011).
The core of the GA proposed is a set of standard
(reproduction, crossover and mutation) and non-
standard (zooming and elitist strategy) genetic
procedures. The iterative optimization strategy is
schematically shown in
Figure 2. Each individual
population belonging is represented by admissible
temperature
i
n
T
of the steam on a series of control
nodes i along the length of the vulcanization pipe.
The main novel characteristic of the proposed GA
consists in the subdivision of the population into two
subgroups with improvement of the best fitness
individuals with zooming , Milani (2013) , Kang and
Zong (2004) and Haupt and Haupt (2004). An
admissible initial population
admissible|,...,1:
iindi
xNix
x
is randomly
generated In the in Step 0 at the first iteration. In
Step 1,
i
x
fitness
i
xF
is evaluated solving for
each layer a PDEs system with fixed
i
x
. In Step 2,
two sub groups are created, namely
admissible|,...,1:
ieliti
xNix
x
and
elitindi
NNiy
:,...,1:xxy
.
x
is the
group of all the individuals with the
elit
N
(user
defined) higher fitness values. This step represents
the zooming strategy. In Step 3a for each
i
x
a
random improvement of the individual (in terms of
fitness) is tried using a mutation operator. The
recursive double operation applied randomly
mut
N
times, leads to a new individual generation
iM
x
,
which overwrites the original
i
x
only if its fitness
iM
xF
is greater than
i
xF
. At the end of the
double loop, a new sub-group
admissible|,...,1:
iMelitiMM
xNix
x
is
obtained.
In Step 3b a mutation loop is applied randomly
mut
N
times for each individuals
i
y
with low fitness,
leading to an improvement of
i
y
fitness. The new
individuals
iM
y
overwrite the original
i
y
only if
their fitness is greater than
i
y
one (elitist approach).
0.7
0.8
0.9
1
0
20
40
60
80
10
0
0.2
0.4
0.6
0.8
1
Cooling
Length L [m]
Heating
N
ormalized Temperature profile T(t,r)/T
s1
Distance r [cm]
0 20 40 60 80 100 120
0
10
20
30
40
50
60
70
80
90
100
tube length [m]
Reacted peroxide [%]
internal layer
middle layer
external layer
0 0.5 1 1.5 2 2.5 3 3.5 4 4.5
5
10
15
20
25
distance from the external surface [mm]
% unreacted peroxide %
Experimental
Numerical
SIMULTECH2015-5thInternationalConferenceonSimulationandModelingMethodologies,Technologiesand
Applications
30

At the end of the double loop, a new sub-group
admissible|,...,1:
iMelitindiMM
yNNiy
y
is obtained. A classic reproduction operator is
applied only for individuals of
M
y
with high
fitness (i.e. on
/
elitind
NN
parents with user
defined parameter
>1) in order to create a new
offspring group
c
. The remaining
/1
elitind
NN
individuals are generated
ex-novo using Step 0 procedure and are catalogued
into
admissible|/,...,1::
NjelitindNjN
cNNjc
c
vector.
-a
-b
-c
Figure 4: Test #1. –a: temperature profiles at variable
temperature. -b: comparison with experimental data on
unreacted peroxide %. –c GA temperature profile.
Finally, the last population at the
i
-th iteration is
collected into
NM
ccxx
and the procedure
is repeated from the beginning.
5 THE NEW SIMPLIFIED
MECHANISTIC MODEL
PROPOSED
The same electric cable subjected to the
aforementioned experimental tests is supposed to be
subjected to a variable steam pressure along the
vulcanization pipe to determine.
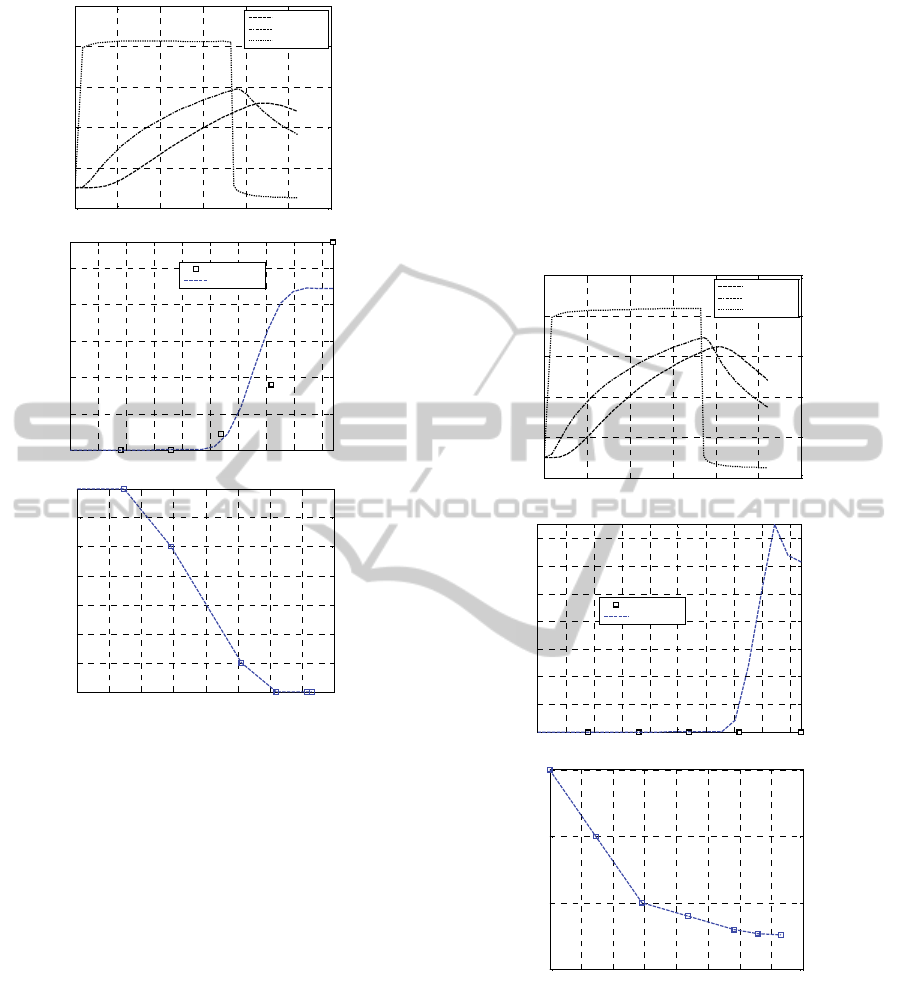
Results obtained for Tests from #1 to #4 are
shown from Figure 4 (#1) to Figure 6 (#4)-
Results for the best fitness individual at the last
GA iteration are reported assuming that the
individual best fits experimental DSC data.
The temperature profiles with variable steam
temperature are represented in subfigure –a (core,
middle, skin layers).
In subfigures –b the unreacted peroxide
concentration along cable thickness is shown (with a
comparison with DSC results), whereas in
subfigures –c the GA temperature profile along the
length is depicted.
Comparing simulations results it is possible to
note that:
1) there is a visible drop of temperature in Test #1,
which fully justifies the unsatisfactory
crosslinking level obtained during the
experimentation. Comparing the numerical
results with DSC experimental predictions, it is
clear that without this drop the crosslinking
should be close to optimal;
2) the minimization fitting function is non convex
and may provide multiple solutions. A similar
result may be obtained assuming a constant
steam temperature along the line. This remark
justifies also the utilization of a meta-heuristic
approach to deal with the problem at hand.
Standard minimization algorithms based on first
derivative evaluations may potentially fail in
finding the optimal solution.
The application of the GA combined with FEs
allows concluding that a drop of steam temperature
along the pipe length may be an important factor to
justify the unexpected under-vulcanization for
certain cure conditions, but such results do not
rigorously show conclusively that this is likely the
main cause.
0 20 40 60 80 100 120
0
20
40
60
80
100
120
140
160
180
200
tube length [m]
Temperature [°C]
internal layer
middle layer
external layer
0 0.5 1 1.5 2 2.5 3 3.5 4 4.5
5
10
15
20
25
30
distance from the external surface [mm]
% unreacted peroxide %
Experimental
Numerical
0 10 20 30 40 50 60 70 80
180
185
190
195
200
205
tube length [m]
water steam temperature [°C]
Experimental/FEMOptimizationofMediumVoltageRubberInsulatedElectricCablesVulcanizedwithSteamWater-
NumericalSimulationsandInverseAnalyses
31
-a
-b
-c
Figure 5: Test #2. –a: temperature profiles at variable
temperature. -b: comparison with experimental data on
unreacted peroxide %. –c GA temperature profile.
Before placing all of the cause for discrepancy
between the computed and experimental state of
cure profiles on an axial temperature decrease, it is
therefore interesting to have an insight into the effect
linked to a variation of the different coefficients
assumed constant in the FE computations.
In particular, it may be worth exploring the
effect of the values of the presumed heat transfer
coefficients and the initial temperature of the
insulation on the computed solutions on the
agreement with the experimental results.
In addition, the state of the steam in the
apparatus seems to indicate that the steam injected
into the tube is superheated. If this is the case, then
the expression for the relation between the
temperature and pressure for saturated vapor does
not apply. However, if the surface of the insulation
is below the saturation temperature of the steam at
the inlet pressure of the tube, then steam will
immediately condense on the surface of the
insulation at that temperature. Since the heat transfer
coefficient will be fairly high under these conditions
it might be reasonable to assume a constant surface
temperature equal to the saturation temperature, that
in Test #1 is 202°C for a pressure equal to 16.5 bar.
If the surface of the insulation is above this
temperature then the mode of heat transfer is simply
forced convection with the steam temperature
decreasing until the saturation temperature is
reached.
-a
-b
-c
Figure 6: Test #4. –a: temperature profiles at variable
temperature. -b: comparison with experimental data on
unreacted peroxide %. –c GA temperature profile.
In order to take into account in a simplified
manner a complex problem of heat exchange, which
is unsteady, three additional sets of simulations are
performed assuming the following heat transfer
coefficients for the steam: h=30 W/m
2
K, h=300
W/m
2
K and h variable along the length of the pipe,
with and optimization of the heat transfer coefficient
0 20 40 60 80 100 120
0
50
100
150
200
250
tube length [m]
Temperature [°C]
internal layer
middle layer
external layer
0 0.5 1 1.5 2 2.5 3 3.5 4 4.5
0
2
4
6
8
10
distance from the external surface [mm]
% unreacted peroxide %
Experimental
Numerical
0 10 20 30 40 50 60 70 80
208.5
209
209.5
210
210.5
211
211.5
212
tube length [m]
water steam temperature [°C]
0 20 40 60 80 100 120
0
50
100
150
200
250
tube length [m]
Temperature [°C]
internal layer
middle layer
external layer
0 0.5 1 1.5 2 2.5 3 3.5 4 4.5
0
1
2
3
4
5
6
7
x 10
-13
distance from the external surface [mm]
% unreacted peroxide %
Experimental
Numerical
0 10 20 30 40 50 60 70 80
210.5
211
211.5
212
tube length [m]
water steam temperature [°C]
SIMULTECH2015-5thInternationalConferenceonSimulationandModelingMethodologies,Technologiesand
Applications
32

on experimental data by means of the same GA
approach previously used with variable steam
temperature. Such lower and upper bounds values
for h are assumed in agreement with indications
provided in Milani et al. (2008).
We assume steam temperature constantly equal
to T
1
=202°C and the total curing time t
c
equal to 5.6
minutes, i.e. design conditions of Test #1 are
investigated, being the vulcanization level in such
case critical and unexpectedly low. Whilst authors
are aware that a realistic numerical simulation
should take into account the variability of both T
n
and h, such simulations cannot be performed with
the GA approach proposed if a relation between h
and T
n
is not provided.
However, it is worth underlining that the
evaluation of h (especially as a function of T
n
) is a
very difficult task, especially when steam condenses
and there is a passage between vapor and liquid
phase, due to unknown heat unsteady transfer
processes. In addition, the common Newton’s law of
heat exchange by convection is probably too
simplistic and holds only for forced convection,
whereas probably in this case –as already pointed
out- there is an unknown dependence of h with the
temperature difference between steam and rubber
surface.
It is finally worth emphasizing that the values
adopted for h in the two sets of simulations with
constant h represent large bounds indicated for
steam in forced convection in many handbooks and
therefore such numerical analyses may well
approximate upper and lower bonds.
Temperature profiles obtained assuming lower
and upper bound constant values for h are depicted
in Figure-a and –b respectively. Furthermore, in
Figure-c the same results are represented with a
variable h values. The numerical prediction of the
unreacted peroxide along the thickness of the cables,
with a comparison with experimentally determined
values is finally reported in Fig. 9.
As can be noted, when a large value for h is
assumed (upper bound) the heat exchange is
intuitively favored and the % unreacted peroxide
found numerically sensibly deviates from
experimental values.
The same applies for an excessively reduced
value of h (lower bound). In such a condition, the
heat exchange between rubber surface and steam
becomes slow and the peroxide reacts with lower
velocity. The resultant % of unreacted peroxide is
therefore higher than that experimentally
determined.
-a
-b
-c
Figure 7: Test #3. –a: temperature profiles at variable
temperature. -b: comparison with experimental data on
unreacted peroxide %. –c GA temperature profile.
Conversely, result obtained assuming h as
variable are in quite good agreement with
experimental evidences, see Fig. 9-c. h profile along
the tube length determined by means of the GA
proposed is represented in Figure 10, with a 3D
representation of the unreacted peroxide % (along
the thickness and length of the cable). As can be
noted, there is a monotonic decrease of h, which
assumes very high values at the beginning
(superheating condition) and then decreases along
the line to typical values for steam water convection.
While the present simulations are obviously affected
by errors induced by the strong simplifications
assumed, the results obtained give interesting
information on the physical processes occurring to
the steam along the line.
It is finally interesting to notice that, when
dealing with the initial inlet temperature, GA
simulations are performed assuming a value equal to
25°C.
0 20 40 60 80 100 120
0
20
40
60
80
100
120
140
160
180
200
tube length [m]
Temperature [°C]
internal layer
middle layer
external layer
0 0.5 1 1.5 2 2.5 3 3.5 4 4.5
0
0.5
1
1.5
2
2.5
3
3.5
distance from the external surface [mm]
% unreacted peroxide %
Experimental
Numerical
0 10 20 30 40 50 60 70 80
175
180
185
190
195
200
205
tube length [m]
water steam temperature [°C]
Experimental/FEMOptimizationofMediumVoltageRubberInsulatedElectricCablesVulcanizedwithSteamWater-
NumericalSimulationsandInverseAnalyses
33

Such value is certainly a lower bound and does
not take into account the initial heating phase inside
the extruder. Here it is only worth noting that to
provide realistic numerical simulations inside an
extruder is a very difficult task, involving 3D FE
modelling with coupled thermo-mechanical
approaches. Authors repeated some numerical
simulations adopting a simplified procedure, with an
increase of the curing temperature from 25 to 90°C
in the first 20 meters (length of the extruder) and
then starting the simulations. Results are reported in
Figure 10. As authors experienced, however, the
concentration of unreacted peroxide at the end of the
simulations (Figure 10-b) is very similar to that
found with an inlet temperature equal to 25°C.
6 CONCLUSIONS
A GA approach has been proposed to check and to
predict the behavior of a real production plant. The
general methodology has been validated analyzing
experimental evidences at the end of the production
process.
The mathematical approach proposed couples the
solution of the heat transmission law in cylindrical
coordinates with variable steam temperature and the
application of a Genetic Algorithm with inverse least
squares data fitting to determine the vulcanization
conditions of the samples.
-a
-b
Figure 8: Test #1. Temperature profiles obtained with
different values of
h. –a: lower bound for h –b: upper
bound for
h. –c: variable h.
-c
Figure 8: Test #1. Temperature profiles obtained with
different values of
h. –a: lower bound for h –b: upper
bound for
h. –c: variable h (cont.).
-a
-b
-c
Figure 9: Test #1. Unreacted peroxide % along the cable
thickness obtained with different values of
h. –a: lower
bound for
h –b: upper bound for h. –c: variable h.
The drop of the steam temperature depicted by
this approach could lead to a suboptimal degree of
crosslinking especially near the core of the
insulation, where the heat diffusion is lower.
0 20 40 60 80 100 120
0
20
40
60
80
100
120
140
160
180
tube length [m]
Temperature [°C]
internal layer
middle layer
external layer
0 20 40 60 80 100 120
0
50
100
150
200
250
tube length [m]
Temperature [°C]
internal layer
middle layer
external layer
0 20 40 60 80 100 120
0
20
40
60
80
100
120
140
160
180
200
tube len
g
th
[
m
]
Temperature [°C]
internal layer
middle layer
external layer
0 0.5 1 1.5 2 2.5 3 3.5 4 4.5
10
20
30
40
50
60
distance from the external surface [mm]
% unreacted peroxide %
Experimental
Numerical
0 0.5 1 1.5 2 2.5 3 3.5 4 4.5
5
10
15
20
25
distance from the external surface [mm]
% unreacted peroxide %
Experimental
Numerical
0 0.5 1 1.5 2 2.5 3 3.5 4 4.5
5
10
15
20
25
distance from the external surface [mm]
% unreacted peroxide %
Experimental
Numerical
SIMULTECH2015-5thInternationalConferenceonSimulationandModelingMethodologies,Technologiesand
Applications
34

The optimal degree of crosslinking for a well-
defined compound could be achieved varying
mainly the following production parameters: (1) rate
of extrusion, (2) temperature of crosslinking, (3)
ratio between heating and cooling area.
Avoid the formation of parts where the steam
passes to liquid water.
In order to support and drive the plant manager
through such a difficult task, a numerical tool has
been developed and it is now available to be used to
set up industrial CV lines.
-a
-b
Figure 10: Test #1. Results obtained with h kept as
variable to optimize with the GA approach. –a: normalized
peroxide concentration along the thickness and the length
of the cable. –b: drop of
h along the length of the cable.
As it has been shown by the numerical
simulations provided in a companying paper (Milani
and Milani 2015), an accurate experimental
estimation of thermo-physical data (pressure and
temperature measures) of the steam provided point
by point along the pipe length is a key issue to
precisely predict the level of vulcanization of the
resulting cured item. When dealing with steam
vulcanization, indeed, it can occur that pressure
measures along the pipe are not strictly sufficient to
determine the steam temperature, because it could be
superheated. If this is the case, then the expression
for the relation between the temperature and
pressure for saturated vapor does not apply. This is
the reason why pressure measures should always be
coupled with temperature evaluations. If such a
monitoring system is at disposal to the producers,
Finite Elements can accurately predict the level of
vulcanization at the end of the production, without
the need to provide experimental a-posteriori DSC
analyses on selected samples. Conversely, the
monitoring system coupled with Finite Elements and
GA could be used to optimize the curing apparatus,
maximizing the output mechanical properties of the
insulator, especially in presence thick items.
REFERENCES
Haupt R. L., Haupt S. E., Practical Genetic Algorithms –
John Wiley and Sons
– 2004.
Kang S. L., Zong W. G.,
Computers and Structures, 82,
781 – 2004.
Kosar V., Gomzi Z., Thermochimica Acta, 457, 70 –
2007.
Lenir V. L., Polym. Eng. Sci., 24(9), 633 – 1984.
Milani G., Milani F.,
Journal of Computational Chemistry,
28 (13), 2203-2215– 2007.
Milani G., Milani F.,
Computers and Chemical
Engineering
, 32, 3198 – 2008.
Milani G., Milani F.,
Journal of Applied Polymer Science,
111(1), 482-507– 2009.
Milani G., Milani F., Journal of Mathematical Chemistry,
49(7), 1357-1383– 2011.
Milani G., Journal Math. Chem., 51(3), 1116 – 2013.
Milani G., Galanti A., Cardelli C., Milani F.,
Journal
Appl. Plym. Sci.,
131(8) 2014, paper #40075. DOI:
10.1002/app.40075.
Milani G., Milani F., Experimental/FEM optimization of
medium voltage rubber insulated electric cables
vulcanized with steam water. Differential Scanning
Calorimetry (DSC) and rheometer experimental
results. In Proc. 5
th
International Conference on
Simulation and Modeling Methodologies,
Technologies and Applications SIMULTECH2015,
Colmar, France, 21-23 July 2015.
0.7
0.8
0.9
1
0
20
40
60
80
100
0.2
0.4
0.6
0.8
Cooling
Length L [m]
Heating
Distance r [cm]
Normalized peroxide concentration
0 20 40 60 80 100 120
0
500
1000
1500
2000
2500
tube length [m]
h or h
w
[W/m
2
K]
Experimental/FEMOptimizationofMediumVoltageRubberInsulatedElectricCablesVulcanizedwithSteamWater-
NumericalSimulationsandInverseAnalyses
35
