
Quality of Service for Financial Modeling and Prediction as a Service
Victo
r Chang and Muthu Ramachandran
School of Computing, Creative Technologies and Engineering, Leeds Beckett University, Leeds, U.K.
Keywords: Quality of Service (QoS) for SaaS, Financial Modeling and Prediction as a Service (FMPaaS) QoS,
Performance and Accuracy Test for FMPaaS QoS.
Abstract: This paper describes our proposal for Quality of Service (QoS) for Financial Modeling and Prediction as a
Service (FMPaaS), since a majority of papers does not focus on SaaS level. We focus on two factors for
delivering successful QoS, which are performance and accuracy for FMPaaS. The design process, theories
and models behind the FMPaaS service have been explained. To support our FMPaaS service, two APIs
have been developed to improve on performance and accuracy. Two major experiments have been
illustrated and results show that each API processing can be completed in 2.12 seconds and 100,000
simulations can be completed in an acceptable period of time. Accuracy tests have been performed while
using Facebook as an example. Three points of comparisons between actual and predicted prices have been
undertaken. Results support accuracy since results are between 93.72% and 99.63%.
1 INTRODUCTION
The complexity of large scale financial cloud
computing services that require high speed and high
precision systems grows exponentially. Services of
large scale financial cloud computing and grids are
enormous in recent years. Some of them are used for
weather forecasting, simulation of aircraft and
military services, atmospheric and planet study,
remote sensing, large scale data analysis, aerospace
research, large scale computational fluid dynamic
services, aeronautics and automobile industries, and
financial simulations. More recently, predication
models used by these applications have become
increasingly important (Cantor and Royce, 2014).
As a result, understanding the behavioral aspects of
such systems is important for the design in the
quality of service. Some characteristics of large
scale financial cloud computing services include:
High speed and highly parallel
Real-time
Virtually connected nodes of systems
Grid is an infrastructure for large scale financial
cloud computing and other resources
High precision and accuracy
To manage largely-scale software in the cloud,
software components and also known as service
components are used. The aim is to provide a self-
contained entity that can be adapted to the required
environment quickly and easily. To elaborate this
further, software components design for large scale
financial cloud computing and grids have become
major issues in recent years and in years to come
(Silvestri et al., 2006; Albodour et al., 2012). They
have all claimed the importance of software
components which will dominate large scale
financial cloud computing and grid services.
Albodour et al., (2012) propose a model, Business
Grid Quality of Service (BEQoS), to measure key
metrics and provide added value for commercial and
business Grid applications. They use the GridSim
software to demonstrate their proof-of-concepts with
supporting results to show that reliability and
affordability can be achieved. Silvestri et al., (2006)
assert that the future large scale financial cloud
computing and grid services can be completely built
in a bottom-up fashion using software components
deployed on various locations and interconnected to
form a workflow graph and to re-configure
themselves as and when needed during run-time to
self manage those services that may in need.
In this paper, we propose a QoS requirements
engineering model to assert certain subsets of
activities that must be identified and assessed for a
large scale financial cloud computing and grid
services where the main emphasis has been given to
non-functional requirements that match onto the
characteristics of such Services. In all the
applications and Software as a Service (SaaS),
financial applications require on-demand services
5
Chang V. and Ramachandran M..
Quality of Service for Financial Modeling and Prediction as a Service.
DOI: 10.5220/0005502300050015
In Proceedings of the 2nd International Workshop on Emerging Software as a Service and Analytics (ESaaSA-2015), pages 5-15
ISBN: 978-989-758-110-6
Copyright
c
2015 SCITEPRESS (Science and Technology Publications, Lda.)

that are offered by cloud computing with cost-
benefits. Hence, financial domain has begun to reap
this benefit with emerging financial SaaS such as
FinancialForce developed jointly by SalesForce,
NetSuite, Intacct, and Oracle’s financial SaaS.
According to NetSuite (2014), FinancialForce
helped companies increase their revenues by 95%.
Accenture (2011) reports on financial technology
trends and high performance computing prediction
in the following category:
Leveraging technology to address new & change
in regulations
Reliable and globally harmonized financial
systems
Add value through strategic applications
Harvest benefits from technology
According to Accenture (2011), SaaS should be
simple, efficient, engaging, accessible, clearly
structured, intuitive, and supportive. While keeping
this set of requirements as design criteria, a SaaS
component model and a service architecture should
be designed to support flexibility, scalability, and
adaptability. This paper has proposed an integrated
service-oriented architecture and SaaS component
model for financial domains which provides
required scalability, flexibility and customization
that are at the heart of a financial SaaS.
There are a number of QoS factors that affect
quality of a cloud service. We have proposed a set of
QoS attributes that are keys to success of cloud
services, in particular, Financial Modeling and
Prediction as a Service (FMPaaS) where accuracy
and performance are the key benefits of such
services which has been achieved. To demonstrate
accuracy, two types of the accuracy test were given.
The first type was focused on the overall accuracy
and the second type was focused on three point
selection. One example will be illustrated to support
accuracy for our FMPaaS.
1.1 QoS for Financial Modeling and
Prediction as a Service (FMPaaS)
Cloud is committed to providing everything as a
service and QoS can provide multiple parameters
that are required by financial cloud computing
services. There are a number of QoS metrics to be
considered for FMPaaS. In our previous work
(Chang, 2014), we demonstrated the use of FMPaaS
in business intelligence applications and identified
six important factors. The importance of each factor
can be measured in the scale between 1 and 10. A
complete set of QoS factors that affects FMPaaS are
identified in Figure 1 and some which have been
validated in our earlier project on FMPaaS (Chang,
2014) and are summarized as follows:
Usability: Most of QoS APIs are easy to use
except one API requires further training. The
overall score is 8 because at least 80% of the
tools are easy to use and their manuals are self-
explanatory. The other 20% of the functionalities
require specialized knowledge about financial
modeling to compute complex models.
Performance: Performance on QoS is good.
Computation takes a short time to get results.
The score is 8.
Security: QoS needs third party software and is
not a model with a high level of security. Basic
authentication and authorization can still be
achieved. As a result, the score is 4.
Computational accuracy: Computational QoS
results are accurate. Some banks have used QoS
to calculate pricing and risks, and are close to the
actual values. But QoS requires have accurate
input values before getting the final results. This
level of dependency is a limitation to prevent it
to score 10. The overall score is 8.
Portability: QoS is highly portable in most of the
systems. All operating systems and
computational devices can run QoS applications.
The overall score is 9.
Scalability: QoS tools are highly scalable. It can
run on a single processor desktop, or clusters of
high-end servers. Input variables can be highly
adaptable to a wide range of values.
These scores for QoS are based on the results of
expert reviews of eleven experts. Follow-up
improvements are required to support the QoS
model.
Figure 1: QoS Metrics to Measure.
ESaaSA2015-WorkshoponEmergingSoftwareasaServiceandAnalytics
6

In addition to these well know parameters to
measure QoS, we have also defined a clear model
and equation to measure QoS in terms of satisfaction
of services on the fly. We highlight important factors
essential for QoS success, with more emphasis paid
on performance and accuracy. Referring to Figure 1,
a list of QoS parameters are used in our work to
evaluate service quality. We highlight important
factors essential for QoS success, with more
emphasis paid on performance and accuracy.
1.2 Our Approach in QoS for Financial
Modeling and Prediction as a
Service (FMPaaS)
In review of all the six factors influencing QoS, we
have already demonstrated the importance of
security in our papers (Ramachandran and Chang,
2014)
. In this paper, we will elaborate on these
factors, in particular performance and accuracy. The
reasons are as follows. First, literature presented in
Section 1.1 does not provide details in accuracy.
While SaaS is essential to sectors such as finance
and medicine which require an extremely high level
of accuracy, any errors or glitch may cause
damaging impacts. If FMPaaS calculates incorrect
results such as advising investors to buy a particular
stock with millions of pounds, or a reliable stock at a
particular instance with millions of pounds, they can
bear the consequence. This means that the emphasis
in QoS accuracy is essential for Cloud Computing.
Second, there is an increased demand to offer
accurate predictive services, since the inaccurate
results may cause financial loss, loss of company
reputation, loss of consumer confidence. This is a
type of QoS that have not been presented in the
research computing community. For example, if
they lose out million of pounds due to the
misleading predictive results from similar FMPaaS
services, it may result in bankruptcy (Lehman
Brothers), loss of reputation (UBS) and loss of
investors apart from the direct loss of money.
Similarly, simulations related to human bodies such
as brain, heart and vital organs are important to
determine the most likely scenarios for patients
receiving treatments for several years.
With regard to FMPaaS, one of our contributions
to QoS is the notion of service satisfaction index
which can be in-built as part of a service
specification. FMPaaS index allows users evaluate
services based on their merits in real scenarios and
also supports service reusability, a key benefit of
service computing. In reviewing all factors
contributing to QoS success, we focus more on
accuracy and performance to ensure that our
FMPaaS can provide as correct and swift as possible
for investors. We emphasize on the software design
approach for FMPaaS QoS and use one example to
illustrate our proof-of-concepts.
2 INANCIAL MODELING AND
PREDICTION AS A SERVICE
QoS
This section describes the system design for
Financial Modeling and Prediction as a Service
(FMPaaS) QoS, which is essential in a few
disciplines. For example, e-government applications
require open, flexible, interoperable, collaborative
and integrated architecture to provide services.
These services can be made available as stand alone,
integrated, componentized, web based service
component, composite service (a set of
interconnected services), virtualized services (cloud
based), and dynamically re-configurable services.
This vision is similar to the Open Group’s (2009)
Service Integration Maturity Model (OSIMM),
which provides:
A process roadmap for attaining key practices
with metrics
Seven levels of maturity to improve
A quantitative model for assessing current
practices and to improve with recommended
practices
As mentioned earlier section, service components
are useful to manage system complexity and reuse of
services during autonomous service composition.
The key challenge is to design a service component
that supports service characteristics discussed
earlier. A service component can be defined as a self
autonomous service which provides two sets of
services: provider business services and required
business services. The provider business service
(often shown with a lollypop notation and the
naming convention starts with I) is a set of services
offered to other services to compose where as the
required business services (often shown as a semi-
arc notation) are a set of services that are required by
this service in order to compose successfully. In this
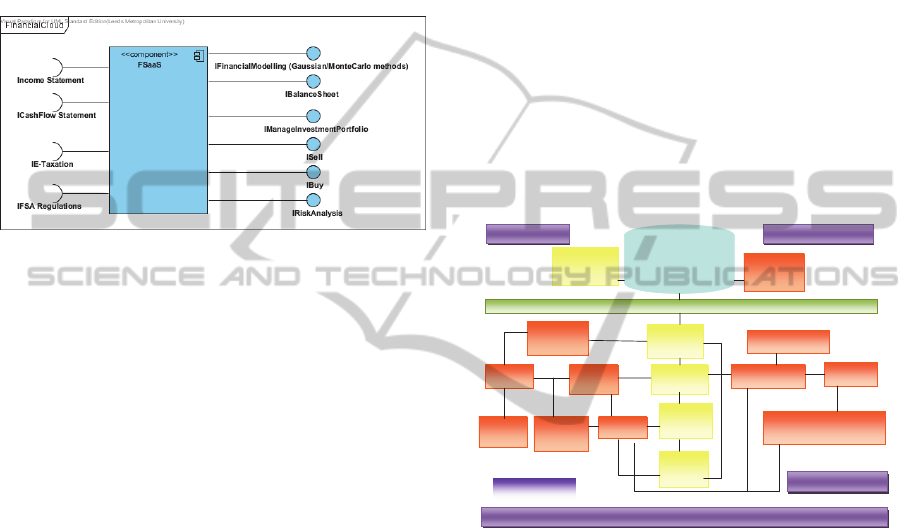
work, we have proposed a component model for
FMPaaS applications as shown in Figure 2, which
the required services include Income statement,
ICashFlow statement, Ie-taxation, IFSA regulations.
IFSA provides interface service integration for
Financial Authority regulations. Ay investment
QualityofServiceforFinancialModelingandPredictionasaService
7
service providers can integrate their work to this
FMPaaS service component model, which is
adaptable to regular updates in regulations. By doing
so, FMPaaS can provide scalability and flexibility
for financial analysts. These services can be made
available as stand alone, integrated, componentized,
web based service component, composite service (a
set of interconnected services), virtualized services
(cloud based), and dynamically re-configurable
services.
Figure 2: FMPaaS Service Component Model.
The next step in the design process is to design
service-oriented cloud architecture for FMPaaS
where all aspects of the corporate financial service
are integrated and composed based a set of SLA and
governance. The architecture presented in this paper
is based on a critical review and analysis of a
number of existing architectures for FMPaaS
applications. Further to this, the SOA based
architecture consists of four distinct levels of
abstraction layers which are connected and
communicated by messages through a core
communication channel known as a service bus or a
central bus. These layers are: 1) a business layer
with a dedicated set of services; 2) an orchestration
layer with a set of services where new services can
be composed; 3) an FMPaaS layer that supports
integration of services, government departments and
local governments, and 4) an e-business layer that
supports new businesses and integration of data. The
SOA based architecture for FMPaaS services, then
ensures that it achieves the expected service-oriented
design factors such as customization, cost-
effectiveness, availability, etc. The service-oriented
FMPaaS architecture is shown in Figure 3.
Referring to Figure 3, at the business and
orchestration layers provide high level service
composition based on new business perspective and
policies (both political and economical factors).
Mostly, the customization and the new business
needs arise from these two key variables. The sub-
systems such as registration control, security control,
integrated services for FMPaaS applications control,
and communications channels help to achieve
customization at a higher level of abstraction
without affecting underlying business logic services.
These are communicated and connected to layers
below using a concept of service bus known as
FMPaaS secured service bus. The layer below the
business layer provides services for various FMPaaS
departments, and external suppliers (E-Business
layer). Software components for large scale financial
cloud computing services require a detailed analysis
of the domain and its boundary in order to define a
collection of components for large scale financial
cloud computing services that are highly reusable
and scalable. A good SaaS design should introduce a
domain analysis process which allows us to define a
set of common definitions, domain classification,
domain boundaries, domain models, design artifacts,
and design guidelines that are based on those
domain criteria.
Finance &
Budget
Integration
Systems
Integration
Manager
Investments Portfolio
Management
Tax &
Accounting
Security &
Portal Mgnt
Financial
Projects
Integration
Stakeholders
Financial
Modelling
FSA Policy
Regulations
Service
Integration
Management
Government
Investments
Government
Projects
Integration
E-Financial Services
(e-invest, e-buy, e-sell, e-balanc e-
sheet, e-financial models, etc)
Investment
Companies
Integration
Integration Layer
Registration,
Authentication &
Security Control
Service
Communication
Channels
Secured FSaaS Service Bus
Integrated Financial
Institutions & Investments
Business Layer Orchestration Layer
FSaaSServicesLayer
Infrastructure Layer
Figure 3: Service-oriented Architecture for FMPaaS.
3 MODELS AND THEORIES
BEHIND FMPaaS
The current work on QoS (Lee et al, 2009;
Mukhopadhyay, 2012; Shehu et al., 2014) have
proposed a number of frameworks and are useful in
its own merits. However, they only have an
emphasis on other non-functional attributes and then
claim non-functional attributes as QoS parameters.
Similar to Albodour et al., (2012), our proposed
model is to provide commercial uses for research
institutes, financials services and general public who
are involved or interested in stock market analysis.
The main difference between our work and
Albodour et al. (2012) is that we use our own
development of work. We have developed a
comprehensive approach based on the development
ESaaSA2015-WorkshoponEmergingSoftwareasaServiceandAnalytics
8

of FMPaaS extended from our current work, which
aims to distinguish QoS attributes clearly; helps to
identify them from requirements to model financial
cloud and then validate services against those
attributes. These include the followings:
1. Based on the reputable models – the chosen
model is the Heston Model (which includes the
Wiener process and the Stochastic Volatility) and
the Visualization APIs to compute the best
pricing and risks for different scenarios.
2. Accuracy to compute and track volatility –
FMPaaS can track the movement of volatility
and help investors make a better judgment for
investment when prices are high and volatility is
low. Our FMPaaS can compute pricing and risk
values to several decimal places and also
calculate its mean, lower and upper range to get
our results as accurate as possible.
3. Performance – all calculations should be
completed within seconds to ensure all services
can be delivered in an acceptable time frame.
3.1 Models Used for FMPaaS
Models behind FMPaaS are essential for the
calculation, processing and presentation of financial
computation in the Cloud. Our previous work
explains all the associated models, including the
choice of the models, their associated formulas, how
they can be used in the development of FMPaaS. In
summary, models include (Chang, 2014):
1. Heston Model
2. Wiener Process
3. CIR (Cox, Ingersoll and Ross) Model
4. Runge–Kutta method (RKM)
The use of all the models for FMPaaS can match
accuracy and optimize the performance. The
summary of their descriptions is as follows.
3.1.1 The Heston Model
The Heston Model has a close relationship with
Black-Scholes model, since it relaxes the constant
volatility assumption in the classical Black-Scholes
model by incorporating an instantaneous short term
variance process (Albrecher et al., 2006). In other
words, the Heston Model can be used in a more
flexible way and is not as theoretical-oriented as the
classical Black-Scholes model does. In addition,
there are both the Wiener process and the CIR
process related to the Heston Model. Heston Model
has been explained in our previous work and it can
still be very useful for undertaking business
intelligence services and prediction of financial
modeling (Chang, 2014).
3.1.2 The Heston Model
The Wiener process is a stochastic process with
independent and stationary increments, which means
the motion of a point whose consecutive
displacements are independent and random with
each other. The Wiener process has Lévy
characterization has continuous martingale with W0
= 0 and quadratic variation [Wt, Wt] = t. This
implies that Wt2−t is a martingale (Cox et al., 1985;
Kloeden and Platen, 1999). The basic Heston model
assumes that S
t
, the price of the asset, is determined
by a stochastic process (Cox et al., 1985; Kloeden
and Platen, 1999). The Heston Model has a CIR
process involved, which is a Markov process with
continuous paths defined by the following stochastic
differential equation (SDE). The variable include
Wiener process (i.e., random walks) with correlation
ρ dt. The parameters in the Heston model for
providing input in the computation in Section 4
represent the following:
μ is the rate of return of the asset.
θ is the long variance, or long run average price
variance; as t tends to infinity, the expected value
of ν
t
tends to θ.
κ is the rate at which ν
t
reverts to θ.
ξ is the volatility of the volatility; as the name
suggests, this determines the variance of ν
t
.
3.1.3 The CIR Model
The CIR process is used to model stochastic
volatility in the Heston model, which aims to resolve
a shortcoming of the Black–Scholes model which
corresponds to the fact that the implied volatility
does tend to vary with respect to strike price and
expiry. By assuming that the volatility of the
underlying price is a stochastic process rather than a
constant, stochastic volatility can make it possible to
model derivatives more accurately (Cox et al., 1985;
Wilmott and Wilmott, 2006).
3.1.4 The Runge-Kutta Method
The Runge–Kutta method (RKM) is a technique for
the approximate numerical solution of a stochastic
differential equation (SDE) (Hull and White, 1987;
Wilmott, 2006). RKM can be used to generalize the
ordinary differential equation to SDE. To elaborate
further, the Ito diffusion X satisfying the following
Ito stochastic differential equation (Hull and White,
QualityofServiceforFinancialModelingandPredictionasaService
9

1987;
Wilmott and Wilmott, 2006). Details of
formulations can be referred to Chang (2014).
3.2 Methods for FMPaaS Calibration
This section describes methods for FMPaaS
calibration, which is used in a way that a known
observation of the dependent variables is used to
predict a corresponding explanatory variable. The
root-mean square error (RMSE) and Moving
Window (MW) are identified as the methods to
perform FMPaaS calibration.
3.2.1 The Root-Mean Square Error
The Root-Mean Square Error (RMSE) is used to
measure of the differences between values predicted
by a model or an estimator and the values actually
observed. RMSE also determines the goodness of fit
of the Heston Model presented by Cox et al. (1985)
and Hull and White (1987).
n
XX
RMSE
n
i
idelmoiobs
1
2
,,
)(
(1)
where n is the number of quoted options, X
obs
is
observed values and X
model
is modelled values at
time/place i. The parameters required for RMSE
include (ν
0,
κ, θ, ξ , ρ) used for calibration and ν
0
is
the instantaneous variance at the starting point.
Referring to formula (2), the rate of return of the
asset can be calculated by multiplying κ and
difference between θ and ν
0.
3.2.2 The Moving Window
The Moving Window (MW) estimate is a suitable
model in the use of VIX options, which are provided
daily to track market values of volatility. MV can be
computed as the mean of variance of the stock price
process over the time series window that moves
forward in time. MW is used to compute the
forecasted movement in the Heston Model.
3.2.3 Average Absolute Percentage Error
(APE) and Aggregated Relative
Percentage Error (ARPE)
The average absolute percentage error (APE) of the
mean price and aggregated relative percentage error
(ARPE) are additional formulas for calibration to
construct the best fit in financial computation, and
thus improves the accuracy and performance of the
calculations (Wilmott, 2006; Kloeden, and Platen,
2012; Guillaume and Schoutens, 2012). A limitation
with APE is that it may cause a problem. A few of
the series with a very high APE might distort a
comparison between the average APE of time series
fitted with one method compared to the average
APE when using another method. To overcome this
limitation, another model, aggregated relative
percentage error (ARPE) is used.
3.3 Services on Offer
This section explains two types of services on offer
for FMPaaS QoS. The architecture adopts the
private cloud at the University of London
Computing Centre (ULCC) data center and
Southampton clusters, where the processing took
place in ULCC. Two types of services are as
follows.
Heston Volatility and Pricing as a Service
(HVPaaS): The request started and completed at
Southampton clusters, including the processing
of the HVPaaS. The objective is to track
volatility and pricing simultaneously since both
can change significantly during the volatile
period. The metrics are provided by the
respective inputs of Heston model except
volatility, which is provided by VIX.
Business Analytics as a Service (BAaaS): After
analyzing the numerical computation of volatility
and pricing, the next step is to compute them as a
Business Analytic. This makes the analysis much
easier and the stakeholders can understand. After
the processing of HVPaaS completed in
Southampton, results are sent to ULCC in
London, where both sites can process BAaaS.
This service is regarded as the case of a complete
FMPaaS QoS.
Application Programming Interfaces (APIs) are used
to illustrate how to use these two services. In
BAaaS, it has two APIs as follows.
1. FinancialData API – this allows the BIaaS
Cloud to obtain financial data from Google
Finance and have all the major stock market
data, particularly the US and UK stock exchange
data.
2. TradingChart API – this allows the financial
data to be presented in the trading chart format
similar to the visualization services offered by
London Stock Exchange and Thomson Reuters.
Additional functions can allow analysts to use
the MW model to compute forecasted
movement. “TradingChart” is the API to
demonstrate both models (Heston and Financial
ESaaSA2015-WorkshoponEmergingSoftwareasaServiceandAnalytics
10
data) can work together to deliver an integrated
service. Results of the experiments will be
presented in Section 4.
3.4 Measurement of FMPaaS QoS
This section describes the measurement of FMPaaS
QoS, which aims to demonstrate the significance of
performance and accuracy. In terms of performance,
the execution time for all APIs should be recorded to
check their completion time is within seconds.
Experiments involved with multi-core and multi-
node processing are included to illustrate the
performance issue. To demonstrate accuracy, an
approach is to compare the predicted result from the
FMPaaS QoS with the actual results generated by
the market such as the New York Stock Exchange or
London Stock Exchange. The end results of these
APIs, particularly the TradingChart API (the last one
of all FMPaaS services), can correspond to the
predicted results of the FMPaaS analysis. The actual
results can be imported directly from Google
Finance. The difference between the actual and
predicted results can correspond to the percentage of
accuracy. The objective is to maintain all differences
within 5% difference to ensure a high quality of
accuracy to be achieved.
4 ACCURACY TESTS AND
RESULTS OF PERFORMING
FMPaaS QoS SIMULATIONS
This section describes the accuracy tests of the
selected stocks listed on the New York Stock
Exchange. Some of these selected stocks are the
continuation of our previous study which analyzed
stocks between mid-May 2012 and early July 2013.
Hence, we will analyze the stocks between early
July 2013 and mid-May 2014. Additionally, some of
the new selected stocks such as Citi and GE are used
to analyze the accuracy of FMPaaS results. Our
previous work has shown the stocks of Facebook,
Apple, IBM and Microsoft between mid-May 2012
and end of June 2013 and these four stocks are used
again for FMPaaS analysis.
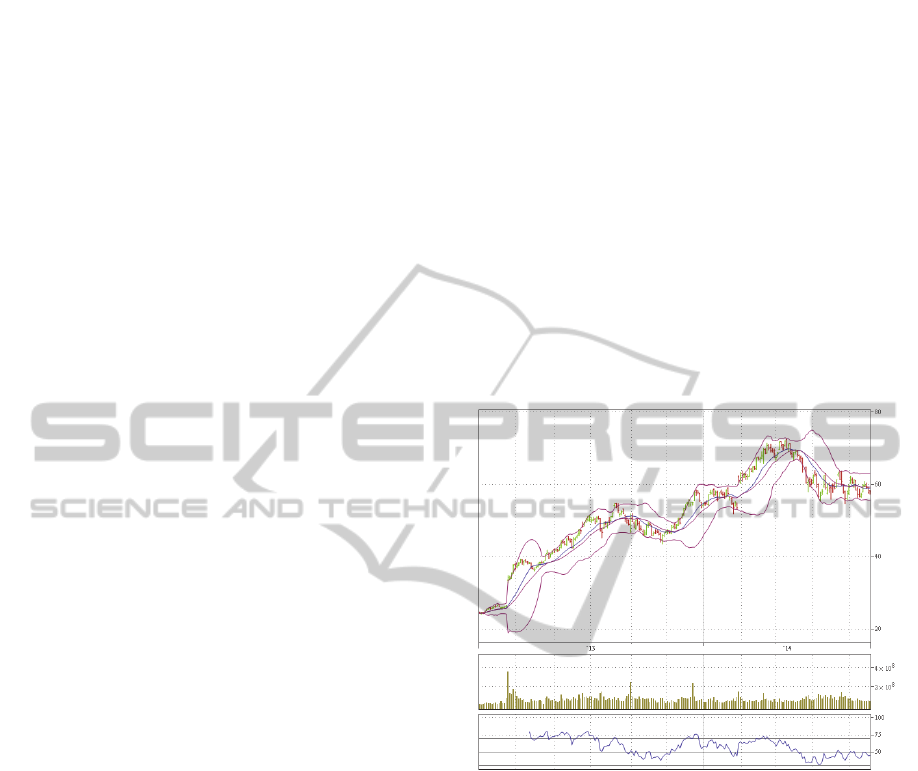
4.1 The Overview of the FMPaaS
This section presents the overview of the FMPaaS,
including the end results of the analysis shown in
Figure 4. The first section of Figure 4 is the main
area of FMPaaS QoS, where the y-axis shows the
price and the x-axis shows the time scale. There are
upper and lower lines, which are predicted indexes
based on the stock values every ten minutes ago. As
explained in our previous work, both upper and
lower limits offer 95% of confidence interval (CI)
for the predictive modeling. The purple line in the
middle is the baseline based on the prediction. The
blue line in the middle is the predicted value line
based on the values given 10 minutes ago and
without using the 95% CI approach. The second
section represents the trading volume. The third
section represents the relative strength index, which
means how active the stock movement is compared
to 50 as the baseline. In this case, we are only
concerned about the first section, the accuracy and
performance of the actual and predicted index
movements.
Figure 4: The full FMPaaS result showing Facebook stock
prices, volume and relative strength between 2 July, 2013
and 16 May 2014
4.2 Performance Test: The
Experiments with APIs
As explained in Section 3.3, development of APIs is
essential for FMPaaS to measure the effectiveness of
QoS. Our previous work also demonstrates the use
of two APIs, “FinancialData” and “TradingChart”,
which display the outputs of FMPaaS based on the
calculation and computation of formulas presented
in Section 3. The outputs measure the following two
items:
The status of the return, which are the prices of
the assets at the times that sales are intended;
Volatility, which represent the variable market
risk associated with the sale or buy activities.
Experiments with these two APIs are important
QualityofServiceforFinancialModelingandPredictionasaService
11

since they will determine the performance of
generating results and accuracy of the results
received. To present the results of experiments, the
hardware specifications are described in Section
4.2.1. Steps and processes involved with two
experiments are then presented in Section 4.2.2 and
4.2.3 respectively.
4.2.1 Infrastructure Used for Experiments
University of London Computer Center (ULCC) was
used for the experiments. ULCC has advanced
Cloud and parallel computing infrastructure and
network attached storage (NAS) service. It has
CPUs totalling 30 GHz, 60 GB of RAM and 12 TB
of disk space for experiments. Fiber optic network
offering the 10 Gb network speed was used for
experiments. The network was connected to the first
private clouds based at Greenwich, which has a total
of 9 GHz CPU and 20 GB RAM. The infrastructure
at ULCC is also connected to the second private
cloud based at the University of Southampton,
which have 6.0 GHz and 16 GB RAM in place.
There is the third private cloud based at the author’s
venue at Southampton, which has the capability is
24.2 GHz CPU and 32 GB RAM. All the three
private clouds located in Greenwich and two places
at Southampton have been connected to ULCC
through the fast fiber optic networking and the
VMWare infrastructure. Before experiments took
place, preliminary work had been tested and all the
outputs could be successfully computed. The
distance between different private clouds did not
make a difference in the execution time during the
preliminary phase of the experiments.
4.2.2 Execution Time for a Single API
Processing
This section presents results of processing each API
in two settings. The first experiment was undertaken
between the two private clouds at Southampton. The
second experiment was undertaken while utilizing
both the Southampton and ULCC clouds. In other
words, results should be sent to ULCC for
processing and returned back to Southampton. The
execution time is the total time of processing
mathematical modeling on the APIs on the server
and response time to the client. The first experiment
was expected to take less time due to the shorter
distance. All experiments were conducted five times
with the mean values taken as the execution time
and the standard deviation was the difference
between the highest and lowest values. The results
of API experiments were presented in Table 1.
Table 1: The execution time for each API or process in the
local environment (p < 0.005).
API or process
Southampton
execution time
(sec) and standard
deviations
ULCC: execution
time (sec) and
standard deviations
FinancialData 2.04 (0.10) 2.12 (0.12)
TradingChart 1.11 (0.03) 1.19 (0.06)
4.2.3 Execution Time for 100,000
Simulations of API Processing
Results in Section 4.2.2 show the average execution
time of one simulation per API processing. To test
the performance, the large-scale simulations are
required (Guillaume and Schoutens, 2012). Our
FMPaaS can offer up to 100,000 simulations per
service to test the scenarios that if there are 100,000
service requests happen every second, whether our
FMPaaS can still provide services smoothly without
degrading the service. The aim of this experiment is
to demonstrate that our FMPaaS can support
100,000 service requests and achieve a good
execution time. Availability was 100% at the time
that those experiments were taken, with the network
and VMs working in excellent conditions. All the
experiments were taken five times with the mean
values taken as the execution time and the standard
deviation was the difference between the highest and
lowest values. Results are presented in Table 2.
100,000 simulations on the API could be completed
in 200,645 seconds, or 55 hours, 44 minutes and 5
seconds.
Table 2: The execution time for 100,000 simulations of
API processing in the ULCC (p < 0.005).
API or process
Southampton
execution time
(sec)
and standard
deviations
ULCC: execution
time (sec) and
standard deviations
FinancialData 200432 (488) 200645 (499)
TradingChart 110135 (417) 110348 (429)
All the standard deviations are below 0.5% of the
average execution time for all six APIs. The aim for
this experiment is to demonstrate that in the event of
having 100,000 requests from users in real-time,
how the FMPaaS can respond to all the processing.
Results also show that FMPaaS can cope with
100,000 requests.
4.3 Accuracy Test
This section describes the accuracy test by using
Facebook as an example to illustrate. The focus is to
ESaaSA2015-WorkshoponEmergingSoftwareasaServiceandAnalytics
12
demonstrate accuracy and performance of using
FMPaaS analysis. The execution time of performing
this FMPaaS test is 3.15 seconds, which correspond
to the sum of processing “FinancialData” and
“Tradingchart” APIs. We identify three major points
where the predicted asset prices would be compared
directly with the actual prices. The reason was that
since price values could change all the times,
identifying the points for comparison was useful.
Additionally, this can ensure prediction to be more
focused on the end of the trading activities since
they could receive more investors’ attention.
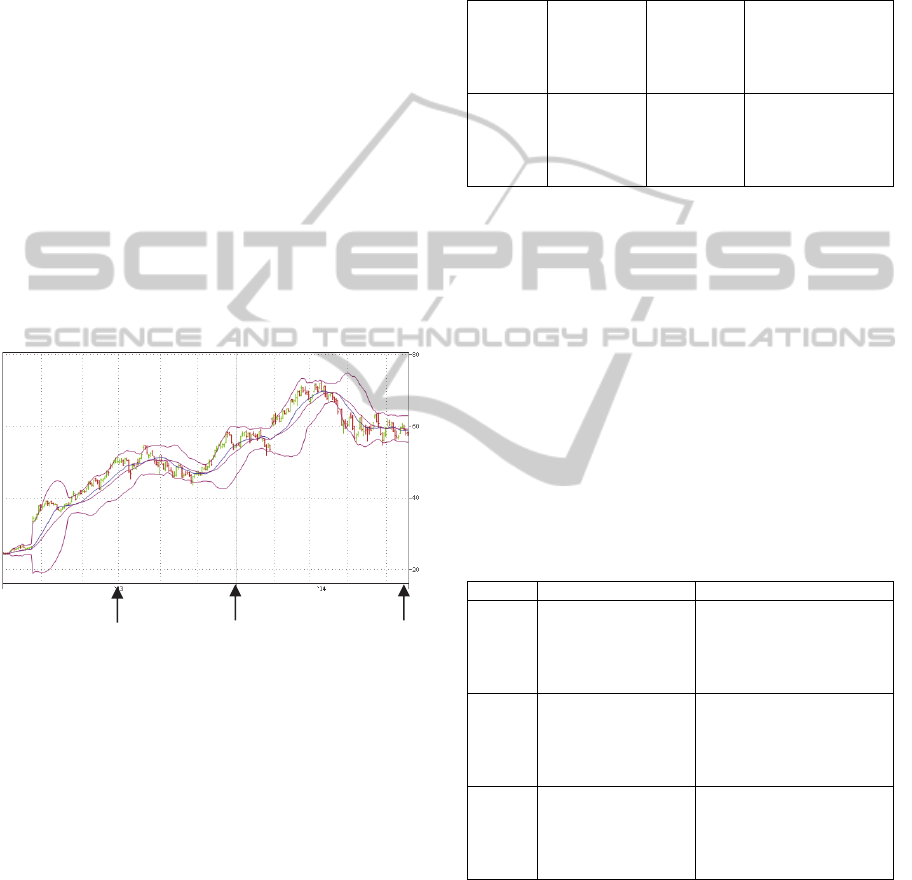
Two types of accuracy tests are presented. The
first test is focused on the overall level of accuracy,
whether all the actual values fall into the upper and
lower predicted values within the range of 95%
confidence interval (CI). The second test is based on
three selection points where the trading activities are
at the end of the quarterly business review, or at
three obvious points in the FMPaaS result. In Figure
5, points 1, 2 and 3 are chosen due to the location of
these points to be checked and noticed easily.
Figure 5: The FMPaaS result showing Facebook stock
prices between 2 July, 2013 and 16 May 2014.
Table 3 shows the results of the overall accuracy
test. We count the number of datapoints falling
outside the 95% CI divided by the total number of
datapoints. The results show that about 97% of the
actual datapoints, or actual values of Facebook index
movements, fall within the 95% CI predictive range.
Among those 3% falling outside the predicted range,
there is one spot with a red arrow. This happened
because Facebook was reported to have more profits
than their analysts’ forecasted results. However, the
market had the mixed reactions in the first few days,
which resulted in numerous selling and buying
activities. Those who bought thought that Facebook
would have a better value at some point. Those who
sold thought that it was a time to get their
investment back. This explains why our forecasted
values slightly deviate from the actual values.
Additional calibration can be used to compute the
forecast price values and volatility for the three
points, where the results can then be used to
compare with the actual values for the accuracy.
Table 3: The test of the overall accuracy for Facebook.
Items
Falling
within 95%
CI lines
Percentage
falling
outside
95% CI
lines
Significant spots
falling outside 95%
CI lines
Actual
values
Yes. 97%
of actual
values are
within the
range.
About 3%
Profits were more
than their predicted
results between
2013/2014
forecast.
To determine the accuracy test, asset prices of
the predicted values (input values by Heston model
and VIX and computed by models in Section 3) are
directly compared with the actual values. See Table
4 for results. Asset prices computed by the predicted
value are close to their respective actual values in
points 1, 2 and 3, ranging between 93.72% and
99.63% accuracy. Points 2 and 3 have extremely
high accuracy and point 1 has an acceptable level of
accuracy. The likely reason is that the asset price
prior reaching point 1 was on the way up to one and
a half months and it was less predictable to forecast
the asset price values on the way up in point 1.
Table 4: The test of the three selection point accuracy for
Facebook.
Items Actual value Predicted value
Point 1
Asset price = 50.15;
volatility = 1.20;
implied volatility =
0.45; time = 0.3
Asset price = 47.00;
volatility = 1.20; implied
volatility = 0.45; time =
0.3. 93.72% same as the
actual value
Point 2
Asset price = 53.30;
volatility = 0.5;
implied volatility =
0.45; time = 0.6
Asset price = 53.70;
volatility = 0.5; implied
volatility = 0.45; time =
0.6. 99.26% close to actual
value
Point 3
Asset price = 59.01;
volatility = 0.5;
implied volatility =
0.35; time = 1.15
Asset price = 59.23;
volatility = 0.5; implied
volatility = 0.35; time =
1.15. 99.63% same as the
actual value
4.4 Discussion
The benefits of adopting FMPaaS are as follows.
First, FMPaaS have focused on improving the
accuracy for the financial modeling and prediction
as demonstrated in the test results. This can also
provide new and alternative services for forecasting
and investment analysis. Second, FMPaaS can
point 1
point 2
point 3
QualityofServiceforFinancialModelingandPredictionasaService
13

provide positive impact to the stakeholders and
potential investors to understand the market
performance, volatility, trading volume and likely
predicted movements of their chosen stocks. These
two aspects of contributions will help the
stakeholders, potential investors and research
community to understand the market much better.
The benefits offered by FMPaaS are relevant to the
themes of Emerging Software as a Service and
Analytics to allow the community to know an
improved and better Cloud SaaS services being
validated and illustrated with reported contributions.
The next phase of challenges is to improve the
overall level of accuracy from 95% to 98% and
above; improve the point accuracy as close as to
99.99% and raise three points of evaluation and
testing to six points to ensure there is a greater
coverage of accuracy tests.
5 CONCLUSION AND FUTURE
WORK
A large number of QoS papers focus on the
hardware infrastructure and Service Level
Agreement with the lack of explanation and further
development for SaaS. We explain the motivation
and significance of QoS for FMPaaS, which is our
main service for finance and business intelligence.
Six factors for delivering FMPaaS QoS have been
illustrated, where the emphasis for this paper is on
performance and accuracy. We first start with the
design process and methodology for FMPaaS, and
then explain the theories behind FMPaaS. APIs are
provided in the FMPaaS, where “FinancialData” and
“TradingChart” are the two APIs that have been
developed and then used in the experiments for
performance tests. Two types of experiments were
conducted. First, each API was tested five times top
get the mean execution time to generate outputs. All
execution time was completed within 2.12 seconds.
Second, large scale of 100,000 simulations was
performed to test whether APIs can provide real-
time services. Results show that 100,000 simulations
on the API could be completed in 200,645 seconds,
or 55 hours, 44 minutes and 5 seconds with a low
percentage of standard deviations. Accuracy had
been conducted to test the differences between the
predicted and actual values. Three points of
comparisons for Facebook stock were used for
accuracy test since they represented the end of all
transaction activities. Results show that accuracy
tests had between 93.72% and 99.72% of accuracy
while comparing the actual and predicted values of
the asset prices of Facebook stock. Our future work
will include the improvement of our performance
and accuracy tests. We will also use more companies
to illustrate that our FMPaaS can provide better
services and accuracy while comparing the actual
and predicted values of asset prices.
REFERENCES
Accenture, 2011, Accenture Financial Trends slides,
http://www.slideshare.net/fullscreen/ramblingman/acc
enture-financial-saa-s-external-presentation-final/3,
accessed on April 2014.
Albodour, R., James, A., N. Yaacob, 2012, High level
QoS-driven model for grid applications in a simulated
environment. Future Generation Computer Systems,
28(7), 1133-1144.
Albrecher, H., Mayer, P., Schoutens, W., and Tistaert, J.,
2006, The Little Heston Trap, Technical paper,
September.
Cantor, M. and Royce, W., 2014, Economic Governance
of Software Delivery, IEEE Software, 31(1).
Chang, V., 2014. The business intelligence as a service in
the cloud. Future Generation Computer Systems, 37,
512-534.
Cox, J.C., Ingersoll J.E. & Ross, S.A. 1985, A Theory of
the Term Structure of Interest Rates, Econometrica 53:
385-408.
Durrett, R., 2000, Probability: theory and examples, 4th
edition. Cambridge University Press, ISBN 0-521-
76539-0.
Guillaume F., and Schoutens, W., 2012, Calibration risk:
Illustrating the impact of calibration risk under the
Heston model, Review of Derivatives Research,
15:57–79.
Hull, J., and White, A., 1987, The Pricing of Options on
Assets with Stochastic Volatilities, The Journal of
Finance, 42(2).
Lee, J. Y., Lee, J. W., Cheun D. W. & Kim S. D., 2009,
QoS A Quality Model for Evaluating Software-as-a-
Service in Cloud Computing, the Seventh ACIS
International Conference on Software Engineering
Research, Management and Applications.
Kloeden, P.E, Platen, E., 1999, Numerical Solution of
Stochastic Differential Equations. Berlin: Springer.
ISBN 3-540-54062-8.
Mukhopadhyay, D., Chathly, F. J., Jadhav, N. N., 2012,
QoS Based Framework for Effective Web Services in
Cloud Computing, Journal of Software Engineering
and Applications, 5, 952-960.
NetSuite, 2014, white paper and software, product
http://www.netsuite.co.uk/portal/uk/seo-landing-
page/accounting-2/main.shtml?gclid=CLK9k5q-
37sCFTHLtAodikoAzw, accessed on April.
Open Group, OSIMM, 2009, from https://
www2.opengroup.org/ogsys/jsp/publications/Publicati
onDetails.jsp?publicationid=12450, Retrieved Oct
2013.
ESaaSA2015-WorkshoponEmergingSoftwareasaServiceandAnalytics
14

Ramachandran, M., Chang, V., 2014 Cloud Security
proposed and demonstrated by Cloud Computing
Adoption Framework, the first international workshop
on Emerging Software as a Service and Analytics,
Barcelona, Spain, 03 - 05 April.
Schulze, B., Coulson, G., Nandkumar, R., Henderson, R.,
2006, Special Issue: Middleware for Grid Computing:
A ‘possible future’, Concurrency and computation:
practice and experience, 10.1002/cpe.1132, Wiley.
Shehu, U., Epiphaniou, G., Safdar, G. A., 2014, A Survey
of QoS-aware Web Service Composition Techniques,
International Journal of Computer Applications (0975
– 8887), 89(2), March.
Silvestri, F. et al., 2006, Toward a search architecture for
software components, Journal of Concurrency and
Computation: Practice and Experience: 18:1317-
1331.
Wilmott, P., 2006, Paul Wilmott on quantitative finance,
Wiley (2nd ed.), ISBN 0470018704.
QualityofServiceforFinancialModelingandPredictionasaService
15
