
A Renewable Source Aware Model for the Charging of Plug-in
Electrical Vehicles
Jânio Monteiro
1,2
and Mário S. Nunes
1
1
INESC-ID, Lisbon, Portugal
2
ISE, University of Algarve, Faro, Portugal
Keywords: Smart Grids, Plug-in Electrical Vehicles, Charge Scheduling, Renewable Sources.
Abstract: The number of Electric Vehicles is estimated to continuously rise over the next years. While this trend is
expected to lead to a reduction in CO
2
emission, existing electrical grids have not been planned to support a
large number of electrical vehicle’s batteries charging simultaneously. The integration of distributed
production using renewable energy sources is seen as a solution to meet the requirements of battery
charging. Renewable sources are however affected by variation and lack of predictability, due to the
environmental factors they depend on, which are the cause of inefficiencies and mismatches in the required
demand-response equilibrium. In these conditions, the model and the associated scheduling algorithms to
use in medium to large charging parks play an important role, due to the implications it has in their
operational costs and in the maximization of the return of investments made in renewable sources. In this
paper we propose and evaluate a charging model that engages users to participate in demand response
measures, by giving them the ability of selecting two energy components for the charging of their electrical
vehicles, one of which varies according with the variable nature of renewable sources. Based in this model
we propose one scheduling algorithm and compare it with several other solutions, demonstrating that the
proposed solution is able of achieving a significant cost reduction with significant low computational
complexity and processing times, while achieving a high ratio of renewable energy usage.
1 INTRODUCTION
As the number of Plug-in Electrical Vehicles (EVs)
is expected to rise over the next years, electrical
grids have to prepare to accommodate a potential
large number of such vehicles (Wansart and
Schnieder, 2010). Legacy distribution grids
however, are far from reaching that capability. In
fact, several studies held in several countries show
that current electrical grids do not tolerate EV
penetration rates above 5-15% (Lopes et al., 2011).
In order to adapt these grids to this trend, several
measures should be considered, including an
increase in production and implementing the
scheduling of battery charging to avoid simultaneity.
In terms of production, the introduction of
Distributed Energy Resources (DER) in the
distribution grid, especially those that use renewable
energy sources, is seen as an opportunity to reduce
CO
2
emissions. These power sources however are
sometimes characterized as Intermittent Resources
(IRs), because they depend on environmental factors
which make them vary significantly over time and
difficult to predict with accuracy.
In order to reduce the mismatches between
production and consumption several solutions can be
considered, including Demand-Response (DR) and
energy storage. The introduction of these solutions
can, not only reduce the investments needed in
renewable sources, but also accelerate its return, by
maximizing its utilization.
The usage of batteries to support energy storage
enables a higher flexibility in the control of loads,
but comes with the drawback of introducing
efficiency losses, higher investment costs and
maintenance expenses due to battery lifecycles. In
terms of EV batteries, the costs associated with the
reduction of battery lifecycles show that feeding
electricity back into the grid is only justified in very
limited time frames and scenarios (Link et al., 2010).
However, EV batteries can still play an important
role if they adapt their charging rates according with
the production obtained from renewable sources.
Thus, if correctly managed, electric vehicles can be
51
Monteiro J. and Nunes M..
A Renewable Source Aware Model for the Charging of Plug-in Electrical Vehicles.
DOI: 10.5220/0005459000510058
In Proceedings of the 1st International Conference on Vehicle Technology and Intelligent Transport Systems (VEHITS-2015), pages 51-58
ISBN: 978-989-758-109-0
Copyright
c
2015 SCITEPRESS (Science and Technology Publications, Lda.)

used to increase electrical grid stability.
In this paper we address the problem of
scheduling the charging of a large number of plug-in
electrical vehicles in public parking facilities. As
input, a centralized EV aggregator obtains, from
each vehicle driver, the information about the
amount of energy that needs to be allocated to its
individual EV and the expected deadline for
charging completion. Given these targets the aim of
the charging operator is to run a scheduling
mechanism that reduces the cost of the electricity
bought to a Distribution System Operators (DSO),
taking into consideration different tariff rates and the
local production obtained from renewable sources.
Some papers have already addressed some of the
problems faced by EV charging. Among them, in
(Link et al., 2010; Schmutzler et al., 2011),
algorithms are presented that adjust the charging of
EVs taking into consideration tariff rates, together
with local and grid level power limitations. For
instance, in (Schmutzler et al., 2011) the power that
is used for charging of electric vehicles is made to
vary inversely with a cost indicator, which in turn
reflects the tariff rates and/or the power obtained
from renewable sources. The proposed model
considers that the power availability from distributed
generation and renewable sources is reflected in
price variations. This model however does not
consider that local generation from renewable
sources is available at the charging premises.
In (Sundström and Binding, 2010) the authors
present and evaluate an optimization algorithm for
the charging schedule of EVs managed by a fleet
operator. The algorithm considers constrained grid
conditions and uses driver historical trip data to
forecast energy requirements for EV usage.
In (Chen et al., 2012) the authors address an
algorithm that formulates the charging problem
using a threshold test for admission control and a
greedy algorithm for scheduling. While the proposed
algorithm already considers local production from
renewable sources it deals with renewable sources
variability considering the option of non-completion
penalties when a reservation is not assured.
In this paper we present and evaluate a charging
model and associated scheduling algorithm to apply
to battery charging of electrical vehicles that is able
of optimizing the scenarios where local generation is
available and also those where it isn’t. Different
from (Chen et al., 2012) we consider that any EV
entering the charging premises communicates the
deadline for charging completion and two amounts
of charging energy levels, one guaranteed and
another non-guaranteed. The guaranteed part needs
to be authorized by an admission control procedure
when an EV enters the charging premises. The non-
Guaranteed part builds an eco-friendly solution
which assures that the EV will be charged using only
renewable sources.
The rest of the paper has the following structure.
Section 2 introduces the factors involved in EV
charging with renewable sources. Section 3 presents
the proposed optimization model. Section 4
describes the implemented simulation platform and
the obtained results in different scenarios. Finally
section 5 concludes the paper.
2 CONTEXT
A model for the charging of plug-in electric vehicles
needs to consider several factors including power
variability, electricity tariffs, electric circuit
constraints, while reflecting user requirements and
its assessment.
The variability associated with renewable power
sources makes the dynamic adjustment of demand
difficult to implement, especially when non-elastic
loads are being used. Also, these variations are
difficult to predict with accuracy, affecting the
efficiency of the scheduling algorithms that decide
when loads should work. In other to assure a
continuous supply, the power generated from these
sources is normally combined and complemented
with the power obtained from distribution operators
and paid according with their tariff rates.
In terms of tariffs, the forecasted supply and
demand data is already being mapped to electricity
prices paid by Distribution System Operators, as for
instance happens in (OMI-Polo Español S.A., 2010).
In some countries dynamic tariffs are also being
introduced at the client level (Utility-Scale Smart
Meter Deployments, 2011), because constant tariff
rates have shown not correlate with the marginal
costs of production (Joskow and Wolfram, 2012).
While load scheduling has been until now made
non-automatically, the introduction of automatic
management systems could cause demand hikes at
low price periods, causing a disruption of supply,
due to overloading. Thus, the definition of a charge
schedule management system should also take into
consideration local (Electrical installation guide,
2013) and grid level (Rolink and Rehtanz, 2011)
electrical circuit constraints. These constraints are
normally presented in the form of simultaneity
factors (fs) (Electrical installation guide, 2013;
Rolink and Rehtanz, 2011).
Finally, a model that implements charge
VEHITS2015-InternationalConferenceonVehicleTechnologyandIntelligentTransportSystems
52

Figure 1: Assumed user’s quality assessment function in
response to the battery level of their Electric Vehicle.
scheduling should consider human requirements and
its final assessment. In terms of requirements, some
studies like (Mobilität in Deutschland, 2010), enable
the modelling of EVs charging behaviours using
mobility information of cars.
The assessment of the EV supply equipment
derives partially from the charge level of the EV
battery when compared with the energy required for
the next trip. As far as we know, there are no studies
that translate the subjective assessment of EV users.
Basically we can assume that above a certain battery
charging limit (E
min
) users can tolerate different
battery charging levels, as they have little impact in
their mobility. On the contrary, if, after a charging
period, the battery level of an EV is lower than E
min
,
the subjective evaluation of the scheduling
mechanism will show dissatisfaction. Such
subjective evaluation curve is shown in Figure 1.
In order to reflect these factors in the following
we define a model that considers two charging
levels.
3 PROPOSED CHARGING
MODEL
Given the above mentioned constraints, we now
define a model for the charging of Electric Vehicles
that comprises two thresholds. These energy
components are:
Guaranteed Energy part (E
G
)– comprises the
minimum guaranteed amount of energy that the
user requests to be supplied to a specific EV
until the end of the charging period;
Non-guaranteed Energy part (E
N
)– an amount
of energy allocated to the EV that will only rely
on renewable sources and thus depends on the
power generated locally and its availability.
The first level assures the minimum energy level
that a user expects to find in battery, after a given
charging period. It corresponds to the E
min
of figure
1. Above that limit, the EV supply equipment will
only rely on renewable energy power to charge the
EV battery, up to its maximum capacity. Thus the
total energy requested by an EV (
) is given by:
(1)
The Non-guaranteed Energy part introduces
flexibility into the charging process, since the
resulting charge energy can vary according with the
intermittent power generated by renewable sources.
When the power produced by renewable sources
surpasses the forecasted power, EV batteries are
used to store excess production, reducing the need
for non-vehicle batteries at premises.
Users can select the amount of energy they
request for each of the components, taking into
consideration that the Non-guaranteed Energy part
uses a 100% eco-friendly power. The Non-
guaranteed Energy part is also expected to be paid
with a lower tariff motivating them to use it as much
as possible.
Figure 2: Power distribution between the Renewable
Energy Sources and Guaranteed and non-Guaranteed
Energy requests.
3.1 Mathematical Formulation
As represented in Figure 2, the Guaranteed Energy
part is assured through two power components: an
electrical grid component (C
vt
) plus a renewable
source component (P
gvt
). As for the non-Guaranteed
Energy part, it only makes use of renewable power
(P
nvt
).
For each electric vehicle v, a minimization of the
objective function (2) should be met, by selecting
the charging level C
vt
within [t
vpi
,t
vpf
] of EVs, in
order to minimize the sum of all costs paid to the
DSO, according with the set of tariff rates T
p
.
(2)
The minimization of equation (2) is subject to
several conditions:
ARenewableSourceAwareModelfortheChargingofPlug-inElectricalVehicles
53

i) Each charging request from a newly arriving EV
needs to pass through an Admission Control
procedure that verifies if the Guaranteed part of the
requested energy can be assured. Thus, at any given
time instance t, the sum of all guaranteed charging
powers may not exceed the maximum power of the
whole parking facility:
(3)
Equation (3) assures that the Guaranteed Energy part
will never fail in case an unexpected reduction of the
renewable source power is verified.
ii) Also, at each time instance t, the sum of power
allocated to each electrical vehicle v, from both
electrical grid and renewable sources cannot exceed
the EV maximum charging power (P
vt
):
(4)
iii) Equation (5) assures that for each electrical
vehicle v, the Guaranteed Energy part is fulfilled:
(5)
iv) A maximization of the non-Guaranteed charging
energy should be met, constrained by the maximum
power requested by the vehicle driver:
(6)
In order to assure the maximization of the utilization
of renewable energy, as expressed in equation (6) a
negative cost is applied to renewable energy
utilization, and thus a virtual cost reduction in terms
of optimization algorithm is verified when using that
scr= sort charging requests starting
by soonest leaving hour
for each non allocated scr
allocate renewable energy for
the guaranteed part (E
G
)
until exhaustion
for each non allocated scr
allocate DSO energy for the
guaranteed part (E
G
) starting
by the lowest tariff that
still has available energy
for each non allocated scr
allocate renewable energy for
the non-guaranteed part (E
N
)
until exhaustion
Algorithm 1: Adapted EDF algorithm according with the
proposed model.
energy.
Finally, when all the above criteria are met, the
scheduling algorithm should try to assure the
charging of the Guaranteed Energy component as
quickly as possible, as a variable number of new
vehicles will arrive later to the park.
3.2 Scheduling Algorithms
Given the restrictions presented in last subsection,
we will now test four main methods of charge
scheduling, including two benchmark algorithms
such as First-Come/First-Serve (FCFS) and Earliest
Departure First (EDF) plus a Linear Programming
(LP) optimization solution and a Gradual model.
As a first solution we have considered a First-
Come/First-Serve (FCFS) algorithm, where, at each
time interval t, the available power (including the
one obtained from renewable sources) is allocated to
EVs until its exhaustion. In this case, EVs are
charged by the order of arrival, considering that, at
all time instants the maximum power obtained from
the DSO is constant and cannot surpass a pre-
defined power limit (P
max
).
The EDF algorithm was adapted to the model
considered in this paper, being summarized in
Algorithm 1. In the following we will refer to this
algorithm as Adapted EDF (AEDF).
As in the FCFS solution, in the Gradual
algorithm we have considered that EV battery
charging occurs by their arriving order but, in a
process similar with the one described in
(Schmutzler, Wietfeld, Jundel, Voit, 2011), the
charging power (P
max/TARIFF(t)
) varies inversely with
the tariff cost. In this case, we have considered that
the maximum charging power of all EVs in the
charging facilities is given by:
/
.1
(7)
where P
max
refers to the maximum power that can be
obtained from the higher level operator/circuit,
Cost(t) refers to the tariff cost for the time instant t,
and DayCost
min
and DayCost
max
correspond
respectively to the minimum and maximum intra-
day tariff prices.
Finally, the Linear Programming optimization
model takes into consideration several parameters
shown in Figure 3. The objective function of the
model aims at minimizing costs, subject to the
constraints presented section 2.2.
Given the aforementioned algorithms, next
section will outline the implemented simulation
VEHITS2015-InternationalConferenceonVehicleTechnologyandIntelligentTransportSystems
54
platform and the tests performed.
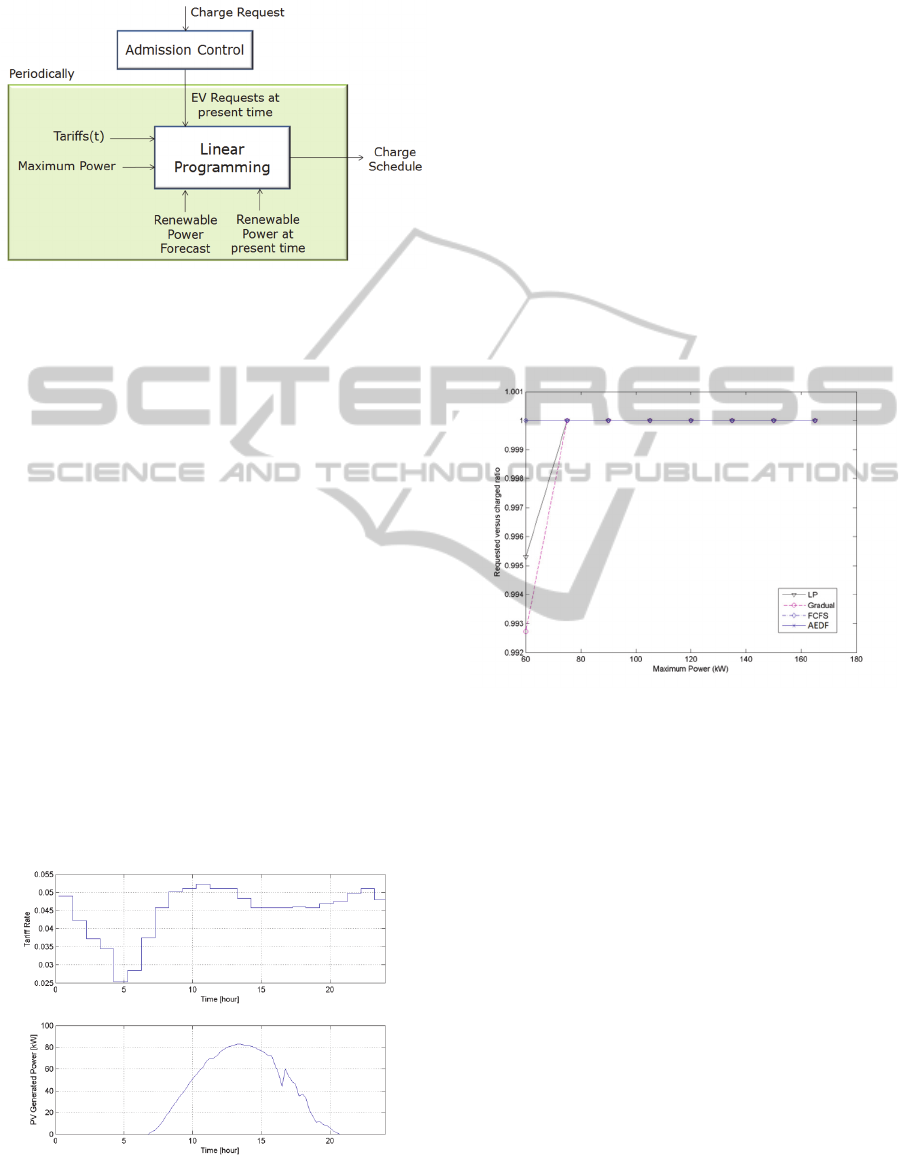
Figure 3: Diagram of the Linear Programming
optimization module.
4 SIMULATION PLATFORM AND
RESULTS
In the following we describe a set of simulations
considering a parking facility with a maximum of 50
charging stations. The maximum charging power of
each EV (i.e. P
vt
) was set to 3 kW.
Figure 4 presents the considered tariff rates,
obtained from (OMI-Polo Español S.A., 2010) for
the 1
st
of August 2013 and the generated power (in
kW) obtained from renewable energy sources (for
the same day, measured in the south of Portugal)
considering a peak production of 83 kW. The grid is
simulated using a discrete-event simulation with
time slots of 15 minutes.
We considered that EVs arrive to the parking
station according to a Poisson distribution with mean
9 (i.e., 9 a.m.) and the duration of the charging was
made to vary according with a normal distribution
with mean 6 (hours) and standard deviation of 4
Figure 4: Tariff prices (upper part) and power generated
using photovoltaic panels (bottom) in August, 1st, 2013.
hours. To model the total energy requested by each
EV we have also considered a normal distribution
with mean 10 (kWh) and standard deviation of 4
(kWh).
4.1 Scenario 1
In the first scenario we considered that no renewable
energy sources were available at the charging
premises and that all charging requests were
guaranteed.
As the maximum power received from a DSO is
an important parameter that is expected to be
minimized, we have evaluated how different values
of P
max
, ranging from 60 kW (f
s
=0.4) to 165 kW
(f
s
=1.1) in steps of 15 kW contribute to the
efficiency of each algorithm.
Figure 5: Ratio of EV requests that were fulfilled when not
using renewable energy sources.
Figure 5 presents the obtained results in terms of the
ratio of EV requests that were fulfilled (as P
max
varies). As can be verified, when P
max
was equal to,
or higher than, 75 kW all the algorithms were able of
fully assuring the requested energy quantities.
However under 75 kW only the FCFS and AEDF
algorithms were able of fully charging all vehicles.
These results reflect an important issue. A higher
degree of freedom should be given to the algorithms
that perform load shifting, as they will likely request
higher power levels when tariffs are lower. If loads
are postponed and more EVs later arrive to the
charging station, there is a risk of not being able of
serving all requests. That risk increases as P
max
decreases.
Using the same conditions, Figure 6 shows how
different values of P
max
contribute to the cost
efficiency of each algorithm. As can be verified, as
of P
max
increases the cost of both FCFS and Gradual
ARenewableSourceAwareModelfortheChargingofPlug-inElectricalVehicles
55

Figure 6: Cost comparison of the three algorithms when
production from renewable energy sources is not included.
algorithms increases. These results come from the
fact that in the performed tests most EVs arrive to
the park when the tariff rates are higher. Thus
increasing P
max
has a direct impact in the cost of
these two algorithms as more power can be allocated
to EVs. On the contrary, the cost of the other two
algorithms, the LP and AEDF, has shown not to vary
significantly with P
max
. The lowest cost was assured
by the LP algorithm.
4.2 Scenario 2
In the following scenario we considered that a
renewable energy source (shown in Figure 4) was
available at the charging premises and that all
charging requests were guaranteed. Given the results
obtained in previous tests, we have considered P
max
to be equal to 90 kW.
Using these conditions we have performed
systematic tests with 30 runs to evaluate the
performance of the charging algorithms in terms of
costs and renewable energy usage. In each execution
we introduced a random variation between what was
the forecasted renewable power and the power that
was actually available, for both, in each time instant
and for a day period. This method approximates our
tests with what really happens when dealing with
forecasting the power of renewable sources.
Table 1 reflects the results of the algorithms in
this scenario. This table reflects the cost that the
charging operator would have to pay (and not the
cost paid by the EV driver). As can be verified in
Table 1, both, the LP and AEDF algorithms are both
able to use the highest amount of the available
renewable energy, and thus receive the lowest
amount of energy from distribution operators. Both
solutions are able of significantly reducing electrical
costs when compared with the FCFS and Gradual
algorithms.
Table 1: Results of the Simulation tests in Scenario 2.
Scheduling Solution
Parameter FCFS Gradual LP AEDF
Cost (€) 6.40 6.30 0.030 0.035
Non-
Renewable
Energy Used
(kWh)
129.01 127.03 0.95 0.75
Renewable
Energy Used
(kWh)
360.24 362.23 488.30 488.50
Total Energy
(kWh)
489.25 489.25 489.25 489.25
Number of
EVs Charged
50 50 50 50
4.3 Scenario 3
As in the previous scenario, in this case we
considered that the renewable energy source was
available at the charging premises. However, we
have now defined that users were requesting part of
the energy as Guaranteed and the other part as Non-
guaranteed. Specifically, we have considered that
85% of the energy requested in scenario 2 was now
demanded as Guaranteed and another 25% was
requested as non-Guaranteed. In this sense we
assume that in this scenario users are predisposed to
let the EV Supply Equipment (EVSE) charge 10%
more energy than in the last scenarios for three
reasons: (1) the non-Guaranteed part is expected to
be cheaper; (2) users are aware that this energy is
100% renewable; and (3) it isn´t guaranteed that
they will get the requested amount.
Figure 7: Aggregated Power consumption of all EVSEs
for the Gradual algorithm, in terms of Guaranteed (upper
part) and non-Guaranteed charging (bottom part)
components.
VEHITS2015-InternationalConferenceonVehicleTechnologyandIntelligentTransportSystems
56

Figure 8: Aggregated Power consumption of all EVSEs
for the LP algorithm including the Guaranteed (upper part)
and non-Guaranteed charging (bottom part) components.
As in the previous scenario, we have considered P
max
to be equal to 90 kW. As in the previous scenario we
have performed systematic tests with 30 runs to
evaluate the performance of the charging algorithms
in terms of costs and renewable energy usage. In
each execution we introduced a random variation
between what was the forecasted renewable power
and the power that was actually available, both at
each time instant and during a day period.
For the same set of EV’s arriving times and
requested energy, Figures 7 and 8 present the results
of a one day simulation, respectively for the Gradual
and LP algorithms concerning the power consumed
by all EVSEs. As can be verified in these plots, the
LP algorithm is able of relying only on renewable
energy to charge both the Guaranteed and non-
Guaranteed components.
Table 2 reflect the results of the algorithms in
this scenario. When comparing the results of Table 2
with the ones of Table 1 (scenario 2), it can be
verified that on average there is a cost reduction in
all algorithms, even with an increase of nearly 10%
of energy allocated to EVs. Also, when comparing
both scenarios, a higher consumption of renewable
energy is verified, with a correspondent decrease in
the total amount of energy obtained from the upper
level distribution operators.
The reason behind the fact that all algorithms are
able of charging more energy using less power from
the DSO (when compared with previous scenario)
comes from the flexibility introduced by the model
regarding the partitioning into Guaranteed and Non-
guaranteed energy components. What happens is
that in those days when more renewable power is
available, the proposed model is able of using it, and
for those days when it is not, it is able to adapt better
by recurring less to the distribution operator.
Table 2: Results of the Simulation tests in Scenario 3.
Scheduling Solution
Parameter FCFS Gradual LP AEDF
Cost (€) 5.12 5.11 0.023 0.022
Non-Renewable
Energy Used
(kWh)
105.08 104.85 0.72 0.47
Renewable
Energy Used
(kWh)
434.78 435.00 532.23 539.38
Total Energy
(kWh)
539.85 539.85 532.95 539.85
Number of EVs
Charged
50 50 50 50
As can be verified in Table 2, both the LP and
AEDF algorithms are able of using the highest
amount of the available renewable energy, and thus
achieve the lowest cost. The main difference
between the two algorithms stands in their
computational requirements. In fact, when using an
Intel(R) Core(TM) i7-4770 microprocessor the
AEDF algorithm took on average 216 milliseconds
to schedule 50 charging requests, which compares
with the 14.1 seconds required by the LP algorithm.
As each driver would have to wait for the end of the
scheduling algorithm to know if the requested
energy could be granted, the time that the algorithm
takes to obtain a solution is an important factor that
needs to be considered in its evaluation.
Figure 9 compares both the LP and the AEDF
algorithms in terms of computation time, when
scheduling a varying number of EVs. It shows that
the LP solution suffers from severe scalability
problems, which can prevent it from being
implemented in a real scenario with several dozen
vehicles. On the contrary the execution times of the
AEDF algorithm are not only much lower than the
LP ones, but also they increase linearly with the
number of EVs being scheduled.
Figure 9: Computation times of the LP versus AEDF
algorithms for the scheduling of different numbers of EVs.
ARenewableSourceAwareModelfortheChargingofPlug-inElectricalVehicles
57

5 CONCLUSIONS
This paper proposes and evaluates a novel model for
the charging of plug-in electric vehicles that includes
the local production of energy resulting from
renewable sources. The model is designed to
motivate users to participate in demand response
measures, making their EVs serve as energy storage
units when surplus energy is generated, by being
aware of the variability that such sources impose.
The tests and results obtained show that the
proposed model is able of achieving a cost reduction
in all the tested algorithms while assuring a higher
consumption of renewable energy. Among the tested
scheduling algorithms, the proposed AEDF solution
has shown to be able of achieving a significant cost
reduction with a significant lower computational
complexity and processing times, when compared
with the LP algorithm. The obtained results have
demonstrated that the AEDF algorithm can be used
in charging facilities with 50 or more vehicles.
Finally, the flexibility introduced by the model
regarding the partitioning into Guaranteed and Non-
guaranteed energy components has shown to support
a better adaptation to the variable nature of
renewable sources.
ACKNOWLEDGMENTS
This work was supported by European Union's FP7-
2013 in the PlanGridEV Project, under grant
agreement nr. 608957, and by national funds through
Fundação para a Ciência e a Tecnologia (FCT) with
reference UID/CEC/50021/2013.
REFERENCES
Chen, S., Ji, Y. & Tong, L. (2012). Deadline Scheduling
for Large Scale Charging of Electric Vehicles with
Renewable Energy. IEEE SAM Workshop - Special
Session on Smart Grid, June.
Electrical installation guide. According to IEC
international standards (2013). Schneider Electric.
Joskow, P. L. & Wolfram, C. D. (2012) Dynamic pricing
of electricity. The American Economic Review,
102(3), 381–385.
Link, J., Buttner, M., Dallinger, D. & Richter, J. (2010).
Optimization algorithms for the charge dispatch of
plug-in vehicles based on variable tariffs. Working
Papers, Fraunhofer Institute for Systems and
Innovation Research (ISI), Tech. Rep. S3/2010.
Lopes, J., Soares, F. & Almeida, P. (2011) Integration of
electric vehicles in the electric power system. Proc. of
the IEEE, 99(1), 168-183, Jan.
Mobilität in Deutschland (2010). Study assigned by the
German Federal Ministry of Transport, Building and
Urban Development, Feb.
OMI-Polo Español S.A. (2010, December, 1), Retrieved
from website: http://www.omie.es/files/flash/
ResultadosMercado.swf.
Rolink, J. & Rehtanz, C. (2011). Capacity of low voltage
grids for electric vehicles. In 10th EEEIC, 1-4, 8-11
May.
Schmutzler, J., Wietfeld, C., Jundel, S., & Voit, S., (2011).
A mutual charge schedule information model for the
vehicle-to-grid communication interface. In Proc.
IEEE VPPC, 1-6, 6-9 Sept.
Sundström, O. & Binding, C. (2010), Planning Electric-
Drive Vehicle Charging Under Constrained Grid
Conditions, Research Report, IBM Research – Zurich,
Switzerland.
Utility-Scale Smart Meter Deployments (2011). Plans &
Proposals, Institute for Electric Efficiency, Sep.
Wansart, J. & Schnieder, E. (2010). Modeling market
development of electric vehicles - from system analysis
to dynamic modelling. 4th Annual IEEE Systems
Conference, April, 371–376.
VEHITS2015-InternationalConferenceonVehicleTechnologyandIntelligentTransportSystems
58
