Towards Sentiment-driven Maps Showing Touristic Attractiveness
Sarah Tauscher and Karl Neumann
Institute for Information Systems, Technische Universität Braunschweig, Braunschweig, Germany
tauscher@ifis.cs.tu-bs.de
Keywords: Automatic Cartography, Semiology of Graphics, Sentiment Analysis, Volunteered Geographic Information.
Abstract: User generated texts on tourism-related social network sites do not only contain factual information, but
also valuable opinions and ratings of locations. Nevertheless, most maps on these sites only show markers
where something described in a user generated text is located. In particular, no further information is
derived from the text and displayed on the maps. Moreover, generalization operations are not employed,
although in most cases aggregation and displacement of the user generated content would be necessary to
achieve more readable maps. Therefore, we propose a method which automatically creates user-sentiment
enriched maps. We use natural language processing tools in order to mine user sentiments for specific
places from user generated texts and we propose specially designed point symbols which represent the
corresponding mined user sentiment for each location. Additionally, we propose a heuristic, based on
Voronoi diagrams, which slightly displaces the aforementioned symbols in case they are very close. This
makes the provided map easier to read.
1 INTRODUCTION
A lot of user generated information accumulated in
the web is related to a place. Because everything
people do, they are doing it somewhere and most of
the time it makes a difference where this is. This
spatial reference is especially important on so-called
travel social network sites. These sites do not only
gather information about places and communicate
information about where these places are actually
located, they also offer travellers the opportunity to
connect and share information. Especially these
opinions and experiences of other users provide the
additional benefit of those sites in comparison to
traditional travel guides. Surprisingly, these sites are
in their appearance very similar to other social
network sites without an explicit spatial reference.
Though maps are a very useful representation to
describe the environment, there are rarely more
maps on a travel social site than on a pure social site.
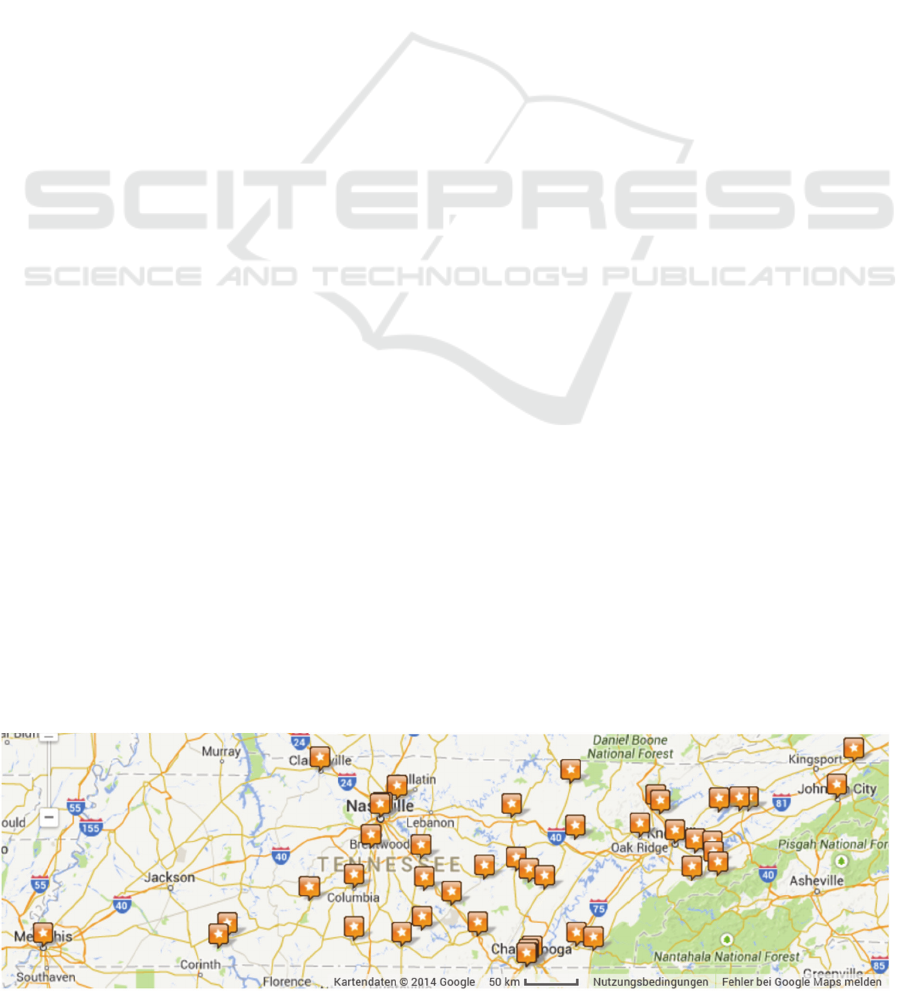
Moreover, these maps often only show markers
where something described in a text is, like it is
shown in Figure 1. The rather simple information
content of these maps is owed to the services, which
are used for their creation. These services, like
GoogleMaps, Bing or Yahoo Maps, enable their
users to create layers containing any content that can
then be viewed over the respective imagery base.
But there is no aid in choosing appropriate markers
for a special content. Furthermore, generalization
Figure 1: Popular locations in Tennessee, map extracted from virtualtourist.com.
129
Tauscher S. and Neumann K..
Towards Sentiment-driven Maps Showing Touristic Attractiveness.
DOI: 10.5220/0005454401290134
In Proceedings of the 1st International Conference on Geographical Information Systems Theory, Applications and Management (GISTAM-2015), pages
129-134
ISBN: 978-989-758-099-4
Copyright
c
2015 SCITEPRESS (Science and Technology Publications, Lda.)

operations are not supported by these systems,
although in most cases aggregation and
displacement of the user generated content would be
necessary to achieve more readable maps.
In this paper, we try to demonstrate that the
already existing cartographic knowledge could be
used to automatically create maps showing the
sentiments towards places, which are more
appealing and more expressive than the usual maps
with markers. For this purpose we use well known
natural language processing and opinion mining
tools and generate maps of reviews for towns. These
maps consist of a simple base map and specially
designed point symbols, which represent for each
location the corresponding sentiment values by their
size and colour. If locations are too close to each
other the map symbols will be minimized and
slightly displaced. Thus, easily readable maps are
produced, which enable the user to capture at a
glance where attractive touristic locations are and
how many reviews have contributed to their ratings.
The rest of the paper is organized as follows: In
Section 2 the sentiment analysis method we utilized
is described and evaluated. Section 3 addresses the
design process for the map symbols representing
sentiments. A method to displace point symbols is
developed in Section 4. Afterwards, the map
symbols and the displacement are applied to real
world data and the results are presented in Section 5,
before Section 6 concludes the paper.
2 SENTIMENT ANALYSIS
We considered three methods for sentiment analysis,
namely SentiStrength (Thelwall et al., 2010),
Lexicon-Based Classifier (Paltoglou and Thelwall,
2012) and SO-Cal (Taboada et al., 2011), which
have been developed for informal web content. As
the latter performs best in preliminary tests, we will
only present and discuss its results.
We extracted 36,715 reviews about locations in
the USA from a travel social network site,
preprocessed them with the Brill Tagger (Brill,
1992) and classified them using SO-CAL. The
majority of them, 24,367 were classified as positive,
8,659 as negative and 2,017 as neutral. In addition,
500 randomly selected reviews have been manually
classified, in order to evaluate this analysis. The
classification task was to assign to each review
either a positive, a negative or a neutral value,
depending on the sentiments expressed with respect
to the location. Table 1 lists the resulting values for
precision, recall and the f-measure of these 500
reviews.
Table 1: Evaluation results for 500 randomly selected
reviews, considering only location specific sentiments.
# Precision Recall F-measure
Positive 304 0.86 0.90 0.88
Neutral 132 0.87 0.39 0.54
Negative 64 0.43 0.81 0.56
The result for positive reviews is satisfying,
whereas neutral reviews have a rather low recall and
negative reviews a low precision, resulting in a
disappointing f-measure for both classes. One reason
for this shortcoming of the method is that in a lot of
reviews not only a location is described and rated,
but also its historic background. Often the history is
connected to a war or a natural disaster,
consequently the text contains a lot of negative
expressions, which are misjudged as a negative
sentiment towards the corresponding location.
Additionally, neutral reviews, which rather express
facts then sentiments about a location, are seldom
written completely in a factual diction. Instead, they
quite often contain negative as well as positive
judgments on the facts. If the manual classification
task is modified, i.e., if the reviews should be
classified by considering all sentiments expressed in
the text, the results are significantly improved, as
Table 2 shows. Still the recall for neutral and the
precision for negative reviews are not as good as for
positive ones, but they are in accordance to the
results reported in (Taboada et al., 2011).
Table 2: Evaluation results for 500 randomly selected
reviews, considering all sentiments.
# Precision Recall F-measure
Positive 315 0.92 0.92 0.92
Neutral 77 0.90 0.70 0.79
Negative 108 0.81 0.87 0.84
Hence, the method seems to be appropriate for
our domain. Nevertheless, a preprocessing step,
which filters background information out of reviews
would be necessary, in order to get only the location
specific sentiments.
3 MAP SYMBOLS FOR
SENTIMENTS
According to the intended communication goal, the
GISTAM2015-1stInternationalConferenceonGeographicalInformationSystemsTheory,ApplicationsandManagement
130

map symbols should fulfil the following
requirements:
R1 Point signature representing two independent
attributes
R2 Support quantitative perception between both
attributes
R3 Support selective perception regarding one
attribute
R4 Support ordered perception of the number of
reviews that have been aggregated
First, we have to identify the components of the
information we want to visualize. “Sentiment” can
be considered either to be one component having
values ranging from negative over indifferent to
positive (from -1 to 1) or as two components: one
nominal component having two values (positive and
negative) and one quantitative component describing
the strength of the sentiment. The latter approach is
more suitable for our end as we want to distinguish
if there are positive and negative sentiments towards
a place or if there are only indifferent ones. As the
number of reviews should also be represented, a
third ordered component is added to our information
“Sentiment”.
Consequently, we have to use three visual
variables to visualize these three components. For
the nominal component an unordered variable, i.e.,
form, color or orientation is appropriate (Bertin,
2011). As our goal is to represent two independent
nominal attributes at the same place, it is necessary
to use different forms that can be distinguished even
if one is superimposed by the other. In order to fulfil
requirement R3, also different colours are used as
the form is not selective. As size is the only
quantitative variable, it will be used for the
sentiment value (R2). Finally, R4 leaves two choices
for the number of reviews: texture and brightness.
Due to the possibility of vibratory effects of textures
we pick the latter. The change of the brightness of
one object has the same visual effect as the change
of its transparency, as long as the background is
white. So we chose transparency, because it provides
an additional benefit: the outlines of both forms are
visible even if one covers the other completely.
Concerning the choice of the form, there are no
formal guidelines, except not to use one that is
already strongly associated with different
information. So we chose as symbol for positive
sentiments a turquoise six-pointed star and for
negative ones a red circle. Green and red would be a
more intuitive choice for colours to express positive
and negative values (traffic light metaphor), though
it is unfortunately not accessible for colour blind
people. Stars are often used for ratings and have a
positive connotation. On the one hand five-pointed
stars are much more common and therefore suggest
themselves, but on the other they might be easily
misinterpreted. The sizes of the circle and the star
are independent of each other as well as their opacity
values. Figure 2 shows the map symbols for the
positive as well as the negative values 0.1, 0.5 and 1
and all their possible combinations. The opacity for
all symbols is 0.8, which is also defined as
maximum value in order that both signatures are
always cognizable. The minimum opacity value is
set to 0.2, and in addition a maximum number of
reviews is defined. The reason for this is that it is
sufficient for the user to see, if the number of
reviews exceeds a certain value, which indicates that
the sentiment value is reliable.
Figure 2: Map symbols for different combinations of
sentiment values.
4 PLACEMENT OF MAP
SYMBOLS
Ideally, map symbols should be placed at the exact
coordinates of the object they symbolize.
Furthermore, the map symbols should exceed the
minimal graphical size (Keates, 1993) as well as
map symbols should not overlap, in order to keep
the map readable. Especially in small scale maps the
map symbol often covers more space than the
corresponding object, though increasing the
probability for overlapping map symbols.
Consequently, at least one of the following basic
generalization operations, selection, aggregation and
displacement should be used to resolve the overlap
of map symbols. Selection would induce a complete
loss of information, in our case the sentiment values
of some locations, whereas displacement decreases
the geographic accuracy and aggregation the
“geographic” resolution. Consequently,
TowardsSentiment-drivenMapsShowingTouristicAttractiveness
131
displacement is the most appropriate choice for our
application area.
Hence, we propose an iterative displacement
method: The input parameters are the coordinates of
the locations as well as the size of their map symbols
and the output is a list of the displaced points.
Furthermore, a threshold for the acceptable distance
has to be defined. We use a Voronoi diagram of the
input points as auxiliary structure, which is
recalculated at the beginning of each iteration as the
points are moved during the iteration steps.
For each iteration, the following conditions are
checked one after the other and the corresponding
instruction is executed. If the point symbol fits
completely in the Voronoi cell of the corresponding
point and the point is not marked as conflicting, the
point is kept. If the point symbol actually overlaps
any of its neighbours, it is checked if it is possible to
place the signature anywhere within the Voronoi cell
of its corresponding point. And if the distance
between the original point and the new centre of the
point symbol is less than the given threshold, the
point is replaced. In this way the propagation of
conflict, which arises when the displacement of one
point symbol raises a conflict with a symbol that was
not previously in conflict, is restricted, as Figure 3
illustrates.
Figure 3: Displacement of single map symbol.
Otherwise the neighbours are marked as
conflicting, they are checked again and the point is
moved as far as acceptable towards the mass centre
of the Voronoi cell. The reason for this is that the
iterative calculation of centroidal Voronoi diagrams
leads to a distribution of its points, where the
“energy” between them complies with the global
optimum (Du et al., 1999). Thus, we take the
direction towards the mass centre as a hint for a
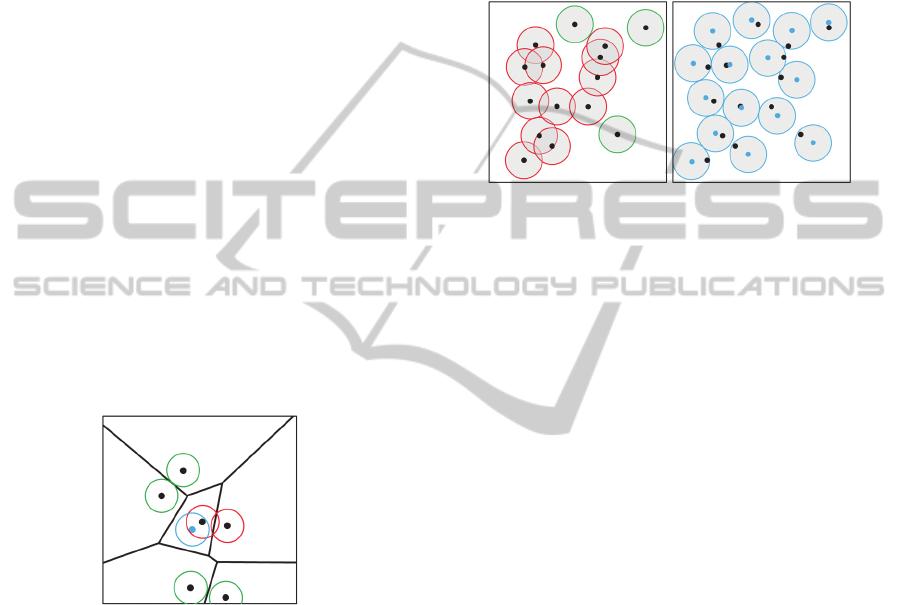
promising displacement direction. In Figure 4 a
rather dense set of randomly created points, which
should be symbolized by grey discs is shown on the
left side, and the result of the displacement method
on the right.
The original points are drawn in black, the
displaced points in blue. The threshold is set to the
radius of the point symbols. The method stops if
there are no more overlapping map symbols or if no
point can be moved without exceeding the given
threshold. Additionally, the number of iterations can
be restricted, as the method delivers an intermediate
solution after a few steps, which is at least
considerably better than the initial placement, as
empirical studies presented in the following Section
indicate.
Figure 4: Point set before and after displacement.
5 APPLICATION TO REAL
WOLRLD DATA
Our test set consists of sentiment values extracted
from reviews for locations in the USA, as described
in Section 2, which have been complemented by
their coordinates taken from GeoNames.
Additionally we extracted the borders of the single
states from OpenStreetMap. For each state we
created a map using the map symbols described in
Section 3 and Esri’s world ocean base (MapServer)
as a base map. The scale of the maps varies between
1:1,000,000 and 1: 5,000,000 in such a way as to
enable us to present them true to scale within this
paper. For 17 states the locations where wide spread,
thus there were no, or less than ten easily solvable
conflicts. Therefore, we only analysed the placement
of map symbols for the remaining 3 states, whose
results are listed in Table 3.
For each state the number of solved and unsolved
conflicts as well as the number of displaced objects
and the average distance by which they are
displaced, are listed. The maximum number of
iterations was set to 200, but for all except three
states (IN, MA, OR) the method terminated earlier.
The threshold for the maximal acceptable
displacement has been set to 5mm, nevertheless the
average distance is about 2.6mm ± 1.3mm for the
single states. As expected, not only the conflicting
objects are displaced, but still the displacement is
restricted to objects close to conflicting ones, as
some objects always remain on their original
location.
GISTAM2015-1stInternationalConferenceonGeographicalInformationSystemsTheory,ApplicationsandManagement
132

Table 3: Results of the displacement of point symbols.
State (Abbr.) Area (km²) # Sites
# Overlaps Displacement
Solved Not solved # Objects Ø Distance (mm)
Alaska (AK) 1,723,337 67 45 6 41 2.98
Alabama (AL) 135,767 72 23 1 35 2.31
Arizona (AZ) 295,233 88 15 1 33 1.85
California (CA) 423,968 100 116 26 79 3.02
Colorado (CO) 269,602 71 14 2 30 1.74
Connecticut (CT) 14,356 58 24 3 32 2.79
Florida (FL) 170,312 99 77 17 84 2.93
Georgia (GA) 153,910 78 15 7 26 1.68
Illinois (IL) 149,997 66 33 12 41 2.29
Indiana (IN) 94,327 76 38 5 43 2.44
Kansas (KS) 213,099 72 14 1 29 1.85
Kentucky (KY) 104,656 81 21 1 35 2.11
Louisiana (LA) 135,658 42 18 2 25 2.44
Massachusetts (MA) 27,335 72 134 44 57 3.96
Maryland (MD) 32,131 61 41 15 51 2.59
Maine (ME) 91,634 64 53 16 40 3.38
Michigan (MI) 250,488 87 18 5 37 1.98
Montana (MT) 380,832 53 9 3 23 2.04
North Carolina (NC) 139,391 95 71 8 69 2.68
Nebraska (NE) 200,330 52 10 1 20 1.78
New Hampshire (NH) 24,214 45 15 2 25 2.27
New Jersey (NJ) 22,592 90 44 6 57 2.70
Nevada (NV) 286,380 33 10 2 13 1.62
New York (NY) 141,297 89 77 17 63 3.07
Ohio (OH) 116,099 80 52 4 52 2.81
Oklahoma (OK) 181,038 74 10 2 22 1.80
Oregon (OR) 254,800 94 81 6 67 2.99
Pennsylvania (PA) 119,279 98 43 1 49 2.49
Tennessee (TN) 109,152 46 15 1 29 1.97
Texas (TX) 695,660 100 64 8 66 2.47
Virginia (VA) 110,787 89 82 14 60 2.90
Washington (WA) 184,661 94 74 20 63 2.76
West Virginia (WV) 62,755 59 10 1 24 2.00
The results also support the assumption that the
resolvability of overlaps depends mainly on the
distribution of points, as there is neither an
interrelation between the number of conflicts and the
number of objects, nor between the number of
conflicts and the percentage of conflicts solved.
In Figure 5 the resulting map for Tennessee is
shown, where all but one conflict at the southeast
border could be resolved. The remaining overlap is
due to the size and the closeness of the involved
signatures not solvable, if the threshold of 5mm is
kept.
TowardsSentiment-drivenMapsShowingTouristicAttractiveness
133
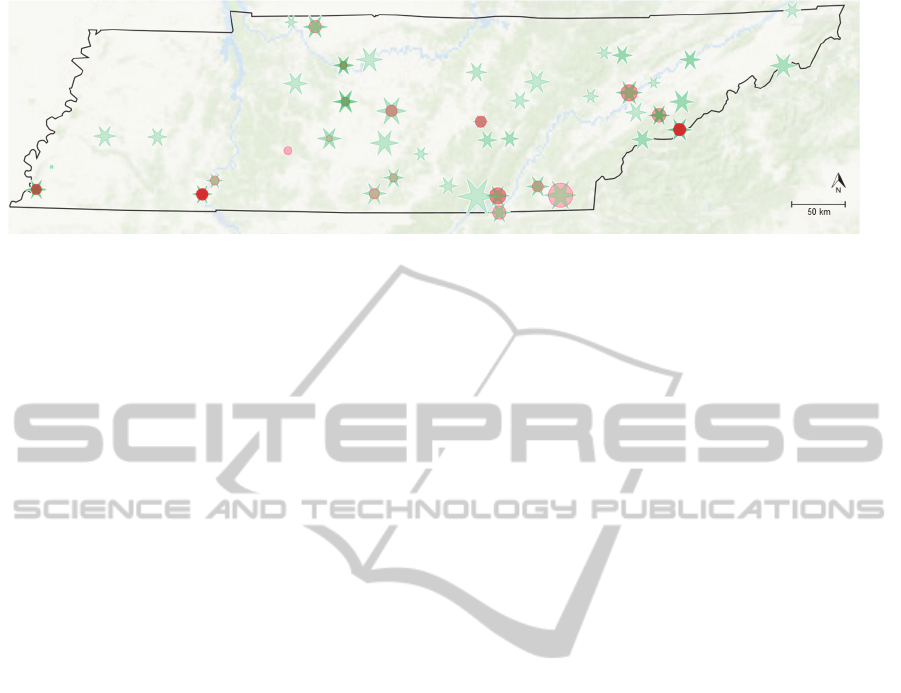
Figure 5: Sentiment map of Tennessee.
6 CONCLUSIONS
In this paper, we sketched out a method for
generating maps for tourism-related social network
sites that are more expressive than the usual pin
maps shown on these websites. This was done via
specific map symbols consisting of two separate
parts, and by natural language processing including
sentiment analysis. Furthermore, we proposed a
heuristic method for point symbol displacement,
which utilizes Voronoi diagrams.
It is obvious to use this kind of maps by
embedding them in travel social network sites. In
this case it would be adequate to show the names of
the locations as tool tip texts. Moreover, a synthetic
excerpt of the reviews as pop up after clicking on a
location would be eligible. But though it is a well-
treated issue (Pang and Lee, 2008), there is no ready
to use solution available. Additionally, preferences
of users, e.g., if they are more interested in
adventure, family or wellness holidays, could be
considered by analysing first the different aspects
mentioned in a review and then the corresponding
sentiments. The design of the presented sentiment
maps has been optimized for small scale maps. As it
is generally possible and desired to zoom into digital
maps, the adaptability of this kind of maps to
different scales is another aspect of future work.
REFERENCES
Bertin, J., 2011. Semiology of graphics: diagrams
networks maps, Esri Press. Redlands.
Brill, E., 1992. A simple rule-based part-of-speech tagger.
In ANLP’92, 3rd Conference on Applied Natural
Language Processing. ACL.
Du, Q., Faber, V., Gunzburger, M., 1999. Centroidal
Voronoi tessellations: applications and algorithms.
SIAM review, vol. 41, no. 4, pp. 637-676.
Keates, J. S., 1993. Cartographic design and production,
Wiley. New York.
Paltoglou, G., Thelwall, M., 2012. Twitter, MySpace,
Digg: Unsupervised sentiment analysis in social
media. ACM Trans. Intell. Syst. Technol, vol. 3, no. 4
September, pp.66:1-66:19.
Pang, B. W., Lee, L., 2008. Opinion mining and sentiment
analysis. Foundation and Trends in Information
Retrieval, vol. 2, no.1, pp. 1-135.
Taboada, M., Brooke, J., Tofiloski, M., Voll, K., Stede,
M., 2011. Lexicon-based methods for sentiment
analysis. Comput.Linguist., vol. 37, no. 2, June,
pp.267-307.
Thelwall, M., Buckley, K., Paltoglou, G., Cai, D., Kappas,
A., 2010. Sentiment in short strength detection
informal text. J.Am. Soc. Inf. Sci. Technol., vol. 61, no.
12, December, pp.2544-2558.
GISTAM2015-1stInternationalConferenceonGeographicalInformationSystemsTheory,ApplicationsandManagement
134
