
Price based Unit Commitment with Wind Generation and Market
Clearing Price Variations
Vaidyanath Ramachandran
1
, Junbiao Han
2
, Sarika Khushalani Solanki
3
and Jignesh Solanki
3
1
Alstom Grid, Bellevue, WA, U.S.A.
2
ABB Inc., Raleigh, NC, U.S.A.
3
Department of Electrical Engineering, West Virginia University, Morgantown, WV 26505, U.S.A.
Keywords: Market Clearing Price, Auction, Wind Integration and Intermittency, Price based Unit Commitment, Dynamic
Programming.
Abstract: Bidding plays an important role for Gencos (Generation Companies) participating in competitive electricity
markets with the objective of maximizing profit. The characteristics of generators and price uncertainty need
to be considered while formulating bidding strategies as they have a direct impact on expected profit. The
rapid development of wind technology leads to an increasing share of wind power in the market and should
be considered for calculating the Market Clearing Price (MCP). In this paper, the effects of wind intermittency
on MCP variations of the wind farm generators are considered for the price based unit commitment strategy
of the Genco. Simulations are performed on an IEEE 30-bus test system with wind farm that indicate
significant corrections in day ahead forecasted PBUC (Price Based Unit Commitment) schedule and real time
dispatch schedule of the Genco for optimal bidding.
1 INTRODUCTION
The electric industry throughout the world is
undergoing a significant transformation from a
vertically integrated framework to a distributed,
deregulated and competitive structure consisting of
independent generation, transmission and distribution
entities. In doing so, the net cost of electricity has
been reduced due to increased competition between
the market entities. The reliable and efficient
operation of this new grid structure is ensured by an
independent body known as the ISO (Independent
System Operator). The ISO establishes rules for
energy and ancillary services markets, manages the
system in a fair and non-discriminatory manner and
shields the markets from risks and accumulation of
market power with a single entity. In order to achieve
these goals, the ISO supports different market models
namely the PoolCo, Bilateral contracts and Hybrid
models. The PoolCo market model is defined as a
centralized marketplace that clears the market for
power buyers and sellers. Electric power
sellers/buyers submit bids to the pool and each bid
contains information on how much power, at which
prices, in which area, at what time, a market
participant is willing to buy or sell. The PoolCo
market model is achieved by the Power Exchange
(PX) that is integral to the ISO’s operation. The PX
functions as an independent, non-government and
non-profit entity that conducts the auction for
electricity trades in the market. The PX calculates the
Market-Clearing Price (MCP) based on the highest
price bid in the market.
In such a competitive market, Genco (Generation
Company) sells electricity to the PX from which large
customers such as Discos (Distribution Company)
and aggregators may purchase electricity to meet their
needs. Along with real power, Gencos also trade
reactive power and operating reserves. For successful
bidding in the market, Gencos need innovative
strategies to determine their optimal bid to maximize
revenue and profit targets. Generation schedules
covering a range of 24 hours to 1 week ahead
achieved through unit commitment, help in
formulating optimal bids for a competitive Genco.
In the deregulated power market, a particular type
of unit commitment is used by the Genco to optimize
generation resources in order to maximize its profit,
called the Price Based Unit Commitment (PBUC). In
PBUC, satisfying load is no longer an obligation and
the objective is of maximizing the profit from trading
energy and Ancillary Services (AS) in the market.
The distinct feature of PBUC is that the market price
217
Ramachandran V., Han J., Khushalani Solanki S. and Solanki J..
Price based Unit Commitment with Wind Generation and Market Clearing Price Variations.
DOI: 10.5220/0005442002170225
In Proceedings of the 4th International Conference on Smart Cities and Green ICT Systems (SMARTGREENS-2015), pages 217-225
ISBN: 978-989-758-105-2
Copyright
c
2015 SCITEPRESS (Science and Technology Publications, Lda.)

reflects on all market transactions indicating market
price as the only signal that enforces a unit’s ON/OFF
status and generation dispatch. In day-ahead market
Genco runs PBUC based on forecasted energy and
ancillary services price, and price uncertainty needs
to be considered as it has a direct impact on the
expected profit. Several approaches have been used
to solve the PBUC problem viz. Linear/Non-
Linear/Dynamic Programming and other meta-
heuristic techniques (Senjyu, 2003- Mantawy, 1997).
The PBUC problem has been approached using
Lagrangian Relaxation (LR) and Dynamic
Programming in (Pokharel, 2005). A tradeoff
between LR and Mixed Integer Programming to solve
the PBUC is presented in (Li, 2005). A hybrid
technique involving LR and evolutionary
programming has been used in (Attaviriyanupap,
2003). Intelligent techniques like multi-agent and
particle swarm optimization for solving PBUC are
presented in (Xiaohui, 2005-Yu, 2004).
Apart from innovative bidding strategies, Gencos
have adopted distributed generation resources such as
wind farms to their portfolio; to supplement
coal/natural gas fired generation and meet green
generation mandates thereby maximizing profits.
Wind farms present an innovative and clean
technology, but their output is intermittent. Wind
farms are capital-intensive but have lower operating
costs than fossil-fuel plants. Although wind power
offers many possible benefits, it has many potential
challenges to participate competitively in the current
restructured electric industry (Fabbri, 2005-Milligan,
2005). These challenges can be broadly classified into
four categories.
• Network: The network constraints include
geographical locations of wind farms and the
capacity of the line/cable infrastructure to
extract power at medium and high voltages from
remote wind farms.
• Availability: For a Genco with wind generation,
wind power availability forecast is very
essential as it has direct impact on the system
performance and stability. A combination of
simulation statistical and weather based
techniques to predict the quantity of intermittent
wind power are presented in (Sideratos, 2007)
and (Kariniotakis, 2006). The impacts of wind
power variability on system operating costs are
not negligible (DeMeo, 2005).
• Operation: Large penetration of wind farms
introduce significant operational difficulties like
reverse power flow, voltage fluctuations and
harmonics depending on size and voltage.
• Pricing: The uncertainty in wind availability
has a direct impact on its pricing which depends
on the nature of wind intermittency. Under this
scenario, the MCP varies and some approaches
to calculate MCP are presented in (Zeineldin,
2009- Singh, 2008). There are different
approaches to handle the wind uncertainties in
competitive electricity market: probabilistic,
stochastic and fuzzy systems. Fuzzy sets have
been successfully applied to power system
operation and planning to simulate uncertainties
(Martin, 2015, Sharma, 2014 and Ting, 2013).
Earlier works have focused on the formulation of
the PBUC problem and different optimization
techniques to solve it. Several other works have
addressed the challenges faced by Gencos owning
intermittent energy resources. However, there is not
much contribution made towards investigating the
effects of wind intermittency on the PBUC schedules
of a Genco.
A novel approach to PBUC has been presented in
this paper by calculating MCP under varying wind
conditions. The relationship between wind
intermittency and MCP is used to determine a revised
PBUC strategy for a Genco owning wind farms, so as
to maximize profits. The paper is organized as
follows: Section II proposes the MCP formulation
with wind integration. The existing methods for
calculating MCP (pay-as-bid market clearing rules,
single price market clearing rules and single auction
market) and the proposed method (optimal power
flow based) for MCP calculations with wind
integration are described. Section III presents the
PBUC problem formulation and dynamic
programming for obtaining the optimal unit
commitment schedule. LR method with dynamic
programming is used to solve the PBUC problem in
this paper. Section IV provides the test system
information and results. The IEEE 30 bus system
comprising of two Gencos consisting of six
generating units G1-G6 and two additional windfarm
units is used as the test system. A 24-hour varying
output from the two windfarms simulates the
intermittency and volatility of wind power. PBUC
strategies are developed for the six generating units
under different conditions such as a) No wind power
b) With rated wind power c) Low wind volatility d)
High wind volatility and e) Brief wind intermittency.
The resulting effects of wind intermittency on MCP
and the PBUC strategies of Gencos are discussed.
Section V concludes the discussion.
SMARTGREENS2015-4thInternationalConferenceonSmartCitiesandGreenICTSystems
218

NOMENCLATURE
p Price of electricity in $/kWh.
Slope of the linear supply curve.
Slope of the linear demand curve.
N Number of generating units.
D Total demand of the system.
j Index for unit.
Price Axis Intercept of the Demand curve.
C Total Generation Cost
F Total profit of the Genco
Power output of generator i.
(
)
Cost function of generator i.
Incremental cost at bus i.
Uniform electricity market price.
P (j, i) Generation of unit j at time i.
R (j, i) Spinning reserve of unit j at time i.
N (j, i) Non-spinning reserve of unit j at time i.
RP (j, i) Energy price at the instant i.
RR (j, i) Spin price at the instant i.
RN (j, i) Non-Spin price at the instant i.
(
)
Minimum ON time of unit j.
(
)
Minimum OFF time of unit j.
(
,)
Time duration for which unit j has been ON
at time i.
(
,)
Time duration for which unit j has been OFF
at time i.
UR (j) Ramp up limit of unit j.
DR (j) Ramp down limit of unit j.
L (t, ON) Lagrangian function at time i for ON status.
∗
(t,
ON)
Optimal cumulative Lagrangian at hour i for
the ON status.
∗
(t,
OFF)
Optimal cumulative Lagrangian at hour i for
the OFF status.
,
Start-up cost for unit j at time i.
,
Shutdown cost for unit j at time i.
2 MARKET CLEARING PRICE
FORMULATION
The most common method for MCP formulation for
PBUC is based on electricity auction. Most of the
earlier works treat wind farms as conventional
generators that are paid according to the hourly
market price. However, this method is not valid for a
Genco with wind resources to bid into the market as
the wind intermittency and price variation are not
taken into effect while formulating MCP. Existing
and proposed methods for MCP formulation are
described in detail and the corresponding changes in
PBUC schedules of the GENCO are analyzed.
2.1 Existing MCP Formulation based
on Electricity Auction
The important aspects of pricing for electricity
auction, which are generally used in real-time
markets, are listed below:
• Discriminatory/ pay-as-bid market clearing rules:
Under this rule, every participant pays or is paid
at the price of winning bid. In this system, the
bidding is made by predicting the cut-off price and
not on marginal cost. It may happen such that
some of the Gencos having lower energy cost may
bid above the cut-off price and some high cost
firms would win the bid and the customers have
to pay more to obtain the high cost energy. The
cost of generation would, therefore, be above the
market clearing cost. Pay-as-bid system can
increase the total cost of generating electricity and
will therefore be less efficient.
• Uniform/ single price market clearing rules: This
rule is more efficient and commonly used. After
receiving bids, ISO aggregates the supply bids
into a supply curve (S) and aggregates the demand
bids into a demand curve (D) and clears the
market by determining the clearing price. The
sellers and buyers receive the same clearing price,
even if they bid less than this clearing price. The
theory behind such a bidding system is that all
bids to sell electricity would be priced at the
marginal cost of that electricity. In an electricity
auction, market clearing price is formulated as the
lowest price obtained at the point of intersection
of aggregated supply and demand curves. At this
price, both the winning generation and demand
bids are satisfied and would provide enough
electricity to satisfy all purchase bids.
• For single auction market, demand bid is not
available, the load is assumed to be fixed and only
Gencos are participating in the bidding. This
auction formulation starts with the energy
generated by bidder j, represented as
E
(
p
)
=
p
m
(1)
The total combined generation can be calculated by,
(
)
=
()=
1
(2)
The MCP,
∗
can be calculated from,
E
(
∗
)
=
(3)
∗
=
∑
1
(4)
If the capacity limits are considered, then the
combined supply curve can be represented as,
()=
1
,
≤≤
0, ≤
,
≤
(5)
PricebasedUnitCommitmentwithWindGenerationandMarketClearingPriceVariations
219

2.2. Developed MCP Formulation with
Wind based on Optimal Power
Flow
With proper pricing mechanism for MCP
determination, the efficiency of the market can be
improved. In this paper an MCP formulation is
developed to handle the uncertainty in wind
availability. The basic concept used for this
formulation is that the MCP with and without the
wind availability is different. A time series based
Optimal Power Flow (OPF) which considers
fluctuating wind farm output as and when available is
developed. The solution of the optimal power flow
determines the new MCP for each instant, which
reflects the wind availability for the corresponding
instant.
The objective of the standard OPF for an ISO is to
maximize social welfare. For a 24-hour period, load
and wind generation are varying in each time interval,
and the optimization problem can be formulated as
=
(
)
+
(
)
(6)
(
)
=
+
+
(7)
Solving this OPF yields the highest value of the bus
incremental cost which is now set as the new MCP.
Thus,
≥
∀∈1,2…,
(8)
The new MCP, defined by, incorporates the wind
generators in the market clearing process. This takes
into effect the nature of wind intermittency and its
impacts.
3 PRICE BASED UNIT
COMMITMENT
3.1 Problem Formulation
The objective of PBUC is to maximize the profit (i.e.
revenue minus cost) subject to all prevailing
constraints. For unit j at time i, the objective function
is given as:
{(−
∗
−
∗
−
∗
)+(
+
+
)}
∗
+{
−
∗
+(
)}∗(1−
)
(9)
The first part of the equation represents the profit
when the unit is ON and the second part represents
the profit when the unit is OFF. Here, profit
represents revenue from the non-spinning reserve
sales minus production costs and the cost of any
energy purchases. Similarly, profit from bilateral
contracts would also be included. The objective
function for the total time period is
=
(
,
)
(10)
The system constraints can be expressed by (11)-
(17).
Unit ON
−min
,
−
−
≤0
(11)
≤
≤
(12)
≤
≤
(13)
≤
+
+
≤
(14)
Unit OFF
=0
(15)
=0
(16)
≤
≤
(17)
These constraints represent the special
requirements of the Genco like the minimum and
maximum generation, ramp rates, quick start and
minimum ON–OFF time constraints. The minimum
ON time and OFF time constraints are to be
implemented in the dynamic programming routine.
They can be represented as
(
,
)
−
(
)
∗
−
≥0 (18)
(
,
)
−
(
,
)
∗
−
≥0 (19)
The minimum ON–OFF time constraints result in
an expanded state transition diagram for the dynamic
programming problem. The ramp up and ramp down
constraints of the system can be represented as
−
≤() (20)
−
≤() (21)
The forward stage of dynamic programming is
used to find the optimal cumulative value at every
hour for each state described by (22) and (23) while
the backward search is used to find out the optimal
commitment trajectory.
∗
(
,
)
={
∗
(
−1,
)
,
∗
(
−1,
)
+(,)}+(,)
(22)
∗
(,) = {
∗
(−1,)+(,),
∗
(
−1,)}+(,)
(23)
SMARTGREENS2015-4thInternationalConferenceonSmartCitiesandGreenICTSystems
220
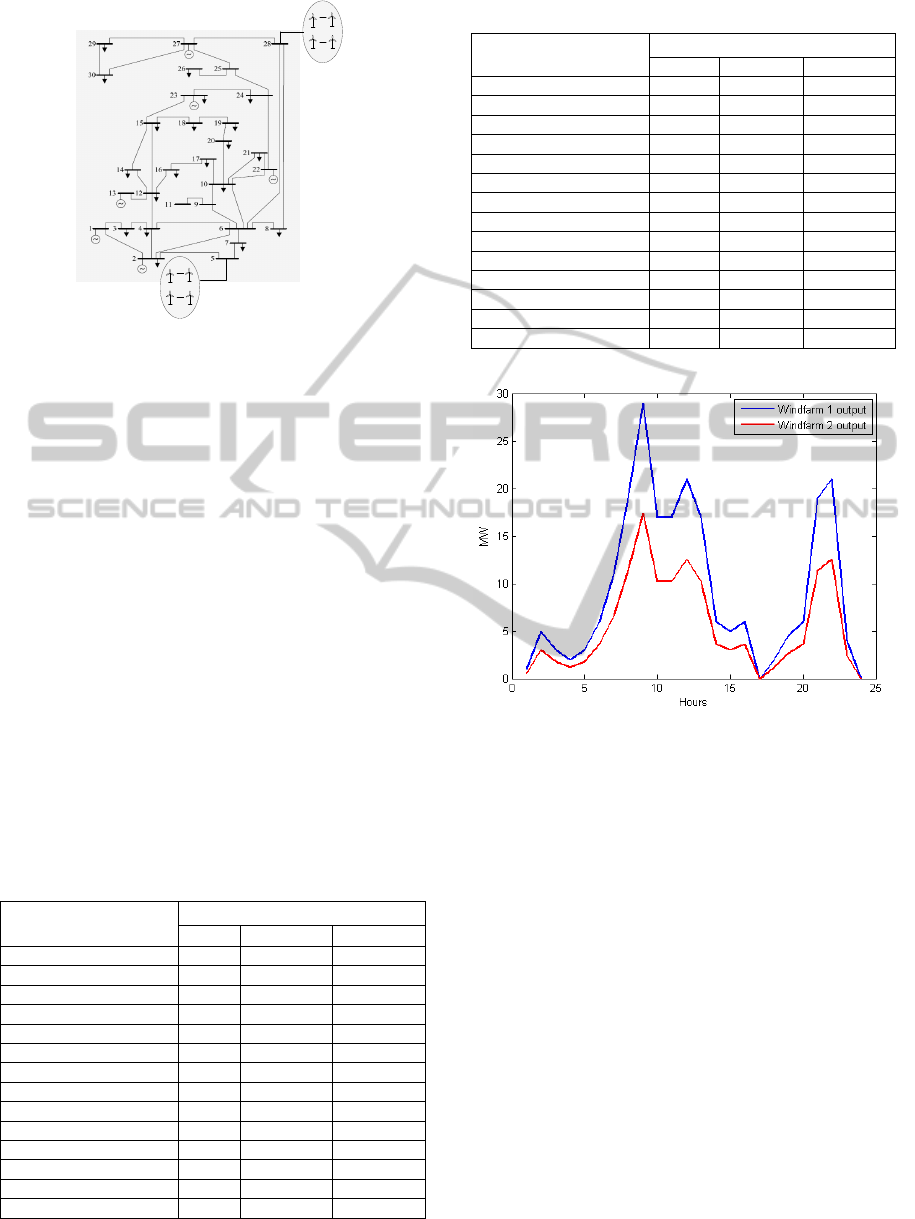
Figure 1: IEEE 30 bus Test System with Wind Farm.
4 SIMULATION AND RESULTS
The IEEE 30 bus test system is used to simulate
power market operation and the system configuration
is shown in Figure 1. The system consists of two
Gencos- Genco I and Genco II respectively. Genco I
consists of three non-wind generators –units G1, G2
and G3 connected at buses 1, 2 and 13 respectively.
Genco II also consists of three non-wind generators –
units G4, G5 and G6 connected at buses 22, 23 and
27 respectively. Genco I consists of a wind farm unit
G7 with capacity of 59.4 MW at bus 5 and Genco II
consists of a wind farm with capacity of 35.6 MW at
bus 28. Generator data is listed in Tables I (A) and I
(B). The intermittency and volatility of the wind
power and time varying loads for a 24 hour period
were considered in this study. Figure 2 shows
forecasted wind farm output for 24 hours for both the
wind farms considered in this paper.
Table 1 (A): Genco I - Generator Data and Constraints.
Parameter Genco I
G1 G2 G3
Unit Type Coal Coal Oil
Pmin (MW) 15 15 10
Pmax(MW) 80 80 50
Ramp Rate(MW/h) 40 40 30
Quick Start (MW) 10 10 1
Minimum ON time (h) 2 2 2
Minimum OFF time 2 2 2
Initial State ON ON ON
Initial Hour (h) 4 4 4
Fuel Price ($/MBtu) 2 2 2
Startup (MBtu) 60 60 30
Cost Coeff. a ($/MWh
2
) 0 0 0
Cost Coeff. b ($/MWh) 25 24.75 26
Cost Coeff. c ($/h) 0.02 0.0175 0.0250
Table 1 (B): Genco II - Generator Data and Constraints.
Parameter Genco II
G4 G5 G6
Unit Type Coal Coal Oil
Pmin (MW) 10 5 10
Pmax(MW) 50 30 55
Ramp Rate(MW/h) 30 15 30
Quick Start (MW) 5 5 1
Minimum ON time (h) 2 2 2
Minimum OFF time 1 1 1
Initial State OFF OFF OFF
Initial Hour (h) 2 2 2
Fuel Price ($/MBtu) 2 2 2
Startup (MBtu) 10 10 10
Cost Coeff. a ($/MWh
2
) 0 0 0
Cost Coeff. b ($/MWh) 24 26 25.25
Cost Coeff. c ($/h) 0.0625 0.025 0.0083
Figure 2: Forecasted Wind farm output.
4.1 MCP Determination using OPF
A 24 hour optimal power flow solution is run for the
system with the forecasted wind farm output. In the
event of wind power availability, dispatching
generators should reduce their outputs to
accommodate the wind power in the energy market.
Figure 3 shows that the presence of wind generation
decreases the incremental cost of the online
generators and thereby decreases the MCP. Wind
energy, thus has a positive impact on customer
benefit. With the new MCP, the PBUC program
determines the optimal commitment schedule of the
generators. To integrate the effects of uncertainty in
wind availability, three wind scenarios were
considered. Scenario I assumes low volatility in wind
power for the forecasted wind output shown in Figure
3.
PricebasedUnitCommitmentwithWindGenerationandMarketClearingPriceVariations
221

Figure 3: Variation of Market Clearing Price with Wind
Integration.
Table 2: 24 HOUR Wind Farm Data.
Wind
Power
Wind
Farm1
MW
Wind
Power
S-1
MW
Wind
Power
S-2
MW
Wind
Power
S-3
MW
Wind
Power
Wind
Farm2
MW
Wind
Power
S-1
MW
Wind
Power
S-2
MW
Wind
Power
S-3
MW
1 0.886 0.85 1 0.6 0.531 0.51 0.6
5 4.55 4.25 5 3 2.73 2.55 3
3 2.67 2.55 3 1.8 1.602 1.53 1.8
2 2 1.7 2 1.2 1.2 1.02 1.2
3 3.07 2.55 3 1.8 1.842 1.53 1.8
6 6.082 5.1 6 3.6 3.649 3.06 3.6
11 10.12 9.35 11 6.6 6.077 5.61 6.6
19 18.97 16.15 19 11.4 11.38 9.69 11.4
29 27.50 24.65 29 17.4 16.50 14.79 17.4
17 17.60 14.45 17 10.2 10.56 8.67 10.2
17 16.23 14.45 17 10.2 9.738 8.67 10.2
21 20.33 17.85 21 12.6 12.20 10.71 12.6
17 17.21 14.45 17 10.2 10.33 8.67 10.2
6 5.565 5.1 6 3.6 3.339 3.06 3.6
5 5.385 4.25 5 3 3.231 2.55 3
6 5.97 5.1 0 3.6 3.582 3.06 0
0 0 0 0 0 0 0 0
2 0 0 0 1.2 0 0 0
4.5 4.2 3.825 0 2.7 2.52 2.295 0
6 6.72 5.1 6 3.6 4.032 3.06 3.6
19 22.16 16.15 19 11.4 13.29 9.69 11.4
21 21.97 17.85 21 12.6 13.18 10.71 12.6
4 3.91 3.4 4 2.4 2.34 2.04 2.4
0 0 0 0 0 0 0 0
Scenario II represents high volatility which follows a
normal distribution with a standard deviation of 15%.
In Scenario III, the intermittency of wind power is
considered during hours 17-20, when the wind power
drops to zero. The simulated scenarios for both the
wind farms are in Table 2.
4.2 Dispatch with Forecasted Wind
Power
With forecasted wind power in Table 2, PBUC
determines the dispatch of the non-wind units as
detailed in Table 3. For Genco I, PBUC determines
units G1, G2 and G3 to be “ON” for hours 1-24 for
all scenarios to maximize profit with the initial state
of all units being “ON”.
Table 3: PBUC Plans For Generators.
Scenario Hours (0-24)
Forecasted
Schedule
without Wind
Genco I Unit G1 1111111111111111111111111
Unit G2 1111111111111111111111111
Unit G3 1111111111111111111111111
Genco II Unit G4 0111111111111111111111111
Unit G5 0111111111111111111111111
Unit G6 0111111111111111111111111
Forecasted
Schedule with
Wind
Genco I Unit G1 1111111111111111111111111
Unit G2 1111111111111111111111111
Unit G3 1111111111111111111111111
Genco II Unit G4 0111111111111111111111111
Unit G5 0111111111111111111111111
Unit G6 0111111111111111111111111
Scenario 1
Low Wind
Volatility
Genco I Unit G1 1111111111111111111111111
Unit G2 1111111111111111111111111
Unit G3 1111111111111111111111111
Genco II Unit G4 0111111111111111111111111
Unit G5 0111111000000000000000000
Unit G6 0111111111111111111111111
Scenario 2 High
Wind Volatility
Genco I Unit G1 1111111111111111111111111
Unit G2 1111111111111111111111111
Unit G3 1111111111111111111111111
Genco II Unit G4 0111111111111111111111111
Unit G5 0111111000000000000000000
Unit G6 0111111111111111111111111
Scenario 3 Brief
Wind
Intermittency
Genco I Unit G1 1111111111111111111111111
Unit G2 1111111111111111111111111
Unit G3 1111111111111111111111111
Genco II Unit G4 0111111111111111111111111
Unit G5 0111111111111111111111111
Unit G6 0111111111111111111111111
Figure 4(a): Bidding Strategy of the Genco I with and
without wind.
SMARTGREENS2015-4thInternationalConferenceonSmartCitiesandGreenICTSystems
222

Figure 4(b): Bidding Strategy of the Genco II with and
without wind.
For Genco II, the initial state of all units is “OFF”
and PBUC determines the units G4 and G6 to be
“ON” for hours 1-24 for all scenarios to maximize
profit. Unit G5 turns off from hours 7-24 for scenarios
I and II. With the availability of wind power, both
Genco I and Genco II bid more in the market as
shown in Figures 4(a) and 4(b). The ancillary services
bid for both the cases remains same because all the
units of Genco I and Genco II remain “ON” for hours
1-24, therefore not capable of providing non-spinning
reserve. These energy bids with wind are assumed to
be contracted by the Genco to the power pool in the
day ahead market.
Figure 5(a): Bidding Strategy for Genco I in Scenario I.
Figure 5(b): Bidding Strategy for Genco II in Scenario I.
4.3 Scenario I:
Dispatch with Low Wind Volatility
Scenario I, considers low volatility in forecasted wind
power. This challenges the Gencos as changes in the
expected wind power may require a re-dispatch from
the non-wind generators. The PBUC solution for this
scenario in Table 3 shows the commitments of units
G1, G2 and G3, G4 and G6 are same as the forecast
while unit G5 turns off for hours 7-24 to maximize
profits.
Figures 5(a) and 5(b) show the committed
dispatch and the actual dispatch for Genco I and
Genco II in Scenario I. It is noticed that, due to low
wind volatility, the Genco I is able to satisfy its
contract for hours 1-24. For Genco II, there is
decrease in the dispatch from committed value for
hours 7-24 as unit G5 turns “OFF”. The other units,
namely G4 and G6 do not have enough ramping and
quick start capabilities to increase the dispatch to
committed value. The units with faster ramp rate G4
and G6 have a quick start of only 5 MW and 1 MW
respectively. For hours 1-24, the ancillary services
contract is satisfied by the Genco I. For Genco II there
is an increase in the ancillary services dispatch from
hours 7-24 as the “OFF” unit G5 provides non-
spinning reserve.
Figure 6(a): Bidding Strategy for Genco I in Scenario II.
Figure 6(b): Bidding Strategy for Genco II in Scenario II.
PricebasedUnitCommitmentwithWindGenerationandMarketClearingPriceVariations
223
4.4 Scenario II:
Dispatch with High Wind Volatility
Scenario II, considers high volatility in forecasted
wind power. The PBUC solution for this scenario in
Table 3 shows the commitments of units G1, G2 and
G3, G4 and G6 are same as the forecast while the
PBUC schedule turns the unit G5 “OFF” for hours 7-
24. Figures 6(a) and 6(b) show the committed
dispatch and the actual dispatch for Genco I and
Genco II in Scenario II. From hours 1-6 Genco I is
still able to maintain the committed value because the
higher capacity units G1 and G2 are able to ramp up
to meet the volatility. It is noticed that, due to the high
volatility of the wind, Genco I violates its contract for
hours 6-23.
Similarly, highly volatile wind generation results
in Genco II violating its contract with the power pool
for hours 7-24 as shown in Figure 6(b) due to
insufficient ramping and quick start capabilities of
units G4 and G6, with the unit G5 turned “OFF”. For
hours 1-24, the ancillary services contract is satisfied
by Genco I. For Genco II there is an increase in the
ancillary services dispatch from hours 7-24 as the
“OFF” unit G5 provides non-spinning reserve.
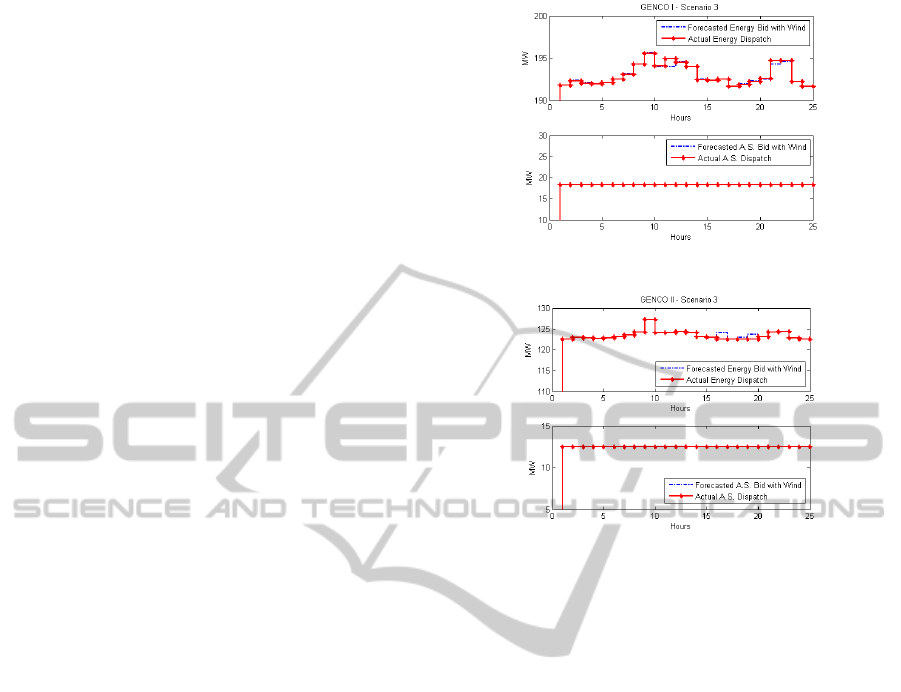
4.5 Scenario III:
Dispatch with Wind Intermittency
Scenario III, considers a brief intermittency in
forecasted wind power. The PBUC solution for this
scenario in Table 3 determines the commitments of
all the units to be same as the forecasted commitment
to maximize profit.
Figures 7(a) and 7(b) show that the Genco I
satisfies the contract during wind intermittency in
hours 17-20 by ramping up units G1 and G2. It is
evident that in this scenario, the ramp and quick start
constraints of G1 and G2 are such that brief wind
intermittency can be met by Genco I and satisfy the
contracted value. For Genco II, it is evident that the
ramp up and quick start capabilities of units G4, G5
and G6 are insufficient to meet the wind intermittency
in hours 17-20 thereby resulting in the violation of
contract. Ancillary services like spinning and non-
spinning reserve can be met by both Gencos, without
violation of this contract due to brief periods of wind
intermittency. From the three scenarios, it is evident
that, Genco I with units having higher ramping and
quick start capabilities is able to meet the contract to
the power pool during periods of low volatility and
brief wind intermittency. Genco II is observed to
violate its contract during these scenarios. For highly
volatile wind conditions, both the Gencos fail to
Figure 7(a): Bidding Strategy for Genco I in Scenario III.
Figure 7(b): Bidding Strategy for Genco II in Scenario III.
satisfy the contract in the hours with high wind
volatility.
The results obtained in this paper compare well with
existing literature and provides avenues for future
research in the area of PBUC strategies for Gencos
owning wind farms. In this paper, it has been shown
that the presence of wind generation has a positive
impact on the electricity prices and leads to reduction
of MCP and incremental cost of generators. This
confirms with the detailed MCP studies conducted in
in (Sinha, 2008), which state that the accurate wind
power prediction and the resulting MCP calculations
can result in greater savings for customers and
additional revenue for Gencos. It is also demonstrated
in this paper that under conditions of low wind
volatility and brief wind intermittency, the Gencos
will be able to meet their contracts to the power pool
if they have sufficient quick start generating units.
Under highly volatile wind conditions, the Gencos
may fail to meet their power contracts. Wind power
can also play a vital role in satisfying the ancillary
services contracts to the power market. These results
reinforces the studies conducted in (Sinha, 2008) and
(Ting, 2013), which prove that uncertainty in wind
production is the major factor for Gencos to compete
with conventional power producers in the market. In
case of non-availability of wind power, Gencos must
be ready to supply complete load to be sustainable
and recover costs.
SMARTGREENS2015-4thInternationalConferenceonSmartCitiesandGreenICTSystems
224

5 CONCLUSIONS
A novel approach to PBUC by considering the effects
of wind intermittency and market price variations is
presented in this paper. The results indicate that the
profit of the Genco is largely dependent on the wind
intermittency and volatility. The results for the 30 bus
system show that the physical limitations of the units
such as ramping and quick start are crucial for
accommodating the volatility of the wind power. In a
wind based power system a tradeoff between security
and economy must be achieved such that the security
of the system is maintained while the operational cost
is minimized. Another option for accommodating
wind power volatility is to allocate additional hourly
reserves or utilize battery storage. The problem with
this option is that the security of the power system
may not be guaranteed since the system may not have
enough ramping capabilities in real time and the
battery may be bound by physical constraints.
ACKNOWLEDGEMENTS
The authors would like to acknowledge partial
funding support from NSF#1351201 CAREER grant,
NSF# 1232168 for this research work. The authors
also would like to thank NETL RUA Grid
Technologies Collaborative team.
REFERENCES
Senjyu, T., Yamashiro, H., et. al., 2003. Fast solution
technique for large-scale unit commitment problem
using genetic algorithm. Proceedings of IEE
Generation, Transmission and Distribution , Vol. 150,
Issue 6, pp. 753-760.
Mantawy, A.H., Abdel-Magid, Y.L. and Selim, S.Z., 1997.
A new genetic algorithm approach for unit
commitment. Proceedings of the International
Conference on Genetic Algorithms in Engineering
Systems, pp.215-220.
Pokharel, B.K., Shrestha, G.B., et. al., S. E., 2005. Price
based unit commitment for Gencos in deregulated
markets. Proceeding of the IEEE Power Engineering
Society GM, pp. 2159-2164.
Li, T., and Shahidehpour, M., 2005. Price based unit
commitment: A case of Lagrangian relaxation versus
mixed integer programming. IEEE Tran. on Power
Systems, Vol. 20, No. 4.
Attaviriyanupap, P., Kita, H., Tanaka, E., and Hasegawa, J.,
2003. A hybrid LR-EP for solving new profit based UC
problem under competitive environment. IEEE
Transactions on Power Systems, Vol. 18, No. 1, pp:
229-237.
Xiaohui, Y., Yanbin, Y., Cheng, W. and Xiaopan, Z., 2005.
An improved PSO approach for profit based unit
commitment in electricity market. IEEE/PES
Transmission and Distribution conference &
Exhibition: Asia and Pacific, Dalian, China.
Yu, J., Zhou, J., Wu, W. and Yang, J., 2004. Solution of the
profit-based unit commitment problem by using the
multi agent system. Proceedings of the 5
th
World
Congress on Intelligent Control and Automation,
Hangzhou, China.
Fabbri, A., GomezSanRoman, T., et. al., 2005. Assessment
of the Cost Associated With Wind Generation
Prediction Errors in a Liberalized Electricity Market.
IEEE Transactions on Power Systems, Vol. 20, No. 3,
pp: 1440- 1446.
Milligan, M., Porter, K., 2005. Determining the capacity
value of wind: A survey of methods and
implementation. Proceedings of Wind Power, Denver.
Sideratos, G., Hatziargyriou, N.D., 2007. An advanced
statistical method for wind power forecasting. IEEE
Transactions on Power Systems, Vol. 22, No. 1.
Kariniotakis, G., Waldl, I.H.P., et. al., 2006. Next
generation forecasting tools for the optimal
management. Proceedings of the International
Conference on Probabilistic Methods Applied to Power
Systems, pp. 1-6.
DeMeo, E., A., Grant, W., Milligan, M., R., Schuerger, M.,
J., 2005. Wind plant integration: Cost, status & issues,”
IEEE Power and Energy Magazine, Vol. 3, No. 6, pp:
38–46.
Zeineldin, H.H.; El-Fouly, T.H.M.; El-Saadany, E.F.;
Salama, M.M.A., 2009. Impact of wind farm
integration on electricity. Renewable Power
Generation, IET, Vol.3, No.1.
Sinha, A., Basu, A.K., Lahiri, R.N., Chowdhury, S.,
Chowdhury, S.P., Crossley, P.A., 2008. Setting of
market clearing price (MCP) in microgrid power
scenario. Proceedings of the IEEE Power and Energy
Society General Meeting - Conversion and Delivery of
Electrical Energy in the 21st Century.
Singh, S.N., Erlich, I., 2008. Strategies for Wind Power
Trading in Competitive Electricity Markets. IEEE
Transactions on Energy Conversion, Vol. 23, No. 1.
Martin, S., Smeers Y. and Aguado J.A., 2015. A Stochastic
Two Settlement Equilibrium Model for Electricity
Markets With Wind Generation. IEEE Transactions on
Power Systems, Vol. 30, No. 1, pp. 233-245.
Sharma, K.C., Bhakar, R. and Padhy, N.P., 2014. Stochastic
cournot model for wind power trading in electricity
markets. IEEE PES General Meeting, pp.1-5.
Ting Dai and Wei Qiao, 2013. Trading Wind Power in a
Competitive Electricity Market Using Stochastic
Programing and Game Theory. IEEE Transactions on
Sustainable Energy, Vol. 4, No. 3, pp. 805-815.
PricebasedUnitCommitmentwithWindGenerationandMarketClearingPriceVariations
225
