
The Case for Visualization as a Service
Mobile Cloud Gaming as an Example
Abdelmounaam Rezgui
1
and Zaki Malik
2
1
Department of Computer Science & Engineering, New Mexico Tech, Socorro, NM, U.S.A.
2
Department of Computer Science, Wayne State University, Detroit, MI, U.S.A.
Keywords:
Mobile Cloud Gaming, Visualization as a Service, GPUs, Offloading.
Abstract:
In recent years, significant progress has been made to improve the power efficiency of mobile devices. In
particular, new GPU architectures have made it possible to run compute-intensive applications directly on
battery-powered mobile devices. In parallel, research is also being conducted in the area of application of-
floading, the process of running compute-intensive tasks on cloud servers and delivering the results of these
computations to mobile devices through their wireless interfaces. It is important to understand the power con-
sumption implications of each of these two options. In this paper, we use mobile cloud gaming as an example
to evaluate and compare these two alternatives (running games on the cloud or on mobile devices.) Based on
this comparison, we introduce the concept of Visualization as a Service (VaaS) as a new model to design and
implement graphics-intensive applications for mobile devices. In this model, advanced visualization capabili-
ties (e. g., interactive visualization of high resolution videos/images) would be provided to mobile users as a
service via the Internet. We show through actual hardware specifications that, despite the recent introduction
of ultra low power GPUs for mobile devices, it remains far more power efficient to offload graphics-intensive
tasks to the cloud. The associated latency can still be tolerated in most applications.
1 INTRODUCTION
The growth in the use of mobile devices (mobile
phones, tablets, and ultra mobile PCs) is driving a
phenomenal market shift. A 2013 Gartner report (Ta-
ble 1) predicted that, by 2017, device shipments will
reach more than 2.9 billion units, out of which 90%
will be mobile devices (Milanesi et al., 2013). This
growth is accompanied by an equally phenomenal
boom in mobile applications. According to the re-
search firm MarketsandMarkets, the total global mo-
bile applications market is expected to be worth $25
billion by 2015 (up from about $6.8 billion in 2010)
(MarketsandMarkets, 2010). A 2012 study by the Ap-
plication Developers Alliance found that 62% of the
U. S. online population owned app-capable devices
and that 74% of those device owners use mobile ap-
plications. As the rendering capabilities of mobile de-
vices improves, mobile applications are becoming in-
creasingly graphics-intensive. This requires intensive
computations that quickly drain the device’s battery.
Several solutions are being developed to reduce
power consumption in graphics-intensive mobile ap-
plications. Some solutions are to be used at develop-
ment time while others are to be used when the appli-
cation is running. The former focus on tools that help
developers estimate power consumption at develop-
ment time. For example, in (Thompson et al., 2011),
the authors present SPOT (System Power Optimiza-
tion Tool), which is a model-driven tool that auto-
mates power consumption emulation code generation.
In (Hao et al., 2013), the authors use program analy-
sis during development time to estimate mobile appli-
cation energy consumption. The latter type of solu-
tions focus on reducing power consumption of hard-
ware components such as the GPU or NIC at run-time.
Examples include the racing to sleep technique (that
sends data at the highest possible rate), wide channels,
and multiple RF chains (Halperin et al., 2010).
A third alternative is application offloading, the
process of running compute-intensivetasks on servers
(often in the cloud) and delivering the results of these
computations to mobile devices through their wireless
interfaces. However, these wireless interfaces also
may consume substantial amounts of power when re-
ceiving large amounts of data as is typical in many
modern, interactive, graphics-intensive mobile appli-
cations. It is therefore important to understand the
577
Rezgui A. and Malik Z..
The Case for Visualization as a Service - Mobile Cloud Gaming as an Example.
DOI: 10.5220/0005437105770585
In Proceedings of the 5th International Conference on Cloud Computing and Services Science (CLOSER-2015), pages 577-585
ISBN: 978-989-758-104-5
Copyright
c
2015 SCITEPRESS (Science and Technology Publications, Lda.)
Table 1: Worldwide Devices Shipments by Segment (Thousands of Units) (Milanesi et al., 2013).
Device Type 2012 2013 2014 2017
PC (Desk-Based and Notebook) 341,263 315,229 302,315 271,612
Ultramobile 9,822 23,592 38,687 96,350
Tablet 116,113 197,202 265,731 467,951
Mobile Phone 1,746,176 1,875,774 1,949,722 2,128,871
Total 2,213,373 2,411,796 2,556,455 2,964,783
power consumption implications of the two alterna-
tives: running the graphics-intensive application on
the cloud or on the mobile device itself. In this paper,
we use mobile cloud gaming as an example to ana-
lyze and compare these two alternatives in terms of
power consumption. We show through actual hard-
ware specifications that, despite the recent introduc-
tion of ultra low power GPUs for mobile devices, it
remains far more power efficient to offload graphics-
intensive tasks to cloud servers. To make our discus-
sion concrete, we focus on two cases of mobile de-
vices: (i) notebooks and (ii) smartphones. In both
cases, we only consider gaming using the device’s
WiFi interface not its cellular interface. The reason
for this is that the high latency and high cost make
mobile cloud gaming using cellular networks (UMTS,
LTE, etc.) an impractical alternative for most con-
sumers. We will elaborate on this in Section 3.
This paper is organized as follows. We first give
an overviewof mobile cloud gaming. In Section 3, we
contrast cellular-based and WiFi-based mobile cloud
gaming from the perspectives of power consumption,
throughput, latency, and cost. In Sections 4 and 5,
we present power consumption trends in modern mo-
bile GPUs and 802.11 network cards. In Section 6,
we quantitatively evaluate and compare power con-
sumption of a gaming session in the two previously
mentioned scenarios in the context of notebooks. We
repeat the same analysis for smartphones in Section 7.
In Section 8, we give the conclusions from our study
and suggest directions for future research.
2 WHAT IS MOBILE CLOUD
GAMING?
Mobile cloud computing (MCC) is the process of of-
floading compute-intensivetasks from mobile devices
to cloud servers (Soliman et al., 2013; Shiraz et al.,
2013). The purpose is often to save power on the mo-
bile device and/or access servers with much higher
computing power. A prime example of MCC is mo-
bile cloud gaming which is the process of provid-
ing video games on-demand to consumers through
the use of cloud technologies. One benefit is that
the cloud, instead of the user’s device, carries out
most of the computations necessary to play the game,
e. g., complex graphical calculations. This is obvi-
ously a tremendous advantage in case the player uses
a battery-powered, mobile device. Even when power
is not a critical issue for the user’s device, cloud gam-
ing still provides other cloud services, e. g., stor-
age. Cloud gaming enables power savings also on the
cloud itself as it makes it possible that several play-
ers simultaneously share cloud GPUs. For example,
Nvidia’s VGX Hypervisor manages GPU resources to
allowmultiple users to share GPU hardware while im-
proving user density and the utilization of GPU cycles
(Nvidia, 2015a). To illustrate, a single cloud gaming-
capable Nvidia VGX K2 unit requires 38 Watts per
cloud user (Nvidia, 2015c), whereas a comparable
single-user Nvidia GTX 690 consumer unit requires
300 Watts to operate (Nvidia, 2015b). In this case,
cloud gaming can reduce the overall graphics-related
power consumption by 87%.
3 CELLULAR-BASED VS.
WiFi-BASED MOBILE CLOUD
GAMING
Mobile cloud gaming may be achieved using cellular
connections or WiFi connections. While both options
are technically possible and relatively comparable in
terms of power consumption, the WiFi option seems
much more attractive when we consider throughput,
latency and cost. In this section, we present results
from recent studies analyzing power consumption,
throughput, latency, and cost in both scenarios:
3.1 Power Consumption and
Throughput
In (Carroll and Heiser, 2010), the authors analyze
power consumption of smartphones. In particular,
they studied power consumption of the two main net-
working components of the device: WiFi and GPRS
(provided by the GSM subsystem). The test con-
sisted of downloading a simple file via HTTP using
wget
. The files contained random data, and were 15
CLOSER2015-5thInternationalConferenceonCloudComputingandServicesScience
578
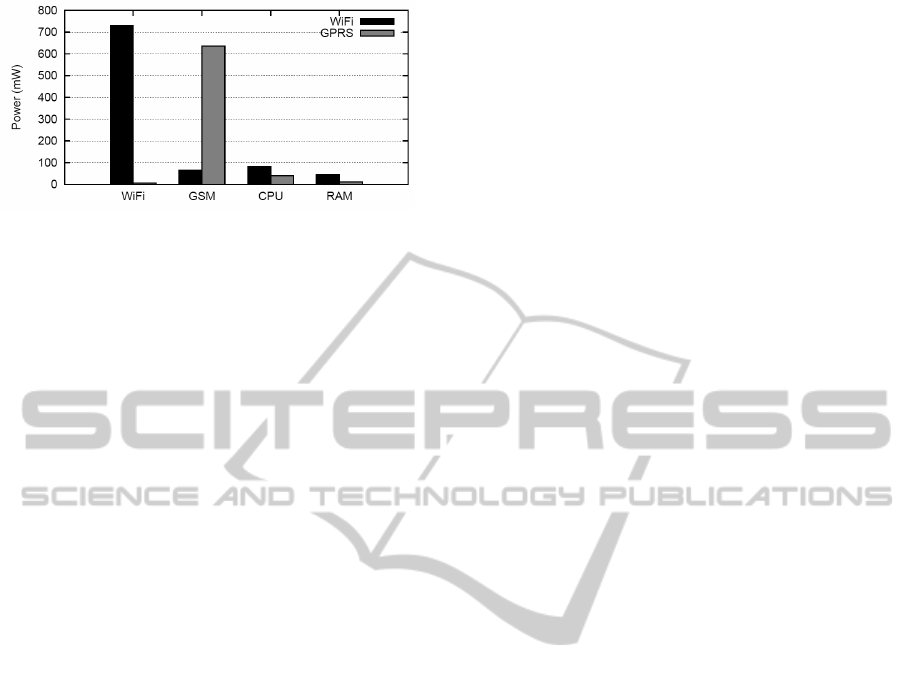
Figure 1: Power Consumption of WiFi and GSM Modems,
CPU, and RAM (Carroll and Heiser, 2010).
MiB for WiFi, and 50 KiB for GPRS. While the test
was not a gaming session, it still gave valuable in-
sights. The experiments showed that WiFi achieved
a throughput of 660.1 ± 36.8 KiB/s, and GPRS 3.8
± 1.0 KiB/s. However, they both show comparable
power consumption far exceeding the contribution of
the RAM and CPU (Figure 1). The experiments also
showed that, with the increase in throughput possible
using WiFi, CPU and RAM power consumption also
increases reflecting the increase in the cost of process-
ing data with a higher throughput.
3.2 Latency
In the context of mobile cloud gaming, latency refers
to the timespan between a user’s action and the cor-
responding reaction (Lampe et al., 2013), e. g., time
between the action of pressing a button and seeing
a character in the game move as a result of that ac-
tion. High latency is a real challenge in mobile cloud
gaming. Wireless connections (WiFi and cellular)
and even wired residential end host round trip times
(RTTs) can exceed 100 ms (Lee et al., 2014). To many
gamers, this is the point when a game’s responsive-
ness becomes unacceptable. A recent effort to reduce
latency in mobile cloud gaming is Outatime, a specu-
lative execution system for mobile cloud gaming that
is able to mask up to 250 ms of network latency (Lee
et al., 2014). It produces speculative rendered frames
of future possible outcomes, delivering them to the
client one entire RTT ahead of time.
While latency is an issue in both cellular-based
and WiFi-based mobile gaming, WiFi connections
typically have much less latency than cellular connec-
tions (Lampe et al., 2013).
3.3 Cost
Cost is also a major factor in favor of WiFi-based mo-
bile cloud gaming. For example, in (Lampe et al.,
2013), the authors give an analytical assessment that
shows that the cost (from cellular data transfer) of a
gaming session of one hour would be about 2.36 Eu-
ros without including the likely additional usage fee
to be paid to the cloud gaming provider.
As we may conclude from the previous discus-
sion, WiFi-based mobile cloud gaming is currently
more practical than cellular-based mobile cloud gam-
ing. We, therefore, limit our discussion to this option
in the remainder of this paper.
4 POWER CONSUMPTION
TRENDS IN MODERN MOBILE
GPUs
It is currently generally true that GPUs offering a
good rendering capability consume much power for
operation and cooling. To illustrate the current power
consumption trends of mobile GPUs, we list in Ta-
ble 2 some modern notebook GPUs and their respec-
tive power consumptions. The table suggests that
playing a game on a notebook equipped with one
of the listed GPUs may not be a viable option. For
example, the Dell Precision M6700 mobile worksta-
tion (which Dell touted as the “world’s most power-
ful 17.3” mobile workstation”) is equipped with the
Nvidia Quadro K5000M GPU. The configuration can
pull 98 Watts of power when running on battery un-
der a heavy CPU or GPU load. This means that
it would be possible to drain the system battery in
about an hour (Notebook Review, 2015). Even with
this limited ability to support long running, compute-
intensive applications, this configuration costs more
than $2K. Better battery life may be possible but with
much more expensive configurations. Efforts are un-
derway to develop mobile devices with power effi-
cient computing components (e. g., multicore CPUs
and ultra low power GPUs) and batteries that can
run compute-intensive applications (e. g., games and
other graphics-intensiveapplications) for many hours.
For example, Nvidia is introducing Tegra 4, a mobile
GeForce GPU with up to 72 custom cores, a quad-
core ARM Cortex-A15 processor with a fifth Com-
panion Core that further improves performance and
battery life. According to Nvidia, a battery of a ca-
pacity of 38 watt-hours would be sufficient to operate
a Tegra 4 mobile device running a gaming application
between 5 and 10 hours. This corresponds to a power
consumption (for the entire device) of 4 to 8 Watts
(Hruska, 2013). However, mobile devices with these
high-end configurations will remain beyond the reach
of average users for the foreseeable future.
TheCaseforVisualizationasaService-MobileCloudGamingasanExample
579
Table 2: Energy Consumption of Some Modern Notebook GPUs.
GPU Card Power Consumption (W)
NVIDIA GeForce GTX 680M SLI 2 x 100
AMD Radeon HD 7970M Crossfire 2 x 100
NVIDIA GeForce GTX 680MX 122
NVIDIA GeForce GTX 675M SLI 2 x 100
GeForce GTX 680M 100
Quadro K5000M 100
AMD Radeon HD 7970M 100
5 POWER CONSUMPTION
TRENDS IN MODERN
NOTEBOOK NICs
The original 1997 release of the IEEE 802.11 stan-
dard operated in the 2.4 GHz frequency band and pro-
vided a data bit rate of 1 to 2 Mb/s. The standard re-
lease approved in February 2014 (known as 802.11ad)
operates in the 2.4/5/60 GHz frequency bands and
provides a data bit rate of up to 6.75 Gbit/s. While
higher bit rates often translate into higher power con-
sumption, this is less true in recent ultra-low power
802.11 standards. For example, today’s fastest 3 an-
tenna 802.11n device can achieve 450 Mbps. A single
antenna 802.11ac device can achieve a similar bit rate
with similar power consumption. This means that a
typical tablet with single antenna 802.11n 150Mbps
WiFi can now support 450 Mbps with 802.11ac with-
out any increase in power consumption or decrease in
battery life (Netgear, 2012).
6 GRAPHICS-INTENSIVE
APPLICATIONS: GPUs VS. NICs
To assess the benefits of using a mobile GPU ver-
sus offloading to the cloud, we consider gaming as
it is a typical example of graphics-intensive mobile
applications. Specifically, we consider four modern
games that rely heavily on GPUs. We compare two
scenarios in terms of power consumption. In the first
scenario, the game is run entirely on the mobile de-
vice and uses only its GPU. In the second scenario,
we consider an execution where the game is run on
a cloud server and the mobile device only receives
and renders sequences of frames produced by the
server. We analytically evaluate power consumption
in these two scenarios and show that, with modern
wireless technology, offloading is a far better alter-
native to running graphics-intensive applications us-
ing the device’s GPU. To make the comparison even
more in favor of the GPU-based alternative, we ig-
nore the power consumption of the device’s disk. We
assume that, when a graphics-intensive application is
run on a mobile device, most of the power is con-
sumed by the device’s GPU. This is becoming in-
creasingly true with the wide availability of mobile
devices with solid-state disk drives.
To compare power consumption in the two scenar-
ios, we first present a simple model that captures the
interactions between the player and the gaming appli-
cation. We will assume that, during a given gaming
session of duration t, the player takes an action after
every r seconds in average. We call r the reactivity
of the player. To respond to the player’s action, the
application generates a video stream of length v sec-
onds.
1
So, during the entire session, the application
generates t/r video sequences whose length is v sec-
onds each. In total, the application generates tv/r sec-
onds of video during the given gaming session.
6.1 Scenario 1: Gaming using the
Mobile Device’s GPU
To assess the power consumed by a notebook’s GPU
in a gaming session, we used the benchmark pre-
sented in (NoteBookCheck, 2014). The benchmark
has a large number of notebook GPUs and a num-
ber of popular games. For each combination of
game and GPU card, the benchmark gives the aver-
age number of frames per second (fps) that the GPU
card achieves with four different resolution levels:
Low (L), Medium (M), High (H), and Ultra (U). The
benchmark considers that a frame rate of 25 fps is
sufficient for fluent gaming. For the purpose of this
study, we considered four GPU cards and four 2014
games, namely GRID Autosport, Watch Dogs, Titan-
fall, and Thief. Table 3 gives the frame rates ob-
1
This is to simplify our discussion. In practice, the ap-
plication likely generates two video sequences of different
lengths in response to two different actions.
CLOSER2015-5thInternationalConferenceonCloudComputingandServicesScience
580
tained in the given combinations
2
. The resolutions
in the table are as follows: Low (1024x768), Medium
(1366x768), High (1920x1080 for the first two games
and 1366x768 for the last two games), and Ultra
(1920x1080). Table 3 also gives power consumption
for the four GPU cards.
As an example, consider a mobile device equipped
with a GPU of type Nvidia GeForce GTX 850M. As
shown in Table 3, this GPU card will consume be-
tween 40 and 45 Watts in one hour. We will show that
offloading to the cloud (Scenario 2) brings an order of
magnitude reduction in terms of the power consumed
by the mobile device.
6.2 Scenario 2: Mobile Cloud Gaming
We now evaluate the required data bit rate that the
NIC card of a notebook would have to support to
achieve the same game fluency (i. e., 25 fps) for one
of the four GPU cards of Table 3. As an example, con-
sider again the Nvidia GeForce GTX 850M (which
is the best of the four GPUs in terms of power con-
sumption.) For the game GRID Autosport and for low
resolution, the Nvidia GeForce GTX 850M is able to
support 166.65 fps which is: 166.65 x 1024 x 768 x 8
= 1048471142.4 bits/second (assuming a color depth
of 8 bits/pixel). Thus the NIC card would have to
operate at a bit rate of about 1.05 Gb/s. A similar
computation for the Ultra high resolution level gives
us a bit rate of: 34.7 x 1920 x 1080 x 8 = 575631360
bits/second. Thus, to support the same gaming flu-
ency at the Ultra-high resolution level, the NIC would
have to operate at 575 Mb/s. Note that the required bit
rate at the Ultra-high resolution level is almost half of
that of the required bit rate at the low resolution level
because the GPU supports a lower frame rate at the
Ultra-high resolution level. To support these bit rates,
the mobile device’s NIC would have to be 802.11ad
compliant. The 802.11ad standard is able to support
bit rates up to 6.77 Gbit/s.
To evaluate the power consumed by the device’s
wireless networking card during the considered gam-
ing session, we will assume a model of a wireless
networking card that consumes ρ
tx
watts when in
transmit mode and ρ
rx
watts when in receive mode.
With single-antenna 802.11 devices, the devices can-
not send and receive simultaneously. This normally
implies that one has also to take into account the
cost of frequently switching the device’s radio be-
tween the transmit and the receive mode. This, how-
ever, is changing as mobile devices are now increas-
2
The missing value in the last row corresponds to a test
that could not be run because the GPU card could not sup-
port a sufficiently acceptable frame rate.
ingly being equipped with MIMO (multiple-input and
multiple-output) technology enabling the use of mul-
tiple antennas at both the transmitter and receiver. In
fact, Mobile Experts predicts that the use of MIMO
technology will reach 500 million PCs, tablets, and
smartphonesby 2016 (Madden, 2011). As a result, we
will only take into account power consumption due to
transmission, reception, and idling. We will note the
power consumption of the radio during idling by ρ
id
.
Let µ
t
and µ
r
be the transmission and reception
rates respectively. Let l be the length of the packet
sent to the application when the player takes an ac-
tion. The time needed to transmit this packet is then:
l/µ
t
. Let t be the length of the entire gaming session
(in seconds). During the time t, the device transmits
t/r times where r is the player’s reactivity (defined
earlier). The total time during which the device trans-
mits is therefore:
tl
rµ
t
secs. (1)
The corresponding power consumption during the
period of time t is:
P
tx
=
ρ
tx
tl
rµ
t
(2)
To evaluate the power consumed by the device’s
receiver, recall that our model assumes that, to re-
spond to each player’s action, the application gener-
ates a video stream of length v seconds. The devices
spends v/µ
r
seconds to receive each of these video
streams. Since we have t/r of these video streams
during the considered time period of length t, the de-
vice’s NIC receives video streams during:
tv
rµ
r
secs. (3)
Let P
rx
be the power that the device’s NIC con-
sumes to receive the t/r video sequences. P
rx
can be
given by:
P
rx
=
ρ
rx
tv
rµ
r
(4)
The device’s NIC is in the idle mode when it is not
transmitting and not receiving. This occurs during:
t −
tl
rµ
t
−
tv
rµ
r
secs. (5)
The power consumed by the device’s NIC while
idling is therefore:
P
id
= ρ
id
t(1−
l
rµ
t
−
v
rµ
r
) (6)
TheCaseforVisualizationasaService-MobileCloudGamingasanExample
581
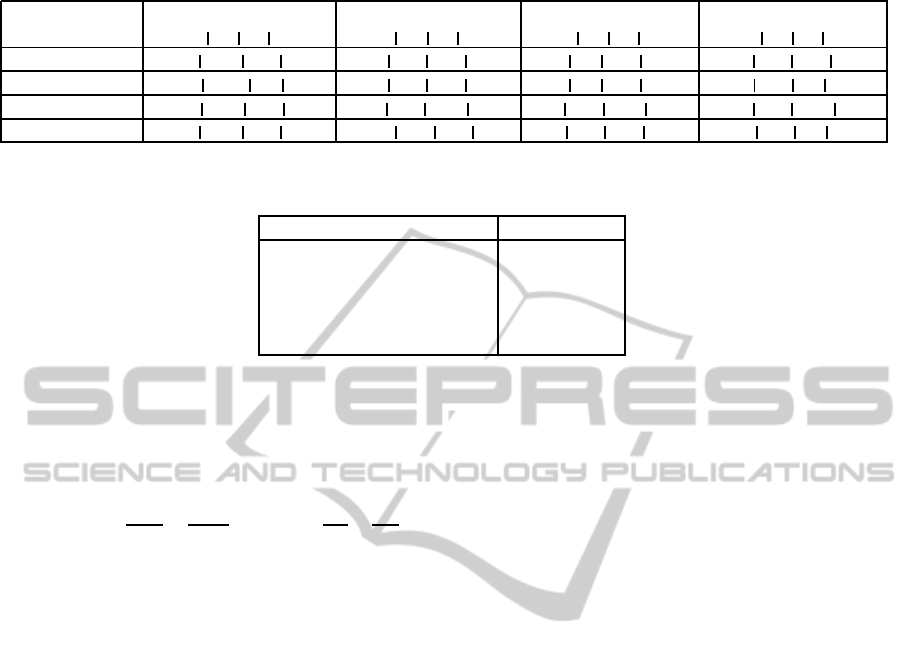
Table 3: Average Frame Rate of Some Combinations of GPU cards, Games, and Resolutions.
GPU Card GRID Autosport Watch Dogs Titanfall Thief
L M H U L M H U L M H U L M H U
GeForce GTX 770M (75 Watts)
199.6 130.3 92.6 46.5 80.7 66.1 27.7 19.8 60 60 59.3 48.3 57.1 51.3 46.8 26.6
GeForce GTX 860M (60 Watts)
192.15 109.65 88 47.2 71.2 60.7 27.7 18.9 60 60 59.5 42.4 60.5 52.7 44 23.95
GeForce GTX 850M (40-45 Watts)
166.65 99.33 68.3 34.7 61.8 52.3 20.75 14.7 60 59.7 53.25 34.3 46.45 39.6 36.65 18.2
GeForce GTX 765M (50-75 Watts)
191.9 130.7 74.1 34.8 81.3 56.9 21.1 60 59.7 54.3 35.6 58.2 43.1 37 19.1
Table 4: Power Consumption for the Intel Dual Band Wireless-AC 7260 802.11ac, 2x2 Wi-Fi Adapter (Hewlett Packard,
2013).
Mode Power (mW)
Transmit 2000
Receive 1600
Idle (WLAN associated) 250
Idle (WLAN unassociated) 100
Radio Off 75
Let P
NIC
(t) be the power consumed by the wire-
less NIC during the t-second gaming session. P
NIC
(t)
is then:
P
NIC
(t) = P
tx
+ P
rx
+ P
id
=
ρ
tx
tl
rµ
t
+
ρ
rx
tv
rµ
r
+ ρ
id
t(1−
l
rµ
t
−
v
rµ
r
)
In practice, one must consider values for ρ
rx
that
accommodate high reception rates (for high defini-
tion gaming) and values for ρ
tx
that correspond to
low transmission rates since the user’s actions usually
translate into short packets.
To illustrate, we consider the case of an HP Elite-
Book Folio 1040 G1 Notebook PC. This notebook is
equipped with the Intel Dual Band Wireless-AC 7260
802.11ac Wi-Fi Adapter whose power consumption
is given in Table 4) (Hewlett Packard, 2013). As-
sume that the NIC card is 80% of the time in recep-
tion mode, 10% of the time in transmit mode, and is
idle (but associated) 10% of the time. If we apply our
power model to this WiFi adapter, power consump-
tion in one hour would be (approximately):
P
NIC
(t) = P
tx
+ P
rx
+ P
idle
= 0.1× 2000+ 0.8× 1600+ 0.1x250
= 1505 milliwatts
assuming the highest Rx and Tx power levels.
Considering the examnple of a notebook equipped
equipped with a GPU of type Nvidia GeForce GTX
850M (Section 6.1), we can estimate that, in one hour,
the GPU card will consume about betwee 0.8x40 W
and 0.8 x 45 W, i.e., between 32W and 36W, assuming
a GPU ustilzation of 80% similar to our assumption of
the NIC card being in the Rx mode 80 % of the time.
From the results obtained in the two scenarios,
it is clear that using the wireless networking inter-
face in a gaming session consumes much less power
than using a modern GPU card installed on the same
device. Specifically, the power consumed using the
wireless card would be around (1505 / 34000) x 100,
i.e., around 4.42% of the power consumed by the on-
device GPU.
7 MOBILE CLOUD GAMING
USING SMARTPHONES
We now compare power consumption between GPU-
based gaming and cloud-based gaming on smart-
phones.
7.1 Power Consumption of GPU-based
Gaming on Smartphones
In (Kim et al., 2015), the authors measured power
consumption of a Qualcomm Adreno 320 GPU in a
Google Nexus 4 smartphone. They used two games
in their tests: Angry Birds (2D game) and Droid In-
vaders (3D game). The authors report results for a
gaming session that lasted 560 seconds for Angry
Birds and 505 seconds for Droid Invaders. Through-
out the two gaming sessions, power consumption re-
mained approximately at around 1750 mW for Angry
Birds and at around 2000 mW for Droid Invaders. We
will use the average of these two numbers (1875 mW)
as an estimate of the average power consumption of
both 2D and 3D games.
CLOSER2015-5thInternationalConferenceonCloudComputingandServicesScience
582
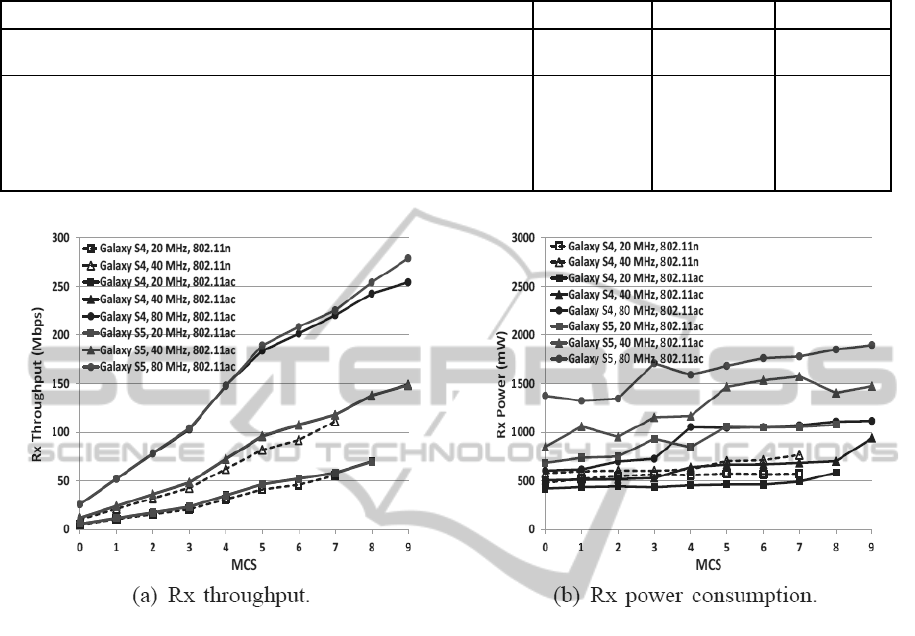
Table 5: Frame Rates for the Adreno 320 GPU on a Google Nexus 4 and on a Samusung Galaxy S4 using the Manhattan
Benchmark (GFXBench, 2015)
Smartphone Model GPU Resolution Frame Rate
Google Nexus 4 (LG E960) Adreno 320 1196 x 768 9.2
Google Nexus 5 Adreno 330 1794 x 1080 10.1
Samsung GT-I9507 Galaxy S4 Adreno 320 1920 x 1080 5.4
Samsung GT-I9515 Galaxy S4 Value Edition Adreno 320 1920 x 1080 5.1
Samsung Galaxy S4 Active (GT-I9295, SGH-I537) Adreno 320 1920 x 1080 5.1
Samsung Galaxy S4 (GT-I9505, GT-I9508, SC-04E, SCH-I545,
SCH-R970, SGH-I337, SGH-M919, SPH-L720) Adreno 320 1920 x 1080 5.1
Figure 2: 802.11ac Throughput and Power Comparison for Galaxy S4 and Galaxy S5 with a Channel Width of 20/40/80 MHz
and FA on. (Saha et al., 2015).
7.2 Power Consumption of Cloud-based
Gaming on Smartphones
To compare power consumption of cloud-based gam-
ing with GPU-based gaming, we first need to evaluate
the NIC bit rate that would be necessary to provide
a gaming experience comparable to the one achieved
through GPU-based gaming. For this, we used results
from the GFXBench 3.0 benchmark, a cross-platform
OpenGL ES 3 benchmark designed for measuring
graphics performance, render quality and power con-
sumption on several types of devices including smart-
phones. In particular, the benchmark has battery
and stability tests that measure the devices battery
life and performance stability by logging frames-per-
second (fps) performance and expected battery run-
ning time while running sustained game-like anima-
tions (GFXBench, 2015). We focused on results for
the Adreno 320 GPU on a Google Nexus 4, which is
the same configuration used in the GPU-based sce-
nario of the previous section.
Table 5 shows the frame rate for several tests using
the Manhattan benchmark (GFXBench, 2015). Row
1 of the table shows that the Adreno 320 GPU on a
Google Nexus 4 achieveda frame rate of 9.2 fps. Con-
sidering this frame rate and the given resolution (1196
x 768), the NIC bit rate that would be necessary to
achieve a similar gaming experience can be derived
as: 9.2 x 1196 x 768 x 24 (bits/pixel) = 202810982.4
bps ≈ 203 Mbps.
We now turn to evaluating the power needed on
the NIC to sustain this bit rate. For this, we use the re-
sults from (Saha et al., 2015) where the authors exper-
iment with a variety of smartphones supportingdiffer-
ent subsets of 802.11n/ac features. In particular, the
authors measured throughput and power consumption
in a Galaxy S4 using different configurations. Based
on their findings for the Galaxy S4 used in the ex-
periment, only 802.11ac offers Rx throughput levels
sufficient for the considered gaming bit rate (of 203
Mbps). Figure 2 (reproduced from (Saha et al., 2015))
shows that the best Rx throughput with 802.11ac was
about 250 Mbps. Power consumption in this case was
about 1100 mW.
TheCaseforVisualizationasaService-MobileCloudGamingasanExample
583
Table 6: Power Consumption (in mW) in Non-
Communicating Modes. (Saha et al., 2015).
Configuration PSM Idle
802.11n, 20 MHz, SS 24 ± 16 398 ± 7
802.11n, 40 MHz, SS 25 ± 5 413 ± 2
802.11ac, 20 MHz, SS 22 ± 9 374 ± 7
802.11ac, 40 MHz, SS 20 ± 9 425 ± 3
802.11ac, 80 MHz, SS 19 ± 10 529 ± 11
The authors did not provide measurements for the
throughput and power consumption in transmit mode
with 802.11ac. They, however, measured through-
put and power consumption in transmit mode with
802.11n. Figure 3 shows their results. In particular,
the results show that that it is possible to achieve a
Tx throughpout of more than 40 Mbps with as little
power as 800 mW. Note that, in a cloud-based gaming
session, a Tx throughout of 40 Mbps is typically suffi-
cient. The authors also measured power consumption
of the Galaxy S4 when it is in non-communication
modes, i.e., power saving mode (PSM) or idle. Their
results (Table 6) show that the highest 802.11ac power
consumption in PSM was 31 mW and that the high-
est 802.11ac power consumption when idle was 540
mW. The relatively high idle mode power consump-
tion of larger channel widths (80 Mhz) has also been
observed by other studies (e. g., (Zeng et al., 2014)).
Figure 3: Comparison of Different CPU Gover-
nors/Frequencies for Galaxy S4 (802.11n) (Saha et al.,
2015).
Based on all the previous results from (Saha et al.,
2015) and assuming that, in a cloud-based gaming
session, the device’s 802.11 adapter spends 80% of
the time receiving, 10% of the time transmitting, and
10% of the time idle, the total power consumed in one
hour by the 802.11 adapter would be:
P
NIC
(t) = P
tx
+ P
rx
+ P
idle
= 0.1 × 800+ 0.8 × 1100+ 0.1× 540
= 1014 milliwatts
Comparing power consumption in the two scenar-
ios: using GPU-based gaming (which is 1875 mW
as derived in Section 7.1 and cloud-based gaming
(which is 1014 mW as derived in this section), we
conclude that, in the considered smartphone configu-
ration, cloud-based gaming can potentially result into
a power saving of about 46%.
8 CONCLUSION
We presented a comparative analysis between two
scenarios of mobile gaming, one that relies entirely
on the GPU of the mobile device and one where the
gaming application runs on the cloud. We analyti-
cally evaluated and compared power consumption in
these two scenarios. Based on our analysis, we ar-
gue that the idea of Visualization-as-a-Service (VaaS)
is a viable computing model that enables the users of
mobile devices with limited power capabilities to still
use long running graphics-intensive applications. In
this model, advanced visualization capabilities would
be provided to users as a service via the Internet.
Two research directions are worth studying: (i) the
impact of protocol (TCP/UDP/IP) overhead and (ii)
the impact of the CPU overhead for processing the
large number of packets typical in cloud gaming. We
believe that considering these two types of overhead
will provide a more accurate assessment of the bene-
fits of cloud-based gaming over GPU-based gaming.
ACKNOWLEDGEMENTS
The first author gratefully acknowledges travel sup-
port from the Institute for Complex Additive Systems
Analysis (ICASA) at New Mexico Tech for presenta-
tion of this paper at the CLOSER’2015 Conference.
REFERENCES
Carroll, A. and Heiser, G. (2010). An analysis of power con-
sumption in a smartphone. In Proceedings of the 2010
USENIX Conference on USENIX Annual Technical
Conference, USENIXATC’10, pages 21–21, Berke-
ley, CA, USA. USENIX Association.
GFXBench (2015). Gfxbench 3.0 directx.
http://www.gfxbench.com.
Halperin, D., Greenstein, B., Sheth, A., and Wetherall,
D. (2010). Demystifying 802.11n Power Consump-
tion. In Proceedings of the International Conference
on Power-Aware Computing and Systems, HotPower,
Vancouver, BC, Canada.
CLOSER2015-5thInternationalConferenceonCloudComputingandServicesScience
584

Hao, S., Li, D., Halfond, W. G. J., and Govindan, R.
(2013). Estimating Mobile Application Energy Con-
sumption using Program Analysis. In Proceedings of
the the International Conference on Software Engi-
neering (ICSE), San Francisco, California.
Hewlett Packard (2013). HP EliteBook Folio 1040 G1
Notebook PC. Technical report.
Hruska, J. (2013). Nvidia’s Tegra 4 Demystified: 28nm, 72-
core GPU, Integrated LTE, and Questionable Power
Consumption. http://www.extremetech.com.
Kim, Y. G., Kim, M., et al. (2015). A Novel GPU Power
Model for Accurate Smartphone Power Breakdown.
ETRI Journal, 37(1).
Lampe, U., Hans, R., and Steinmetz, R. (2013). Will mo-
bile cloud gaming work? findings on latency, energy,
and cost. In Proceedings of the 2013 IEEE Second In-
ternational Conference on Mobile Services, MS ’13,
pages 103–104, Washington, DC, USA. IEEE Com-
puter Society.
Lee, K., Chu, D., Cuervo, E., Kopf, J., Grizan, S., Wol-
man, A., and Flinn, J. (2014). DeLorean: Using Spec-
ulation to Enable Low-Latency Continuous Interac-
tion for Mobile Cloud Gaming. Technical report, Mi-
crosoft Research.
Madden, J. (2011). MIMO Adoption in Mobile Com-
munications Forecast: Devices by Operating System
and User Type, Worldwide, 2010-2017, 1Q13 Update.
Technical report, Mobile Experts.
MarketsandMarkets (2010). World Mobile Applications
Market - Advanced Technologies, Global Forecast
(2010 - 2015). Technical report, MarketsandMarkets.
Milanesi, C., Tay, L., Cozza, R., Atwal, R., Nguyen, T. H.,
Tsai, T., Zimmermann, A., and Lu, C. K. (2013).
Forecast: Devices by Operating System and User
Type, Worldwide, 2010-2017, 1Q13 Update. Tech-
nical report, Gartner.
Netgear (2012). Next Generation Gigabit WiFi - 802.11ac.
Technical report.
Notebook Review (2015). Dell precision m6700
owner’s review. http://forum.notebookreview.com/
dell-latitude-vostro-precision/679326-dell-precision-
m6700-owners-review.html.
NoteBookCheck (2014). Computer games on laptop
graphic cards. http://www.notebookcheck.net/
Computer-Games-on-Laptop-Graphic-
Cards.13849.0.html.
Nvidia (2015a). Building Cloud Gaming Servers. http://
www.nvidia.com/ object/cloud-gaming-benefits.html.
Nvidia (2015b). GeForce GTX 690 Specifications.
http://www.geforce.com/hardware/desktop-gpus/
geforce-gtx-690/specifications.
Nvidia (2015c). Grid GPUs. http://www.nvidia.com/
object/grid-boards.html.
Saha, S. K., Deshpande, P., Inamdar, P. P., Sheshadri, R. K.,
and Koutsonikolas, D. (2015). Power-Throughput
Tradeoffs of 802.11n/ac in Smartphones. In Proc. of
the 34nd IEEE International Conference on Computer
Communications (INFOCOM), Hong Long, Spain.
Shiraz, M., Gani, A., Khokhar, R., and Buyya, R. (2013). A
Review on Distributed Application Processing Frame-
works in Smart Mobile Devices for Mobile Cloud
Computing. IEEE Communications Surveys Tutori-
als, 15.
Soliman, O., Rezgui, A., Soliman, H., and Manea, N.
(2013). Mobile cloud gaming: Issues and challenges.
In Daniel, F., Papadopoulos, G. A., and Thiran, P.,
editors, Mobile Web and Information Systems - 10th
International Conference, MobiWIS 2013, Paphos,
Cyprus, August 26-29, 2013. Proceedings, volume
8093 of Lecture Notes in Computer Science, pages
121–128. Springer.
Thompson, C., Schmidt, D. C., Turner, H. A., and White,
J. (2011). Analyzing Mobile Application Software
Power Consumption via Model-driven Engineering.
In Benavente-Peces, C. and Filipe, J., editors, PECCS,
pages 101–113. SciTePress.
Zeng, Y., Pathak, P. H., and Mohapatra, P. (2014). A
First Look at 802.11ac in Action: Energy Efficiency
and Interference Characterization. In Pros. of the
13th IFIP International Conferences on Networking,
Trondheim, Norway.
TheCaseforVisualizationasaService-MobileCloudGamingasanExample
585
