
A Context-free Smart Grid Model using Pretopologic Structure
Guillaume Gu
´
erard, Soufian Ben Amor and Alain Bui
PRiSM CRNS-UMR 8144, University of Versailles SQ, 45 avenue des Etats-Unis, Versailles, France
Keywords:
Smart Grid, Complex System, Pretopology, Game theory, Multi-agent System.
Abstract:
The Power grid evolves, but its structure presents several gaps with the new numerical technologies, renewable
energies and electric vehicles. The literature introduces the concept of Smart Grid, a system which takes into
account the behaviour and the action of its agents. Studying the smart grid through modelling and simulation
provides us with valuable results which cannot be obtained in the real world due to time and cost related
constraints. Nevertheless, due to the complexity of the smart grid, achieving global optimization is not an easy
task. In this paper, we propose a complex system approach to the smart grid modelling, accentuating on the
representation of the structure. Thanks to this combination, the optimization can be achieved on a dynamic
graph taking into account changes and network errors over time, with the ability to detect them.
1 INTRODUCTION
Our society is electrically dependent. The Power Grid
supplies energy to households, businesses, and indus-
tries. Nevertheless, disturbances and blackouts are
becoming common. With the pressure from ever in-
creasing energy demand and climate change, find-
ing new energy resources and enhancing energy ef-
ficiency have become the priority of many nations in
the 21st century.
The term Smart Grid is coined by Amin in 2005
(Amin and Wollenberg, 2005). Then, the expression
”Smart Grid” has expanded into different dimensions:
some see it as a numerical solution for downstream
counter and mostly residential customers, while oth-
ers have a global vision that transcends the current
structure of the energy market to generate economic,
environmental, and social benefits for everyone. This
article (Gu
´
erard et al., 2012) includes a survey on
Smart Grid models.
Taking into account all its actors, internal and ex-
ternal features, the Smart Grid is defined as a complex
system of subsystems (Gao et al., 2012). Before at-
tacking optimization problems and network structure
in those systems, we must understand the global and
local complexity in each subsystem.
The articles (Gu
´
erard et al., 2012), (Gu
´
erard et al.,
2012) refer to the literature about Smart Grid; the two
articles (Ahat et al., 2013) and (Amor et al., 2014) re-
fer to the complex system approach and the bottom-
up analysis of the Smart Grid; (Gu
´
erard and Tseveen-
dorj, 2014) exposes the mathematical approach of the
Smart Grid; (Amor et al., 2014) presents the game
theory used for the demand-side management.
In this paper, we focus on the dynamic structure
of the Smart Grid. How to create a graph representing
a dynamic structure? How to solve it? How to predict
consumption and to adjust production in the future?
In the following sections, our model will be pre-
sented, especially the use of pretopology to describe
a complex network. This paper is organized as the
following: in the next section, complex system is in-
troduced, theoretical approach in modelling the Smart
Grid as a complex system is discussed. In Section 3,
we present the details of our Smart Grid model. The
Section 4 is devoted to the pretopologic approach and
the feedback system is exposed in Section 5. Then,
how to plan future consumption and production is de-
scribed in Section 6. The section 7 is devoted to first
result and future works.
2 COMPLEX SYSTEM
APPROACH
A system which consists of large populations of con-
nected agents, or collections of interacting elements,
is said to be complex if there exists an emergent
global dynamic resulting from the actions of its parts
rather than being imposed by a central controller.
That is a self-organizing collective behaviour difficult
to anticipate from the knowledge of local behavior
335
Guérard G., Ben Amor S. and Bui A..
A Context-free Smart Grid Model using Pretopologic Structure.
DOI: 10.5220/0005409203350341
In Proceedings of the 4th International Conference on Smart Cities and Green ICT Systems (SMARTGREENS-2015), pages 335-341
ISBN: 978-989-758-105-2
Copyright
c
2015 SCITEPRESS (Science and Technology Publications, Lda.)

(Boccara, 2004).
In (Segel and Cohen, 2001), the authors state that
an autonomous distributed network that process in-
formation adaptively is more effective in describing
the immune system and cellular metabolism. Segel
and Cohens remark can be taken into account by the
majority of complex systems to manage common re-
sources, especially for the Smart Grid.
The contribution of our approach consists of con-
sidering the Smart Grid as a complex system, solving
the problems at local as well as global level with co-
ordinated methods, presented in (Ahat et al., 2013)
and (Amor et al., 2014). The generality of our ap-
proach allows its applicability in various scenarios
and models, that guarantees the flexibility of the ex-
posed model. The following paragraphs summarize
the proposed approach.
At first step, the system should be understood. An
overview brings structural aspects, entities with goals
and behaviours. These one are not randomly dis-
tributed in the system, but according to patterns, and
form distinct groups with their own arrangement.
After analysing the characteristics of the system,
the sub-components are defined. A sub-component
has a structure, objectives and specific entities, al-
though quantities or position in the system is variable.
As a separate system, it has its own dynamics or an
auto-organization. It is then possible to solve it with
an appropriate optimization method. Through all the
sub-component, a global behaviour emerges.
The sub-components are in interaction, then you
should take into account the I-O data for each method.
The stability of the model depends on local optimiza-
tion, and interactions. It is necessary to optimize each
part of the chain as well as a whole to stabilize the
system.
To prevent system crashes, the model must have
a system of communication and feedback to reach
a global consensus. Moreover, the system is sub-
jected to external pressures. Feedback between sub-
components are essential in maintaining the function-
ality of the complex system.
In the Smart Grid, we aim to optimize the energy
distribution, it also includes the management of pro-
duction, consumption and distribution of the common
resource. Our optimization takes into account the re-
silience and reliability of the network and the research
of minimum cost in a market economy (Ahat et al.,
2013).
3 OVERVIEW AND PROCESS
3.1 A Three Layered Grid
The exposed model has three sub-components: the
T&D, the microgrid and the local level, see figure 1.
Figure 1: Smart Grid sub-components (from PowerMatrix,
Siemens).
Network transmission and energy distribution net-
work or T&D is a 2-connected structure containing
electricity generators, central-type agents and grid
agents, represented by the two fields around the center
ring in the figure 1. Its main role is to deliver energy
to consumption points.
The second level is the link between consump-
tion and energy production, represented by the outer
yellow ring. The microgrid is a broader view of lo-
cal consumers, it is a tree structure representing an
ecodistrict bounded by the upstream substation. Its
role is to distribute energy from substation to con-
sumers. For this, it orders or books an amount of en-
ergy from the T&D network to local consumers.
The outer ring is dotted of local levels. Those con-
sumers are connected to a substation itself connected
to the grid energy. This isolated agent, representing
a residence, factory, etc., supports the consumption
of energy, which is the distribution of energy among
appliances under its responsibility. In other words, a
local level is defined by the area under the control of
a smart meter or other automation/management con-
troller.
3.2 Algorithmics
An iteration occurs every five minutes. Once data
are updated, the process is decomposed into four se-
quences, see figure 2. Data are synchronized in order
to let time to compute and to find an equilibrium be-
tween each agent of the system (in simulation or in
real network).
Sequence A. to design the intelligent aspect of the
device, a priority is assigned to the devices, and
SMARTGREENS2015-4thInternationalConferenceonSmartCitiesandGreenICTSystems
336
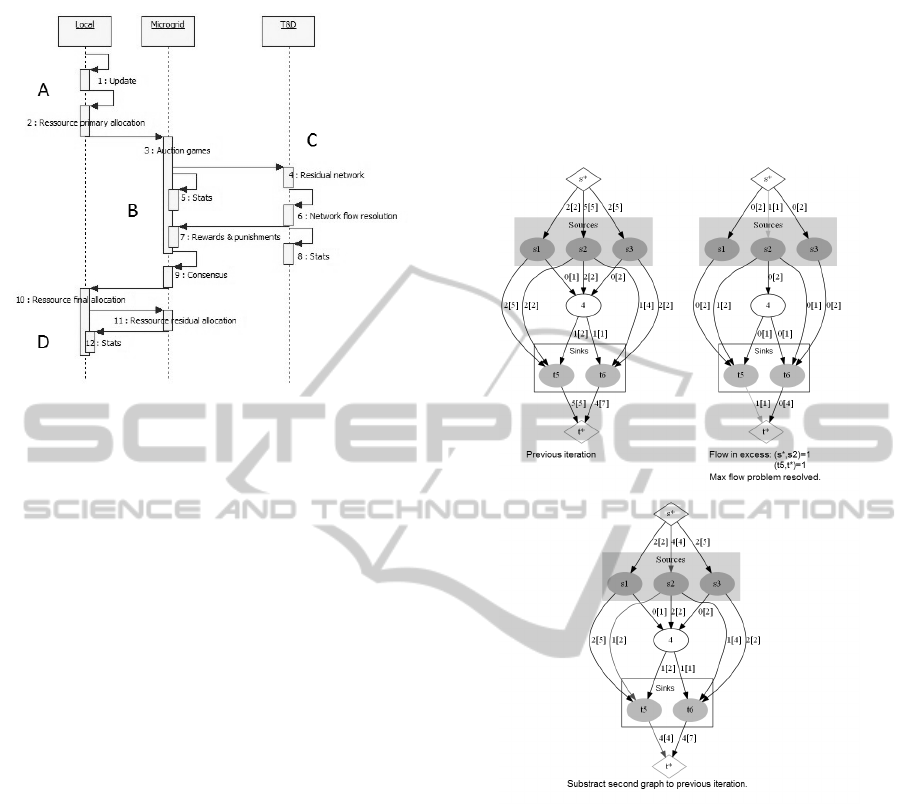
Figure 2: Sequential Scheme.
for calculating a consumption value. Indeed, we
use a local knapsack problem, solved by dynamic
programming after data normalization, in order
to find a primary first optimal resource allocation
(Ahat et al., 2013).
Sequence B. the microgrids book an amount of en-
ergy from producers to consumers using an auc-
tion (Amor et al., 2014). There are two ways
to book energy: a consensus between consumers
and producers, that is a unique game where mi-
crogrids and energy flows are players; and a bid
system with feedback, each microgrid do a local
game with producers. The problem with the first
one is the complexity of the problem, impossible
to resolve in a few times for large instance. The
second way has the advantage of time, but do not
guarantee the global optimum. In this model, the
auctions will be adjusted thanks to the feedback
system.
Sequence C. about the routing problem, nodal rule
or Kirchhoff’s circuit specifies that at any node
in a circuit, the sum of currents flowing into that
node is equal to the sum of the currents flowing
out of that node. An electrical circuit is equal to a
graph in which a junction is a node, and physical
connection corresponds to an edge. Routing prob-
lem is equivalent to the known Max flow problem.
Gale’s theorem shows the existence of a solution
in a network of offers and requests (Gale, 1957).
The Max flow at Min cost problem is solved by
Busacker & Gowen (Section 4.2). To recalcu-
late the entire flow is not necessary. The residual
graph removes overflows between two updates,
optimizing the computation time of the optimal
flow, see figure 3.
Sequence D: energy is distributed by knapsack prob-
lem, according to the last auctions. The un-
consummated energy is redistributed among non-
used devices at upper scale. Each device’s priority
is updated according to the result of the final dis-
tribution.
Figure 3: Updating of routing.
4 HOW TO UPDATE THE T&D
STRUCTURE THANKS TO
PRETOPOLOGY THEORY
4.1 Notion of Proximity
Complex systems manifested complex characteristics
which are not found in simple networks, and thus
called complex networks. The complex network the-
ory has become a major interest area in complex sys-
tem study and provides mathematical tools to model
the structure of complex systems (Newman, 2003).
The pretopology is a mathematical theory ahead
of the conventional axiomatic topology, which allows
us to express the structural transformations of sets
AContext-freeSmartGridModelusingPretopologicStructure
337

of interacting elements such as building coalitions
among a population phenomenon alliance process of
tolerance, acceptance and the emergence of collective
behaviour. Pseudo-closure and closure are two func-
tions used to model basic operations in complex net-
work theory (Belmandt, 2011). The topology is a par-
ticular case of the pretopology.
The complex networks such as the Smart Grid
change at each time. It is therefore important to model
these functions by taking into account the dynamics.
A complex network is seen as a family of pretopology
on a given set as shown in the figure 4. The advantage
of this theory is the separation of each criterion in a
pretopologic space to simplify modelling. The over-
all adhesion function is defined as an aggregation of
several spaces. In this manner, a modification in a
space is instantaneous. The pretopologic spaces may
include various types of relationships, such as metric
spaces, binary spaces or valued spaces.
Figure 4: A family of pretopology.
The Smart Grid is a complex system, it is gov-
erned by a number of qualitative and quantitative cri-
teria. The voltage of the power lines is an example,
but it is also possible to take into account the electri-
cal leakage based on the length of lines, installations
wear, weather, etc.
Finally, pretopology is a very useful modelling
tool in the context of complex systems to manage ac-
quaintances between agents and be able to follow the
dynamics of relationships between them (Petermann
et al., 2012).
4.2 Routing Problem
In order to define undercharged, or overcharged lines
during the sequence C, a pretopologic analysis is con-
ducted. For example, let be three pretopologic spaces
a
1
, a
2
and a
3
. Each edge has three levels of flow cor-
responding to under-load, normal load and overload.
The figure 5 presents the pretopologic family.
Under-load is possible on an edge if it exists in the fol-
lowing logical space a
1
∩ a
2
∩ a
3
named [1], same for
overload in the logical space (a
1
∪ a
2
)∩ a
3
named [3].
By default, any edge carries an average load named
[2]. The figure 6 presents the final graph.
Figure 5: Pretopologic spaces.
Figure 6: Network according to pretopologic spaces.
The constructed network is a fully connected
graph which edge’s capacity depends on pretopologic
spaces. Each edge (i, j) is characterized by:
• d
i j
the maximum capacity;
• l
i j
the minimum capacity;
SMARTGREENS2015-4thInternationalConferenceonSmartCitiesandGreenICTSystems
338

• c
i j
the unit cost of the flow in the edge. The cost
may vary in function of the total flow. Edge is
duplicate with different costs related to capacity.
For example, the initial cost is 1 for a flow among
[0, 3], 3 among [3, 6], and 5 among [6, 8]. Three
edges rely i to j. Because the cost function is
stricter increasing, this method does not perturb
the algorithm of maximum flow at minimum cost
only if. A path with an available capacity is called
an augmenting path. At each iteration, the edge
(i, j) is valued at c
i j
if the edge (i, j) is not satu-
rated. The edge ( j, i) is valued at −c
i j
if the edge
(i, j) is not empty;
• x
i j
the flow passing through the edge.
In order to resolve this routing problem, the Bu-
sacker & Gowen algorithm is used, an example is
shown in the figure 7. The idea behind the algorithm
is: as long as there is a path from the source (the start
node) to the sink (the end node), with an available ca-
pacity on all edges in the path, we send flow along
one of these paths, filling in priority the path with the
minimal cost. Then we find another path, and so on.
Figure 7: Busacker & Gowen algorithm.
5 FEEDBACKS
Various criteria and technical constraints limit the
amount of energy that circulate in each edge. Produc-
tion and consumption must match as best as possible.
The energy produced or the energy consumed (se-
quence B and C) may be different. This is a mis-
management of resources for the consumers, or mis-
management of the energy produced. The difference
between the total energy and the total consumed en-
ergy (equal to Max flow) can be significant. A recog-
nition algorithm must locate bottlenecks to perform
feedback between T&D network and each microgrid.
For these, two tests are used:
• The Max flow problem on the graph without ca-
pacity constraints on the edges containing the
sink. The result will provide the maximum un-
constrained consumption.
• The Max flow problem on the graph without ca-
pacity constraints on the edges containing the
source. The result will reflect consumer demand
in order to predict future production.
Management on the consumer side, called De-
mand Side Load Management (DSM), aims to in-
crease the efficiency of generating by shifting con-
sumption in low consumption period (Saad et al.,
2012). Many devices can temporarily go into a
standby mode (heating) or consumption can be post-
poned. Some devices are also able to stop using en-
ergy during operation (preemption). Approximately
50% of the consumption of residential areas can be
controlled without reducing the comfort (Block et al.,
2008).
To increase the effectiveness of the DSM, it is
assumed that the front part of the infrastructure is
a home automation and every device can be con-
trolled separately by the user and regulation algo-
rithms. Feedback of the sequence C on sequence B,
with rewards or punishments, determines how smart
meter will control automation in order to find a better
auction.
The gap between the constrained solution and the
two tests determined how to perform the feedback.
If a microgrid can consume more than its bid, it in-
creases the bid during the next auction. The values
obtained by the graphs are used in the feedback to
punish or reward and adjust the new bids. The figure
8 shows the bid and the received energy in a microgrid
at each feedback (in this case, the curves are voluntar-
ily exaggerated to see the gap between each one).
Feedback reorganizes the distribution of resources
among the different microgrids. After a limited num-
ber of feedbacks, supply and demand find a consensus
throughout the graph as shown in figure 8.
Figure 8: Equilibrium thanks to feedback in a microgrid.
The feedback seems trivial, but if we consider
thousands of production and consumption places,
then the problem of maximal flow has multiple valid
patterns. Added to a global policy, these attempt to
understand production and consumption behaviours
in order to build valid patterns for future iterations.
AContext-freeSmartGridModelusingPretopologicStructure
339

6 GLOBAL DIRECTION
6.1 For the Following Iterations
When searching for the shortfall in production or con-
sumption during the sequence C, the ideal distribution
of production without consumption constraint and the
ideal distribution of consumption without production
are calculated (see previous section). These data al-
low us to understand the evolution of consumption
over time. Prognostics are calculated at the end of
the sequence D as follows:
1. For consumers: consumption of future consump-
tion is the weighted average of the auction con-
ducted. Let z
i
be the bid made at the feedback
i − 1, the consumption used by prognostic is cal-
culated as follows: Z = 2
n
∑
i=1
i∗z
i
n(n−1)
. The latest bids
have a greater impact on the prognostic.
2. For producers: prognostics are calculated like the
previous one. The plants do not have the same
ability to adjust production, and need a consensus
among themselves. Currently the model is only
supporting a single producer (with many plants).
Thus, the calculation of upcoming productions
does not consider the competition. We actually
work to how to plan the production with many
producers.
6.2 For Further Iterations
At long term, we must equalize the production curve
of the Smart Grid. Local agents do not have an
overview of the consumption (or production) curve.
In order to smooth the curve, an algorithm, based on
a mathematical function, guarantees the quality of the
solution, or, give advice for feedback.
Bounded function cannot cross some threshold. In
the case of consumption, that means the curve cannot
pass under or over a fixed value. In a perfect Smart
Grid, a bounded function guarantees a continuous
consumption. But, in a real network, the consump-
tion during night or day, or the sector (primary, sec-
ondary, tertiary), or the external factors, or the scale
of the grid, may radically vary. To avoid incoherent
behaviours due to inappropriate management policy,
a function bounded on its slope must be used.
Lipschitz continuity, named after Rudolf Lips-
chitz, is a strong form of uniform continuity for func-
tions. Intuitively, a Lipschitz continuous function is
limited in how fast it can change: there exists a defi-
nite real number such that, for every pair of points on
the graph of this function, the absolute value of the
slope of the line connecting them is not greater than
this real number (see figure 9). If the consumption
curve is k-Lipschitz, we guarantee that the curve can-
not have a peak demand (depends on the value of k).
Before each feedback between sequence B and C,
we check if the result is Lipschitz continuous. If it is
not, the auctions are adjusted. If it is continuous, and
the solution is eligible, then the sequence D starts.
Figure 9: A Lipschitz function.
7 FUTURE WORKS
To validate the model, instances at local and global
scale have been made. Agents data, like engine
consumption or energy plants production, are imple-
mented thanks to the french national production com-
panies public data and energy distribution data (EDF
and RTE).
In the first tests, consumption and production tend
towards equilibrium. Local and renewable energies
are privileged to maximize their profitability. The
model limits the losses of the distance of consump-
tion, and uses the least amount of fossil energy. It
works at any scale and any agents under the condition
that there exists a feasible solution.
The proposed model works for randomized or
parametric Smart Grids. We actually work in the Posi-
tive Energy 2.0 project led by ALSTOM Energy Man-
agement and various companies such as Bouygues or
Renault to validate the model on real projects.
The model will be compared to, electronic, auto-
matic models and simulations. Positive Energy 2.0
project provides two microgrids (one using electronic
networks and one using automatic devices), Embix
provides data from several buildings and plants, and
some microgrid simulations.
The analysis of the first results with public data,
the project’s results with private data and the eco-
nomic study will form a forthcoming publication.
The model can be improved. The learning pro-
cess must be developed in order to optimize the auc-
tion and the choice for utility functions. Moreover,
artificial intelligence will be implemented in order to
adjust each parameter in real time. The Smart Grid
change over time, so the AI must find the best con-
figuration in real time in order to keep the Smart Grid
optimized and to avoid local dysfunctions.
SMARTGREENS2015-4thInternationalConferenceonSmartCitiesandGreenICTSystems
340

8 CONCLUSION
As Smart Grid can be qualified as a complex system,
classical optimization methods cannot be applied di-
rectly, due to the computational complexity for time
and memory.
Integrating pretopology offers a better notion of
proximity between the agents. This allows handling
multiple criteria simultaneously using an aggregation.
In addition, the modification of a single criterion en-
tails that the update of the pretopology assigned and
not a total restructuring of the network.
More generally, we also demonstrated how to
solve optimization problems in complex systems.
While applying for optimization algorithms directly
in complex systems is nearly impossible, we should
analyse the system and divide them into sub-systems
with defined characteristics, then we should apply for
specific algorithms and coordinate them using multi-
agent simulation in order to achieve global optimiza-
tion on a defined and dynamic network.
REFERENCES
Ahat, M., Amor, S. B., Bui, M., Bui, A., Gu
´
erard, G., and
Petermann, C. (2013). Smart grid and optimization.
American Journal of Operations Research, 3:196–
206.
Amin, S. M. and Wollenberg, B. F. (2005). Toward a smart
grid: power delivery for the 21st century. Power and
Energy Magazine, IEEE, 3(5):34–41.
Amor, S. B., Bui, A., and Guerard, G. (2014). A context-
free smart grid model using complex system ap-
proach. In Distributed Simulation and Real Time Ap-
plications (DS-RT), 2014 IEEE/ACM 18th Interna-
tional Symposium on, pages 147–154. IEEE.
Belmandt, Z. (2011). Basics of pretopology. Hermann
´
editeur.
Block, C., Neumann, D., and Weinhardt, C. (2008). A
market mechanism for energy allocation in micro-chp
grids. In Hawaii International Conference on System
Sciences, Proceedings of the 41st Annual, pages 172–
172. IEEE.
Boccara, N. (2004). Modeling complex systems. Springer
Verlag.
Gale, D. (1957). A theorem on flows in networks. Pacific
Journal of Mathematics, 7(2):1073–1082.
Gao, J., Xiao, Y., Liu, J., Liang, W., and Chen, C.
(2012). A survey of communication/networking in
smart grids. Future Generation Computer Systems,
28(2):391–404.
Gu
´
erard, G., Amor, S., and Bui, A. (2012). Survey on
smart grid modelling. International Journal of Sys-
tems, Control and Communications, 4(4):262–279.
Gu
´
erard, G., Ben Amor, S., and Bui, A. (2012). A complex
system approach for smart grid analysis and model-
ing. International Journal of Knowledge-Based and
Intelligent Engineering Systems, 243:788–797.
Gu
´
erard, G. and Tseveendorj, I. (2014). Largest inscribed
ball and minimal enclosing box for convex maxi-
mization problems. In XII GLOBAL OPTIMIZATION
WORKSHOP, pages 61–64.
Newman, M. E. (2003). The structure and function of com-
plex networks. SIAM review, 45(2):167–256.
Petermann, C., Amor, S. B., and Bui, A. (2012). A pre-
topological multi-agents based model for an efficient
and reliable smart grid simulation. In International
Conference on Artificial Intelligence (ICAI).
Saad, W., Han, Z., Poor, H. V., and Basar, T. (2012). Game-
theoretic methods for the smart grid: An overview
of microgrid systems, demand-side management, and
smart grid communications. Signal Processing Mag-
azine, IEEE, 29(5):86–105.
Segel, L. and Cohen, I. (2001). Design principles for the
immune system and other distributed autonomous sys-
tems. Oxford University Press, USA.
AContext-freeSmartGridModelusingPretopologicStructure
341
