
A Concept for the Exploratory Visualization of
Patent Network Dynamics
Florian Windhager
1
, Albert Amor-Amorós
2
, Michael Smuc
1
, Paolo Federico
2
, Lukas Zenk
1
and
Silvia Miksch
2
1
Department for Knowledge and Communication Management, Danube University Krems,
Dr.-Karl-Dorrek-Str 30, 3500 Krems, Austria
2
Institute of Software Technology and Interactive Systems, Vienna University of Technology,
Favoritenstraße 9-11, 1040 Vienna, Austria
Keywords: Information Visualization, Visual Analytics, Patent Data, Emergent Technologies, Dynamic Networks.
Abstract: Patents, archived as large collections of semi-structured text documents, contain valuable information about
historical trends and current states of R&D fields, as well as performances of single inventors and
companies. Specific methods are needed to unlock this information and enable its insightful analysis by
investors, executives, funding agencies, and policy makers. In this position paper, we propose an approach
based on modelling patent repositories as multivariate temporal networks, and examining them by the
means of specific visual analytics methods. We illustrate the potential of our approach by discussing two
use-cases: the determination of emerging research fields in general and within companies, as well as the
identification of inventors characterized by different temporal paths of productivity.
1 INTRODUCTION
Together with scientific papers, patents rank among
the most common and widely used information
carriers to document newly developed knowledge
and technical procedures. While a patent’s legal
function is the temporal appropriation and protection
of its content against exploitation and infringement
by other parties, patent databases are a valuable
resource that can be exploited for collective learning
purposes, to answer the information need of various
interest groups throughout different domains. This
corresponds to the twofold function of exclusion and
diffusion (Ordover, 1991). With this position paper,
we want to contribute to the collective learning and
diffusion side from a point of view, where the field
of patinformatics (Trippe, 2003) becomes
augmented by the methods and technologies of
Visual Analytics (Koch, Bosch, Giereth, & Ertl,
2009).
Our approach is guided by the research question
of “How can Visual Analytics methods support
patent data analysts in gaining insight according to
their specific analytical tasks?” and faces the three
main challenges of time, scale, and relational
structure. Our position is that a conceptual
framework built on multivariate temporal networks
would enable the adoption of existing visual and
analytical methods and thus bring along new
possibilities to gain insights into the dynamic
behavior of individual actors, companies, as well as
whole research and technology fields.
In the following we elaborate on how to
conceptually organize different user groups and
some of their common tasks (Sec. 2), introduce the
design rationale of our approach (Sec. 3), discuss
two different Visual Analytics use cases of patent
data exploration (Sec. 4), and conclude with an
outlook on research challenges and future work
(Sec. 5).
2 USERS, DATA AND TASKS
In the following, the domain will be characterized in
terms of its data, users and their tasks, in order to
generate a set of requirements and to proceed with a
user-centric perspective in designing Visual
Analytics methods for time-oriented data (Miksch
and Aigner, 2014).
When it comes to the current state and future
development of different science and technology
268
Windhager F., Amor-Amorós A., Smuc M., Federico P., Zenk L. and Miksch S..
A Concept for the Exploratory Visualization of Patent Network Dynamics.
DOI: 10.5220/0005360002680273
In Proceedings of the 6th International Conference on Information Visualization Theory and Applications (IVAPP-2015), pages 268-273
ISBN: 978-989-758-088-8
Copyright
c
2015 SCITEPRESS (Science and Technology Publications, Lda.)
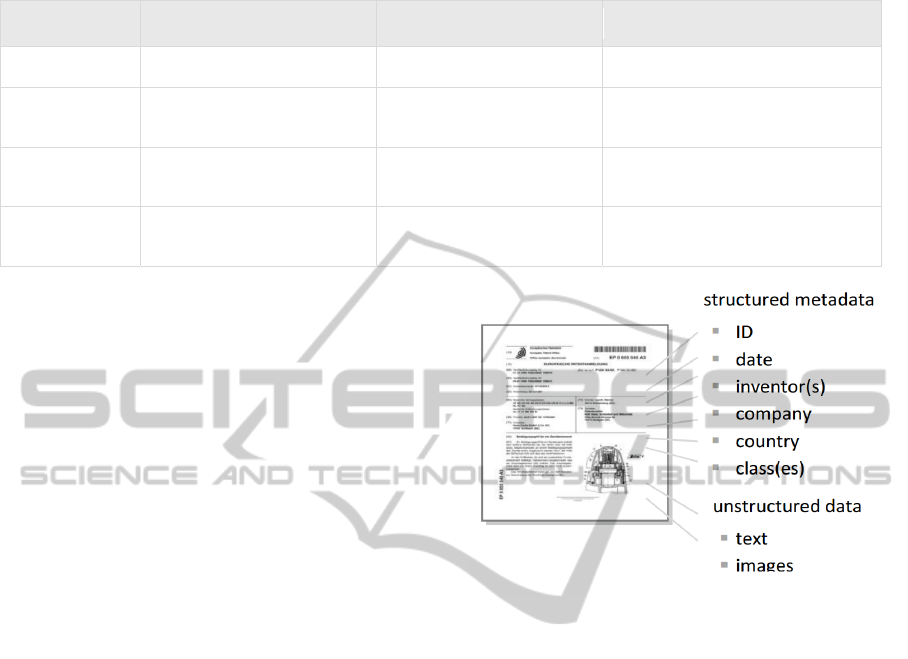
Table 1: Common user groups of patent information and selected analytical tasks.
user groups researchers & inventors managers & investors policy makers & funding agencies
main focus R&D classes companies countries
exemplary
tasks
monitoring trends
within R&D classes
monitoring one’s own or
competitors performance
monitoring a countries
R&D performance
macro level
monitoring of all or selected
R&D classes >> see sec. 4.1
monitoring R&D trends
within selected companies
monitoring or evaluating the R&D
of countries or regions
micro level
monitoring inventors’
performance
identifying key actors within
companies >> see sec. 4.2
identifying leading
companies or inventors
fields, there is a variety of user groups in
knowledge-based societies, who are in constant need
of up-to-date analysis according to their specific
tasks and goals. Amongst others we highlight (1)
researchers and inventors, (2) investors and
managers of companies, as well as (3) policy makers
and funding agencies. Each of these groups have to
deal with questions ranging from the macro to the
micro levels of research and development (R&D)
performance on a regular basis. While there are
various ways to tackle these issues (e.g., experts’
assessments, surveys, and evaluations) patents
provide a rich source of evolving information to be
taken into closer consideration (Jaffe and
Traitenberg, 2002).
Patent data usually consists of large collections
of semi-structured documents (see Fig. 1): while an
unstructured body of text and images details the
invention or procedure for which the document is
claiming protection, a standardized part of the
document is carrying metadata, which is required to
administer such documents. When handling patent
collections with millions of documents, these
categories of metadata ease and guide the
examination of the technological state of the art via
patent information databases. These databases
commonly offer public interfaces for textual queries,
but could be used for advanced studies and visual
exploration too (Markellos et al., 2002; Yoon and
Park, 2004; Bonino, Ciaramella and Corno, 2010).
With regard to specific user groups, various
patinformatics methods could be applied to answer
their specific questions or tasks (Trippe, 2003). To
organize these various points of view and interest,
Table 1 provides an overview of common tasks,
organized by their assignment to user groups
(columns) and their main focus of investigation with
tasks on the respective macro or micro level of
analysis (rows), i.e. from fields and firms down to
specific groups and individuals. While researchers
Figure 1: The structure of patent data.
and inventors are used to focus on R&D areas or
technology classes in the large (first column),
managers and inventors are bound to focus on
companies and corporate actors, whether they are
their own, their competitors’, or the ones who they
want to invest in (second column). In contrast,
policy makers and funding agencies think of
regional or national aspects as relevant (third
column). Aside from gaining overviews on key
structures and actors, we consider the detailed
investigation into temporal aspects, like emerging
technologies and companies’ or inventors’
performances as the most interesting aspects for the
visual analysis of patent data.
3 PATENT DATA AS DYNAMIC
NETWORKS
According to the core of our position, dynamic
networks constitute an expressive abstraction for
representing and manipulating patent data, due to the
fact that domain-specific relational entities, such as
citations, collaborations, or knowledge flows, can be
explicitly represented and manipulated.
AConceptfortheExploratoryVisualizationofPatentNetworkDynamics
269
3.1 Data Model
The property graph model is one of the most flexible
and widespread graph-based data models for
representing multivariate networks (Rodriguez and
Neubauer, 2012). A property graph is a graph
structure in which elements (nodes and edges) have
types as well as attributes, edges are directed, and
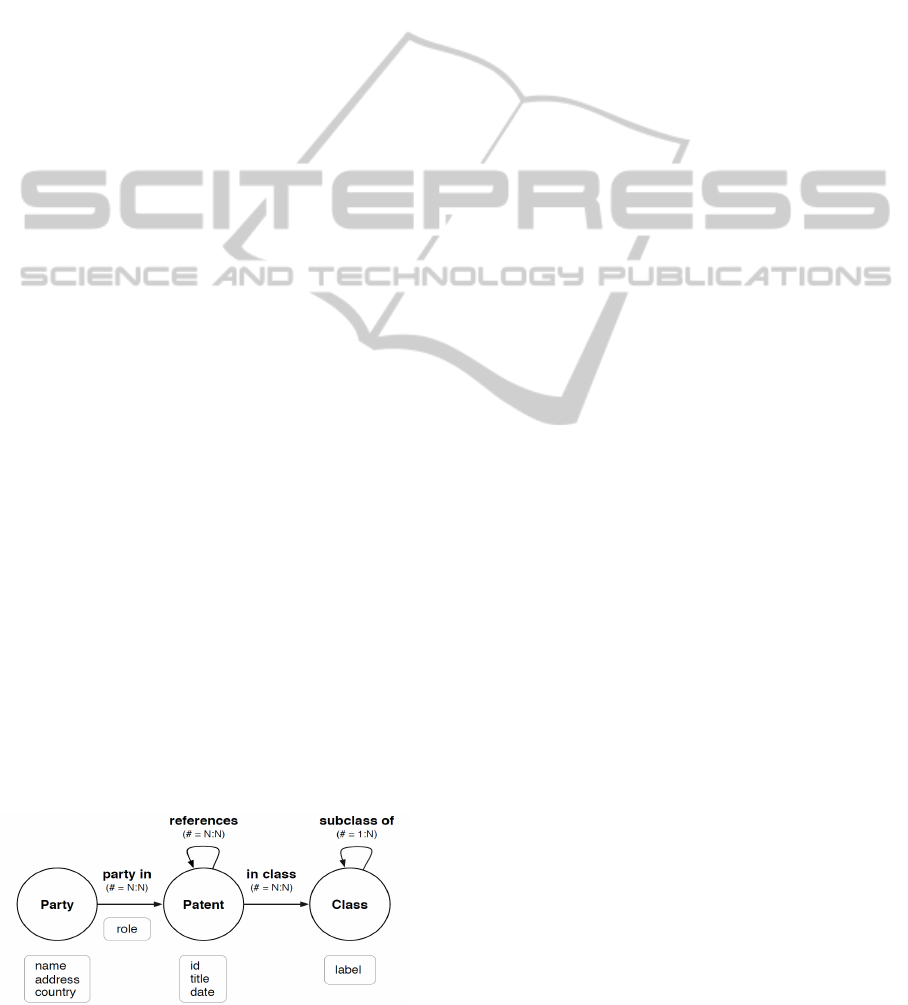
parallel edges between nodes can exist. Patent data
can be easily casted into a property graph model by
introducing three main node types: i) patent
documents, as central entities containing specific
metadata and pointers to other related entities, ii)
parties, such as persons or organizations that have
been involved in the development of a particular
patent with any possible role (i.e., inventors,
applicants, assignees, or examiners), and iii)
knowledge classes, organized according to a
hierarchical structure defined by one of the many
classification systems that exist. Correspondingly,
different relationship types also exist between the
aforementioned entities, and can be explicitly
introduced in the model: patent to patent
(references), party to patent (party in), patent to
knowledge class (classified in), and knowledge class
to knowledge class (subclass of) (Fig. 2).
Time (date) is a data dimension with many
special features that require special models and
Visual Analytics methods. In order to appropriately
address temporal aspects of networks we adopt the
TimeGraph data-management framework (Amor-
Amorós, Federico, and Miksch, 2014). TimeGraph
uses the network structure to explicitly represent the
structure of temporal attributes associated to the data
items in terms of temporal primitives, such as
instants or intervals, and the hierarchy of the time
domain towards these temporal attributes map (i.e.
the calendar structure). Additionally, it extends the
graph traversal language with specific operators that
enable writing expressive temporal selection and
aggregation statements.
Once a patent repository has been modeled as a
dynamic network, it can be examined by applying an
appropriate sequence of data transformation,
analysis and visualization steps.
Figure 2: A patent repository modeled as a property graph.
3.2 Data Reduction
Networks representing patent repositories usually
contain hundreds of millions of elements. In such a
context, data reduction becomes a key prerequisite
for performing exploratory analytical tasks. The data
reduction process can be formalized as an iterative
sequence of steps that involves two types of actions:
selection and aggregation (Jankun-Kelly et al.,
2014).
Selection specifies a set of objects of interest out
of an input set, according to specific constraints or
characteristics. A further distinction can be made,
according to which of the graph aspects (i.e.,
topology or attributes) are involved: traversal steps
involve the connections between the elements of the
graph, propagating the selection focus through the
structure, while filtering steps specify a subset of
elements of interest out of a reference set, according
to its attributes. In general, any complex selection
step can be decomposed into a sequence of filtering
and traversal steps.
Aggregation reduces the amount of data by
introducing representative entities for specific
groups of data items. Accordingly, two stages can be
identified in an aggregation step: an optional
grouping stage, in which the items to be aggregated
are separated into groups according to a specific
rule, and a reduction stage, in which a representative
is computed for each one of the groups. Aggregation
in graphs can involve both attributes and topological
characteristics of elements in each of the two stages.
An interesting special case is projection, in which
specific paths are replaced by simple edges.
3.3 Analysis
Trend analysis constitutes one of the most common
tasks to perform on patent data (Bonino, Ciaramella
and Corno, 2010). The structural dynamics of a
network can be traced by computing a graph theory
metric on specific elements in each of the network
snapshots, and then analyzing the temporal evolution
of such metric; an exemplary result of this kind of
analysis is a time series representing the evolution of
the centrality of an inventor in the context of the
collaboration network specific to her/his company
(see section 4.2). This kind of information can
usually be further compressed by means of a
temporal abstraction computed on the time series,
i.e., "rising" instead of an increasingly growing
value. An alternative means for temporal analysis of
networks involves using the so-called temporal
network measures (Holme and Saramäki, 2012),
IVAPP2015-InternationalConferenceonInformationVisualizationTheoryandApplications
270
which extend the concepts of static graph theory
with additional time-aware definitions (e.g.,
temporal paths). As a simple example, consider the
sequence of time intervals between subsequent
collaborations (i.e. links) between two inventors.
3.4 Visualization
Many visualization techniques are available for
relational and hierarchical data. Trees, treemaps, and
sunburst diagrams enable the visualization of the
hierarchical structure of the patent classification
(Schulz, 2011). Citation or collaboration networks
can be visualized by matrix-based techniques as well
as by node-link diagrams with different types of
layouts (Beck et al., 2014). Network dynamics can
be visualized by mapping sequenced static diagrams
into a timeline, resulting in juxtaposition,
superimposition, and 2.5-dimensional views
(Federico at al., 2011; Gleicher et al., 2011). These
views can be enriched by encoding temporal
abstractions of dynamic graph metrics into a visual
variable such as color.
4 USE CASES
In the following, two use cases – which have been
assembled from five expert interviews – will
illustrate possible applications of the described
approach to common questions, which actors in
various R&D contexts are frequently facing.
4.1 Rising and Falling Technologies
User groups like researchers and inventors are called
upon to constantly observe their central and
peripheral activity fields for recent developments
and future trends. With the resulting task rephrased
as “What are recent developments in a specific field
of interest?”, any supporting method has to delineate
relevant technology fields first, to visualize
emerging, increasing, stagnating, or decreasing
activities on that basis.
Due to the mandatory assignment of every patent
document to the specific classes of fine-grained
patent classifications (e.g., International Patent
Classification (IPC), Cooperative Patent
Classification (CPC), etc.), these hierarchical multi-
level systems could be used to deliver a background
map for any selected area, against which the activity
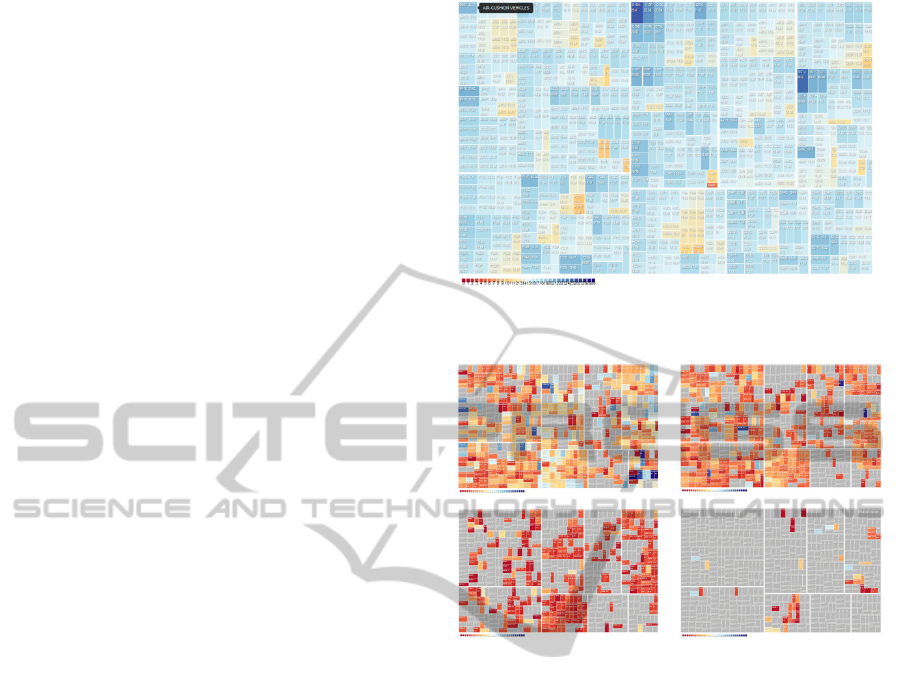
of focus classes could be visualized. After selecting
treemaps for further investigation, we implemented a
“global technology activity map” (see Figure 3)
Figure 3: Treemap visualization of all R&D classes,
colored by average age of patents.
Figure 4: R&D “footprints” of SIEMENS (upper left),
BOSCH (upper right), SAMSUNG (bottom left) and
APPLE (bottom right).
distinguishing the top levels of the IPC, detailing
three levels of hierarchy from 8 sections to 130
classes and 600 subclasses. These could be weighted
(e.g. for patents per class) and colored according to
data on temporal aspects (e.g., average age of
patents per class). Against this background, the
patent portfolios and activities of selected companies
can be highlighted. This allows to visually analyze
and compare the “innovation footprints” of different
corporate actors (see Fig. 4), where recent activity
areas again are highlighted in red, while older
innovation areas are shaded in blue.
While the overall constellation of colored cells
allows to compare the “intellectual property shapes”
of corporate actors (e.g., all-round corporations
versus specialized niche players), temporal measures
(like average age of patents) can help to identify
recent strategic investments of relevant companies
and competitors.
With regard to the user group of R&D managers
and investors, we consider the advancement of
methods to explore the dynamics of any competitors
AConceptfortheExploratoryVisualizationofPatentNetworkDynamics
271
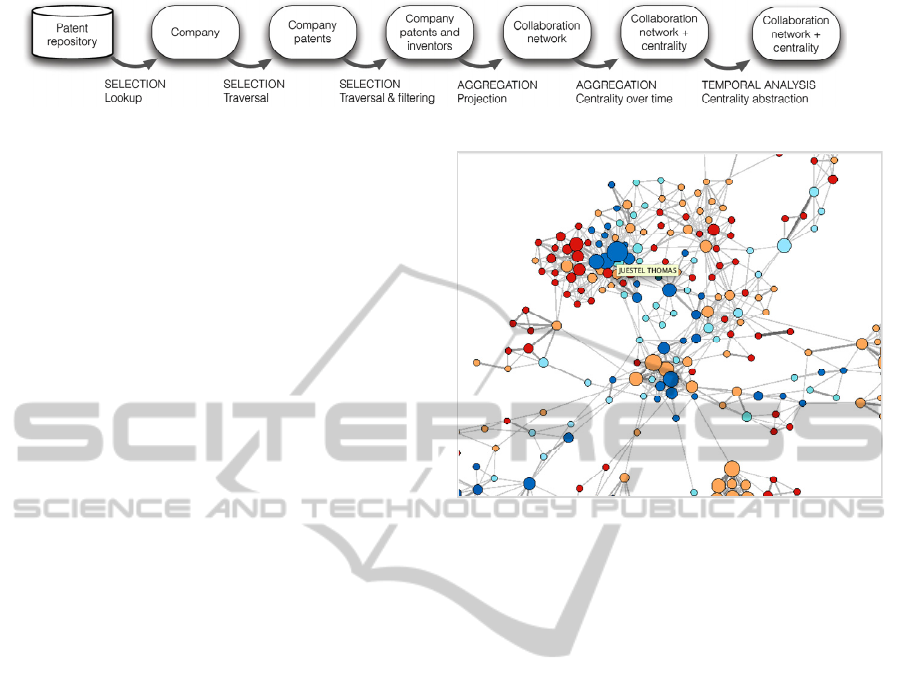
Figure 5: Data transformation process for identifying rising inventors.
strategic investments as highly relevant.
Accompanying and deepening existing domain
knowledge about distributions and trends, the
outlined Visual Analytics approach can help to
support the decisions of such user groups on a real-
time basis.
Aside from identifying increasing or decreasing
R&D efforts on a global, multi- or single company
level, patent data allows to dive even further into the
activities of selected corporate actors, making the
work of single individuals visible.
4.2 Rising and Falling Inventors
In this second scenario, we demonstrate how
managers, investors, or human resource managers
can be supported in order to identify and defend key
players within their own company, or pick out rising
or falling inventors in other firms, to reassemble
them in new ventures or merge them with existing
teams. The question driving the task at hand is
“What are the inventors with increasing or
decreasing (temporal) productivity patterns inside a
specific company?”.
Figure 5 shows the specific form of the data
transformation sequence, introduced in section 3: A
company is selected as the initial entity, then the
repository is traversed to find all patents that have
the given company as assignee and all their
inventors; then the patents-inventors 2-mode
network is projected into a co-author network. This
allows not only for the investigation into individual
productivity and position within a company’s
innovation network, but also to assess the
productivity of group structures and team
environments. The resulting co-author network is
temporally partitioned and the centrality of inventors
is computed for each time-slice; then it is temporally
abstracted. In particular, with regard to two time
periods, four sorts of dynamics could be
distinguished: increasing (+/+), decreasing-
increasing (–/+), increasing-decreasing (+/–), and
decreasing (–/–).
Figure 6 shows these temporal abstractions by
the colors of red (+/+), orange (–/+), light blue (+/–)
and dark blue (–/–). In addition, the nodes’ sizes
show the total amount of patents each inventor
contributed to.
Figure 6: Co-publication network of inventors, with active
individuals in red, and inactive ones in blue.
Resulting insights can contribute to support the
human resource management within a company, as
well as to search for actors with specific skills – and
a specific pattern of temporal productivity (or
structural embeddedness) across all other companies
in the database. As such, this approach helps to
identify “rising stars” and up-and-coming R&D
departments, as well as “abandoned” inventors or
teams, who might be interested to support
innovation and development in a novel context.
5 OUTLOOK & FUTURE WORK
In this article, we presented a conceptual framework
to provide users with Visual Analytics methods to
interactively explore the dynamics of patent
databases. As illustrated by two use cases, such an
approach helps to provide a wide range of actors in
the research and development context with up-to-
date information, needed to support their decision
processes. As opposed to existing approaches, we
use a network abstraction to model the data, which
provides specific benefits when it comes to the
visual exploration of relational structures and
dynamics at both: the macro and the micro level of
individual inventor’s performance.
While we consider the development of methods
for the interactive exploration of complex datasets to
IVAPP2015-InternationalConferenceonInformationVisualizationTheoryandApplications
272

provide a significant challenge for future work,
another challenge derives from the time-oriented
nature of patent data. Whether analysts are
investigating the dynamics of technology fields,
countries, companies, or individual publication
performances, the need to identify past, present, and
possible future trends is ranging high. As such, we
will dedicate future work to the elaboration and
refinement of time-oriented analysis methods, which
have to support the quick identification,
amplification, and comparison of trends, as well as
the detailed exploration and investigation of
behavioral patterns and flows. To allow for
transitions between different levels, focal points and
analytical tasks, we consider the development of
consistent navigation methods as a requirement,
which will be supported by feedback of user tests
and evaluations. As such, the connection of the
outlined network approach to various application
scenarios of patent data user groups will be ensured.
ACKNOWLEDGEMENTS
This research was funded by the Austrian Research
Promotion Agency (FFG) under the Project Number
835937 and builds on methods (specifically the use
case of section 4.2) developed by its company
research partner FASresearch (www.fas-research.
com).
REFERENCES
Amor-Amorós, A. Federico, P., & Miksch, S. (2014).
TimeGraph. A Data Management Framework for
Visual Analytics of Large Multivariate Time-Oriented
Networks. In Poster Proceedings of the IEEE
Visualization Conference (VIS).
Beck, F., Burch, M., Diehl, S., & Weiskopf, D. (2014).
The State of the Art in Visualizing Dynamic Graphs.
In EuroVis STARs. (pp. 83-103).
Bonino, D., Ciaramella, A., & Corno, F. (2010). Review
of the state-of-the-art in patent information and
forthcoming evolutions in intelligent patent
informatics. World Patent Information, 32(1), 30–38.
Federico, P., Aigner, W., Miksch, S., Windhager, F., and
Smuc, M. (2012). Vertigo zoom: combining relational
and temporal perspectives on dynamic networks. In
Proceedings of the International Working Conference
on Advanced Visual Interfaces (AVI '12). (pp. 437-
440).
Gleicher, M., Albers, D., Walker, R., Jusufi, I., Hansen, C.
D., and Roberts, J. C. (2011). Visual Comparison for
Information Visualization, Information Visualization,
10(4), 289-309.
Holme, P. & Saramäki, J. (2012). Temporal networks.
Physics Reports, 519(3), 97–125.
Jaffe, A. B. & Trajtenberg, M. (2002). Patents, Citations,
and Innovations: A Window on the Knowledge
Economy. Cambridge, MA: MIT Press.
Jankun-Kelly, T. J., Dwyer, T., Holten, D., Hurter, C.,
Nöllenburg, M., Weaver, C., & Xu, K. (2014).
Scalability Considerations for Multivariate Graph
Visualization. In Multivariate Network Visualization.
LNCS 8380 (pp. 207–235), Berlin: Springer.
Koch, S., Bosch, H., Giereth, M., & Ertl, T. (2011).
Iterative Integration of Visual Insights during Scalable
Patent Search and Analysis. IEEE Transactions on
Visualization and Computer Graphics, 17(5), 557–
569.
Markellos, K., Perdikuri, K., Markellou, P., Sirmakessis,
S., Mayritsakis, G., & Tsakalidis, A. (2002).
Knowledge Discovery in Patent Databases. In
Proceedings of the Eleventh International Conference
on Information and Knowledge Management (pp.
672–674). New York: ACM.
Miksch, S. & Aigner, W. (2014). A matter of time:
Applying a data–users–tasks design triangle to visual
analytics of time-oriented data, Computer & Graphics,
38, 286–290.
Ordover, J. A. (1991). A patent system for both diffusion
and exclusion. The journal of economic perspectives,
5, 43–60.
Rodriguez, M. A., & Neubauer P. (2012). The graph
traversal pattern, In Graph data management:
Techniques and applications. IGI Global.
Schulz, H. (2011). Treevis net: A tree visualization
reference. Computer Graphics and Applications,
IEEE, 31(6), 11–15.
Trippe, A. (2003). Patinformatics: Tasks to tools. World
Patent Information, 25(3), 211–221.
Yoon, B. & Park, Y. (2004). A text-mining-based patent
network: Analytical tool for high-technology trend.
The Journal of High Technology Management
Research, 15(1), 37–50.
AConceptfortheExploratoryVisualizationofPatentNetworkDynamics
273
