Evaluation of 3D Analysis Error Caused by SVP Approximation of
Fisheye Lens
Nobuyuki Kita
Intelligent Systems Research Institute, National Institute of Advanced Industrial Science and Technology, Tsukuba, Japan
Keywords: Fisheye Camera, Viewpoint Shift, Single Viewpoint, Error Evaluation, Self-localization, Stereo Calibration,
Epipolar Constraint, Stereo Measurement.
Abstract: We have been doing research about visual SLAM, 3D measurements and robot controls by using images
obtained through fisheye lenses. Though fisheye lens is non-single viewpoint (NSVP), we established the
3D analysis methods based on single viewpoint (SVP) model. In this paper, we call such substitution SVP
for NSVP as “SVP approximation” and evaluate 3D analysis errors caused by the SVP approximation in the
case using two different types of fisheye lenses.
1 INTRODUCTION
Fisheye lens has been often used to obtain views of
very wide field in the computer/robot vision research.
We also have been doing research about visual
SLAM (Kita, 2008), 3D measurements (Kita, 2012)
and robot controls (Kita, 2011a, 2013) by using
images obtained through fisheye lenses. Though
fisheye lens is non-single viewpoint (NSVP), we
established the 3D analysis methods based on single
viewpoint (SVP) model as same as that most of
methods using fisheye lens (Abraham, 2005)
(Schwalbe, 2005). Gennery proposed a lens model
considering shift of viewpoint and a calibration
method based on his lens model. He also evaluated
the calibration error when using and not using
viewpoint shift (Gennery, 2006). But no literatures
evaluating the 3D analysis error when using and not
using viewpoint shift can be found. In this paper, we
call such substitution SVP for NSVP as “SVP
approximation” and evaluate 3D analysis errors
caused by the SVP approximation in the case using
two different types of fisheye lenses.
Section 2 explains an overview of this
evaluation. Section 3 describes about evaluation of
self-localization error. Section 4 describes about
evaluation of stereo calibration error. Section 5
describes about evaluation of stereo 3D
measurements error. Section 6 summarizes.
2 OVERVIEW
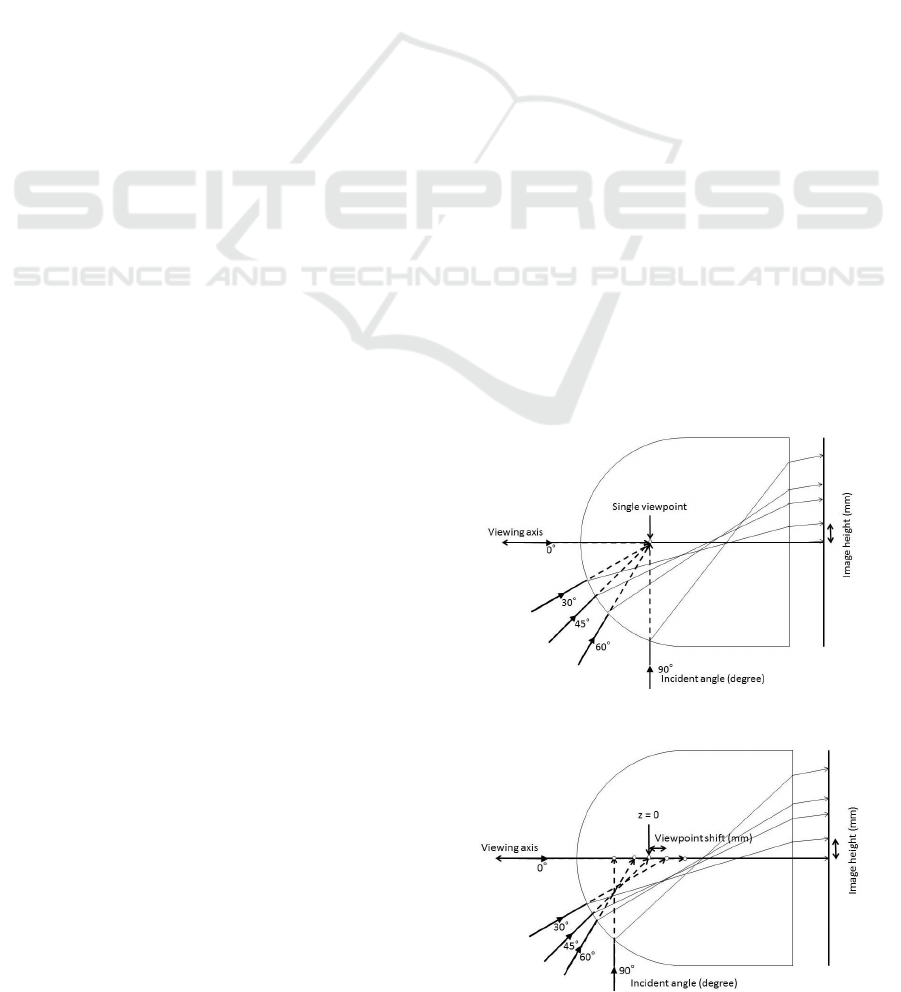
Most of cameras have a single viewpoint as shown
in the figure 1. But fisheye lens’s viewpoint usually
moves on a line. Then it is a kind of axial model
(Ramalingam, 2006). But it is a special case that the
Figure 1: SVP model.
Figure 2: ShiftVP model.
357
Kita N..
Evaluation of 3D Analysis Error Caused by SVP Approximation of Fisheye Lens.
DOI: 10.5220/0005317403570368
In Proceedings of the 10th International Conference on Computer Vision Theory and Applications (VISAPP-2015), pages 357-368
ISBN: 978-989-758-091-8
Copyright
c
2015 SCITEPRESS (Science and Technology Publications, Lda.)
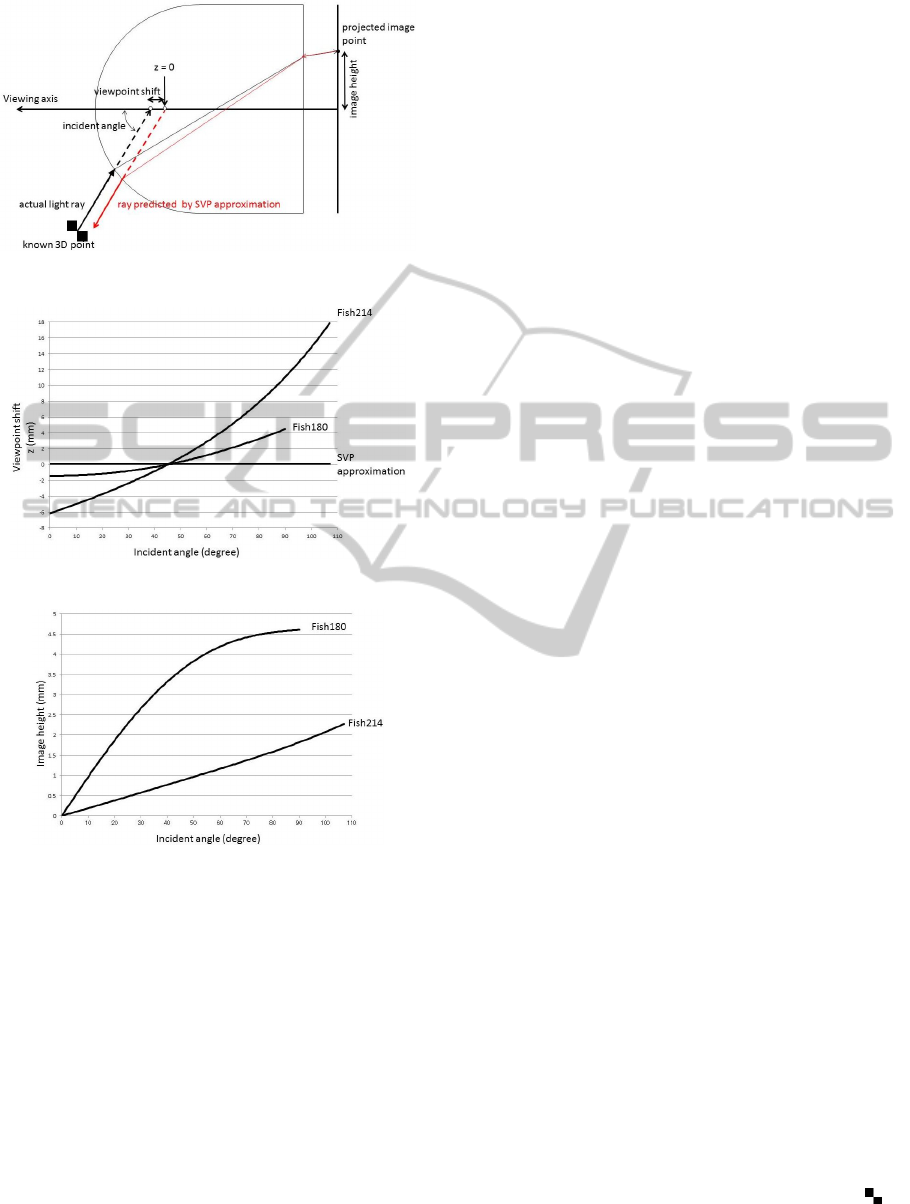
Figure 3: A light ray predicted by SVP approximation.
Figure 4: Incident angle and viewpoint shift.
Figure 5: Incident angle and image height.
line is coincident with a viewing axis as shown in
the figure 2. Here we call the projection model of
fisheye lens as “shifting viewpoint (ShiftVP) model”
following Gennery (Gennery, 2006) and represent it
by the two relations, one for between incident angle
and viewpoint shift and another for between incident
angle and image height (figure 2). By using these
two relations, a projected image point of a known
3D point to a camera whose pose is known can be
obtained as shown in the figure 3. Furthermore a
light ray projected backward from an image point is
obtained. SVP model which we use for 3D analysis
has the same relation for between incident angle and
image height but a constant viewpoint position as
shown in the figure 1. A red arrow in the figure 3
shows a light ray predicted by SVP approximation
which has error from the actual incoming light ray.
In the paper, we use two different types of
fisheye cameras Fish180 and Fish214 to evaluate
SVP approximation error. The two relations of the
cameras are shown in the figure 4 and 5. The lens of
Fish180 is a foveated fisheye lens whose viewing
angle is 180degree and image height curve is based
on f∙sin. The circular viewing field is projected
on the image whose size is 640 × 640pixels. The
lens of Fish214 is a spherical fisheye lens whose
viewing angle is 214degree and image height curve
is based on f∙. The circular viewing field is
projected on the image whose size is 1536 ×
1536pixels. These particular curves correspond to
the fisheye lenses which we are using (Kita, 2011b)
(Kita, 2011a).
3 SELF-LOCALIZATION
Evaluation of self-localization errors caused by the
SVP approximation in the case using fisheye lens is
explained. Self-localization is based on known
landmarks. Several environments of landmarks are
prepared. To avoid image processing error, the
inputs to the localization method is the set of image
coordinates which are numerically calculated from
known landmarks positions and a known camera
pose (true pose) by ShiftVP models. The algorithm
of the self-localization method is a bundle
adjustment. A camera is initially set to arbitrarily
pose which is a little different from true pose. The
camera pose is updated as decreasing the difference
between image coordinates calculated by SVP
model and inputs. We exploited the utility function
of the Levenberg-Marquardt method from
OpenCV.We prepared 9 environments of landmarks.
The first one (Whole) has 33 landmarks which are
set 2.0m far from the origin in the space z < 0. The
second one (Inner) has 15 landmarks which are set
as same as the first one but just around z axis. The
third one (Outer) has 18 landmarks which are set as
same as the first one but just not around z axis. For
the following threes, the distance between the origin
and landmarks are changed from 2.0m to 0.5m. For
the following threes, the distance between the origin
and landmarks are changed to 0.2m. The camera is
set at the origin and gazing minus z direction. The
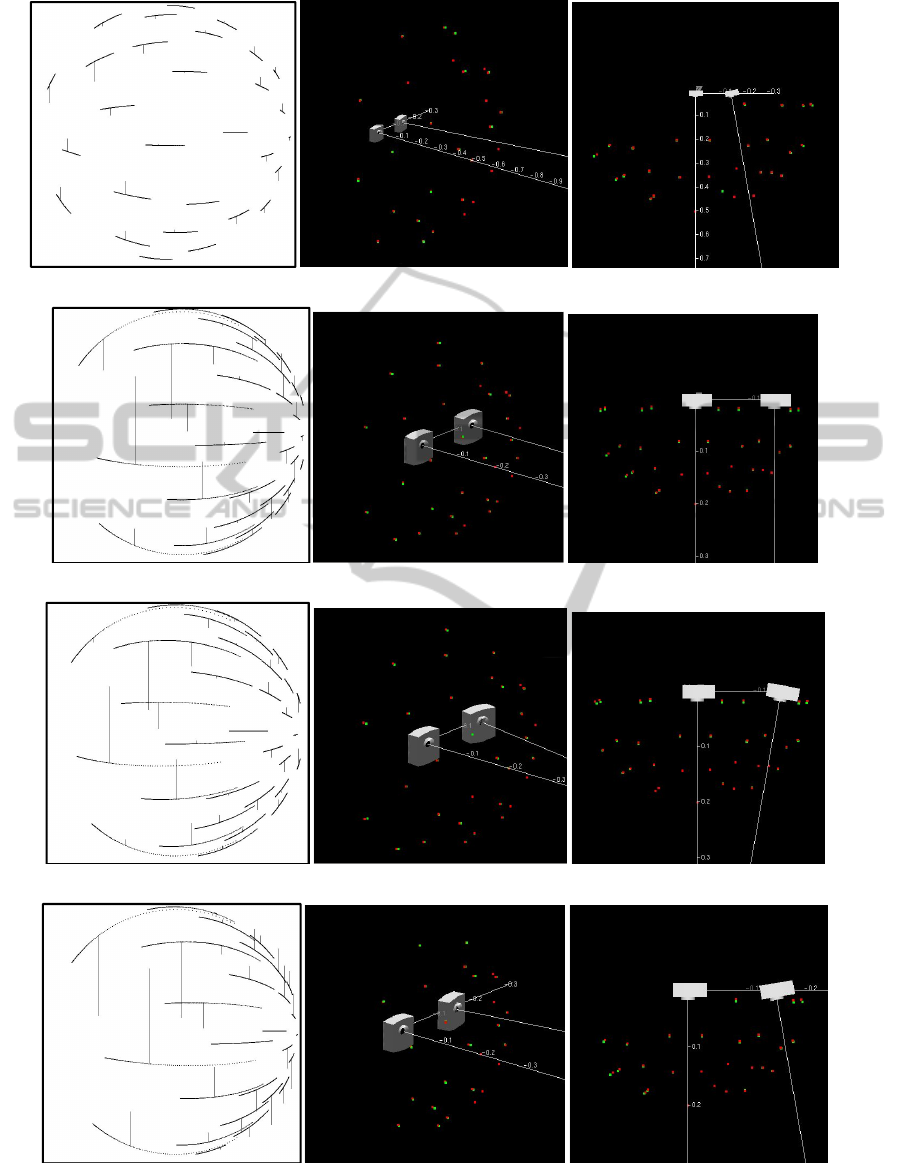
3D views on the columns 1 and 2 of the figure 6
depict the true pose of a camera by a white square
and a line and the 3D positions of landmarks by .
The order of rows follows the order of environments
explanation above. The third and fourth column of
VISAPP2015-InternationalConferenceonComputerVisionTheoryandApplications
358
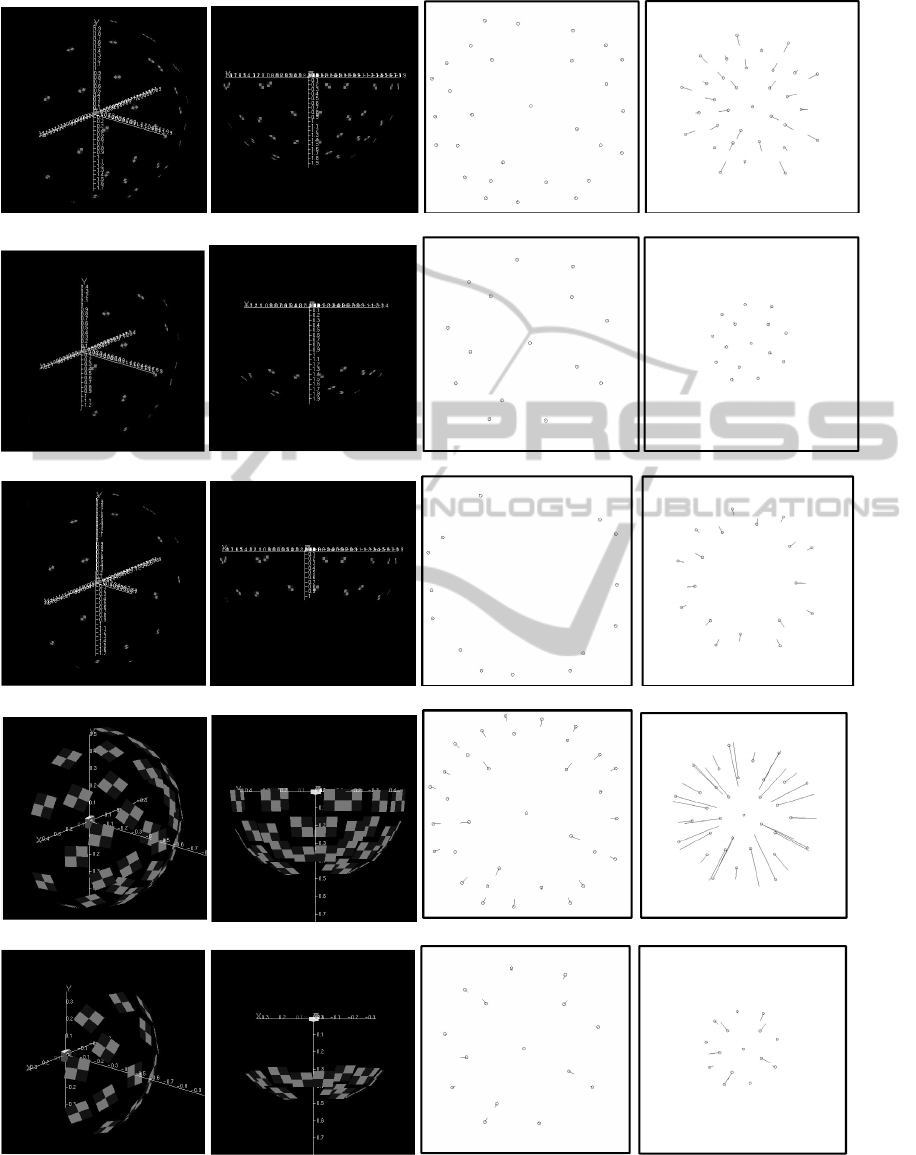
Figure 6: Self-localization error evaluation results.
Evaluationof3DAnalysisErrorCausedbySVPApproximationofFisheyeLens
359
Figure 6: Self-localization error evaluation results (cont.).
the figure 6 depict the image positions of landmarks
projected by ShiftVP model by small circles. Short
lines depict the image residuals after the Levenberg-
Marquardt iterations for the Fish180 and Fish214
respectively. The length of the short lines are
magnified times 100.
Table 1 and 2 show the localization errors and
average of residuals after iterations for Fish180 and
Fish214 respectively. The axis error means the angle
difference between the true and the estimated
viewing axes. For Fish180, position errors of x and y
directions which are the directions perpendicular to
the viewing axis are less than 0.1mm. Position errors
of z direction which is the direction of the viewing
axis for the Whole environments are from -0.11mm
to -0.16mm. Position errors of z direction for the
Inner environments are 0.24mm. Position errors of z
direction for the Outer environments are -1.57mm, -
1.67mm and -1.69mm. Axis errors are very small
and maximum is 0.04degree. For Fish214, position
errors of x and y directions which are the directions
perpendicular to the viewing axis are less than
0.3mm. Position errors of z direction which is the
direction of the viewing axis for the Whole
VISAPP2015-InternationalConferenceonComputerVisionTheoryandApplications
360
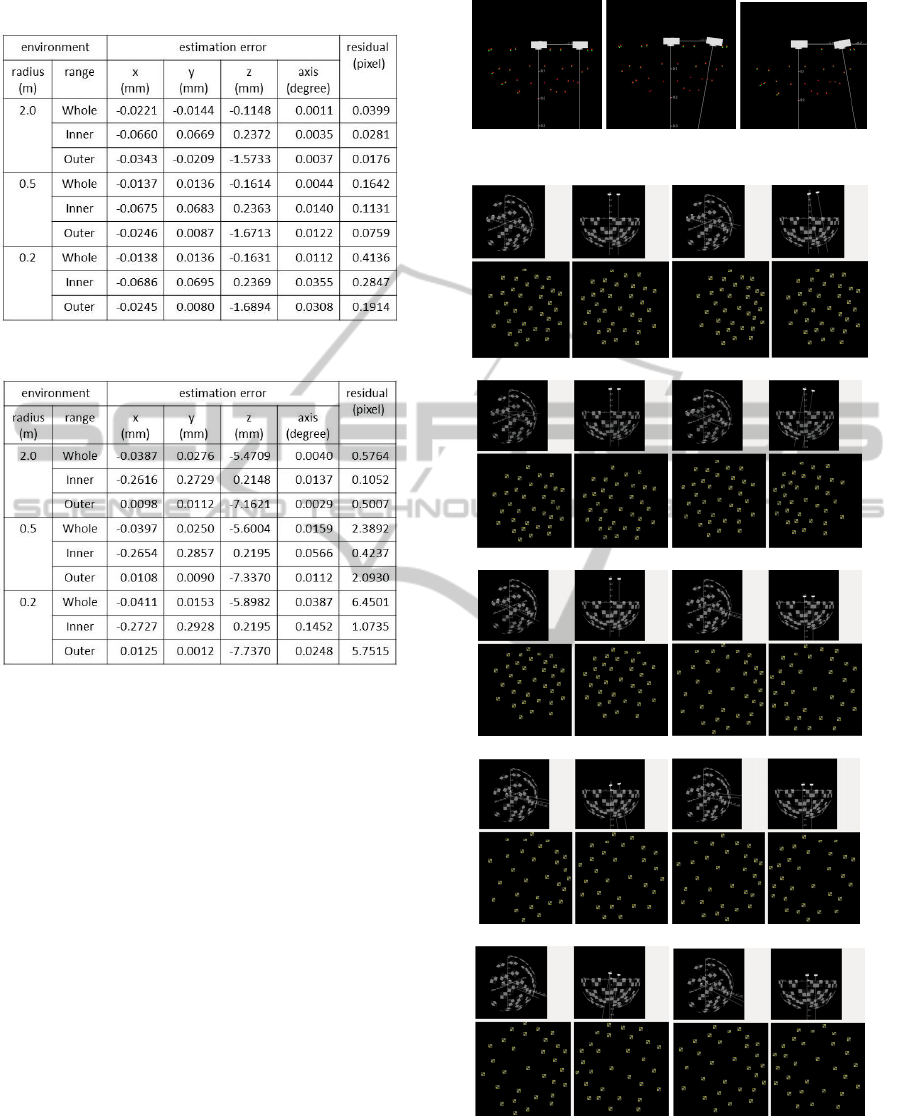
Table 1: Self-localization error for Fish180.
Table 2: Self-localization error for Fish214.
environments are from -5.4mm to -5.9mm. Position
errors of z direction for the Inner environments are
0.22mm. Position errors of z direction for the Outer
environments are from -7.1mm to -7.7mm. Axis
errors are very small and maximum is 0.15degree.
Position errors in z direction for Fish214 are fairly
large, while ones for Fish180 are much small. It is
because the amount of viewpoint shift of Fish214 is
much larger than one of Fish180. As for the
landmarks distribution, the distance between the
camera and landmarks looks not affect the
localization errors, but the range of landmarks looks
affect them. The fact suggests us to select landmarks
so that their images are projected in the whole field
of view to get the stable localization results.
Visual localization is actually affected by image
quantization etc. Whether the errors caused by SVP
approximation can be neglected or not depends on
processing methods and application demands.
4 STEREO CALIBRATION
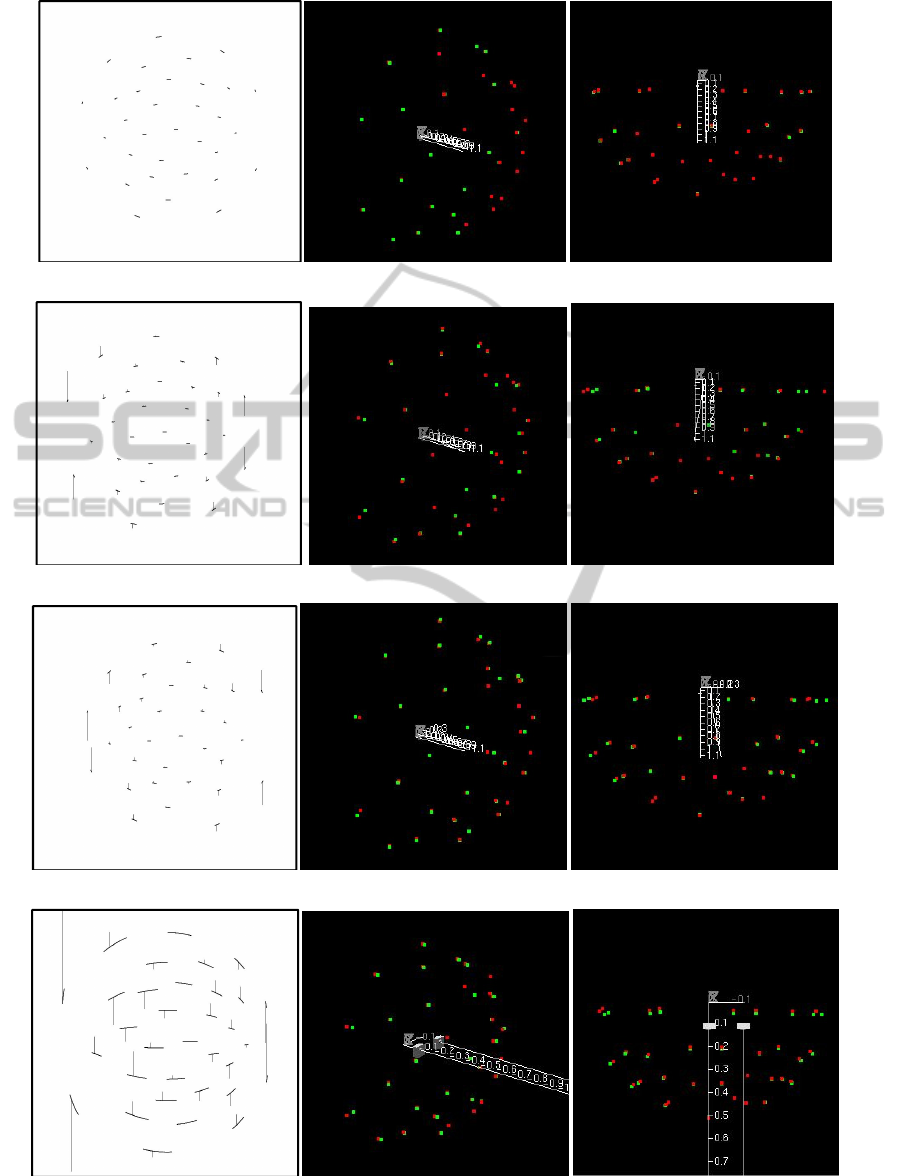
Evaluation of stereo calibration errors caused by the
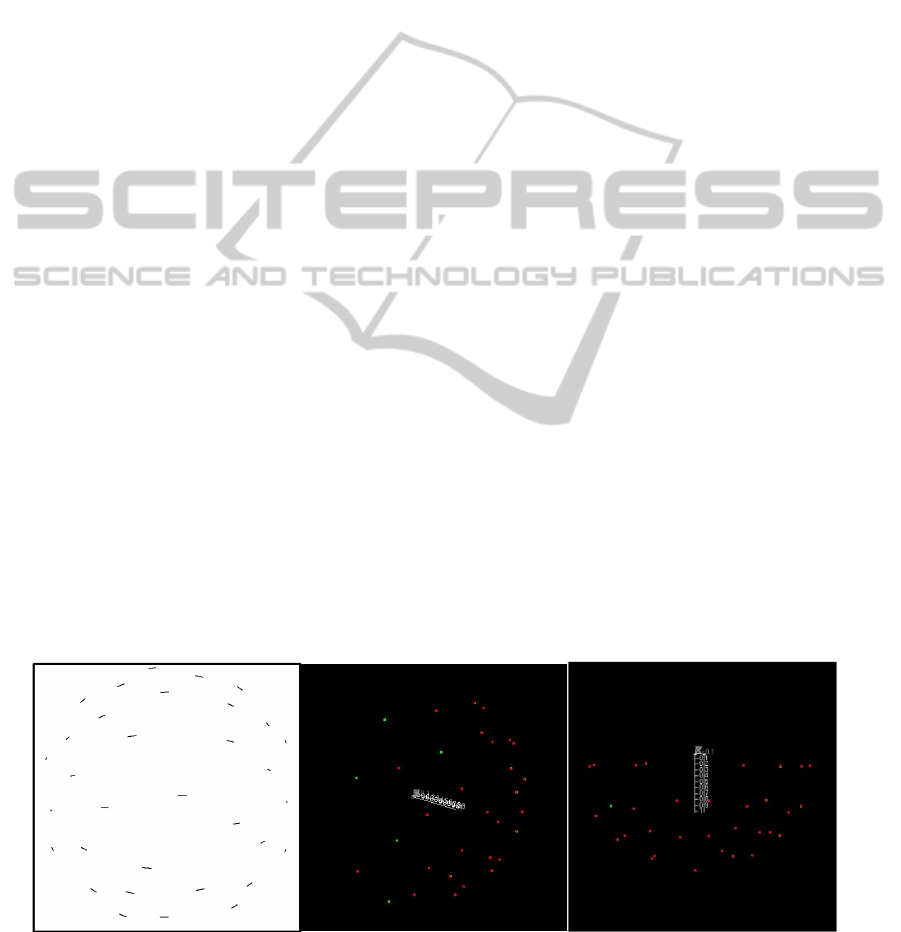
Figure 7: Stereo configurations.
Figure 8: An example of input gathering for stereo
calibration.
SVP approximation in the case using fisheye lens is
realized. Inputs for the calibration procedure are the
Evaluationof3DAnalysisErrorCausedbySVPApproximationofFisheyeLens
361
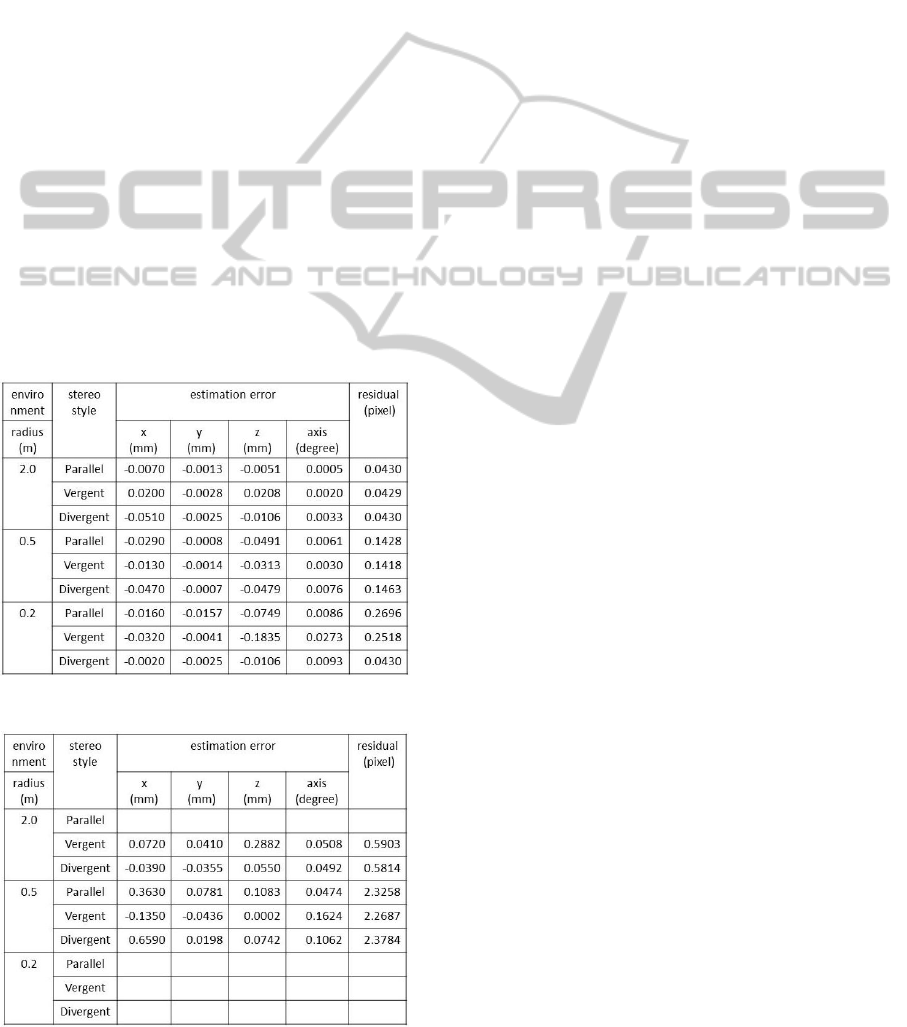
set of image coordinates which are numerically
calculated from known landmarks positions and
known stereo camera poses by ShiftVP models.
Three different types of stereo configurations are
tested. As shown in the figure 7, the viewing axis of
the left camera is set as parallel to one of the right
camera for the parallel type, the viewing axis of the
left camera is set 10degree inside for the vergent
type, and the viewing axis of the left camera is set
10degree outside for the divergent type. For all types
the baseline length is 0.15m. For the calibration
targets, Whole environments of radius 2.0m, 0.5m
and 0.2m are used. To gather the stereo calibration
inputs, each stereo rig set at the 10 different poses.
An example to gather the stereo calibration inputs
for vergent stereo using 0.5m radius Whole
environment is shown in the figure 8.
The algorithm of the stereo calibration follows
the function “cvStereoCalibration” in OpenCV
(Bradski, 2008). Table 3 and 4 show the stereo
calibration errors and average of residuals after
iterations for Fish180 and Fish214 respectively. The
position errors mean the differences between correct
and estimated left camera positions in the right
Table 3: Stereo calibration error for Fish180.
Table 4: Stereo calibration error for Fish214.
camera coordinate system. The axis errors mean the
angle differences between correct and estimated left
camera’s viewing axes. For Fish180, both of
position and axis errors for three stereo
configurations are very small. For Fish214, some
values in the table could not be gotten by any bug of
program, but soon it will be debugged and the table
will be fill up. As long as evaluating the gotten
results, both of position and axis errors for three
stereo configurations are rather larger than those of
Fish180.
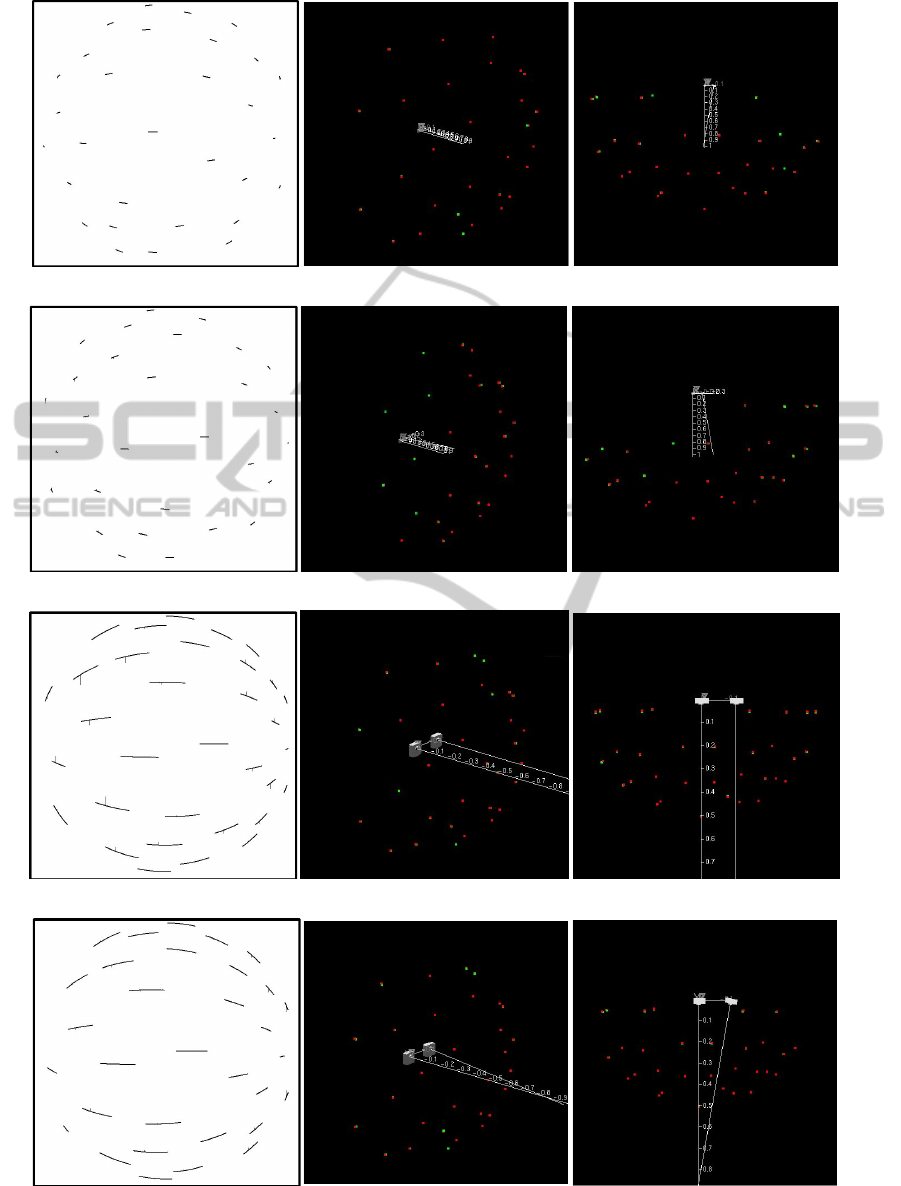
5 STEREO MEASUREMENTS
Evaluations of stereo epipolar constraint and depth
measurement errors caused by the SVP
approximation in the case using fisheye lens are
realized. As same as section 4, three different types
of stereo configurations and Whole environments of
radius 2.0m, 0.5m and 0.2m are used. The stereo
camera is set as the right camera gazes minus z
direction from the origin for Fish180 and
(0.0,0.0,−0.1) for Fish214. Inputs for the
evaluation are the set of image coordinates which
are numerically calculated from known landmarks
positions and a known stereo camera pose by
ShiftVP models.
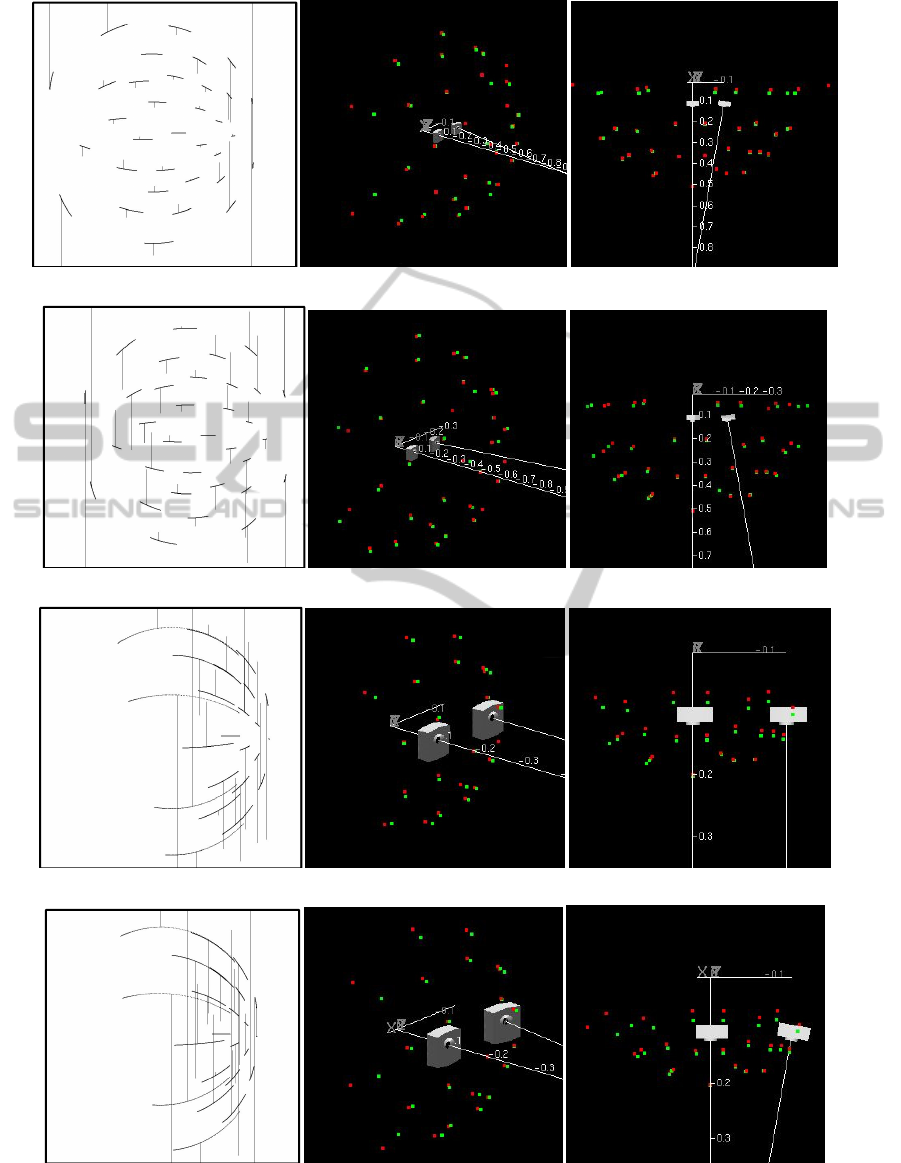
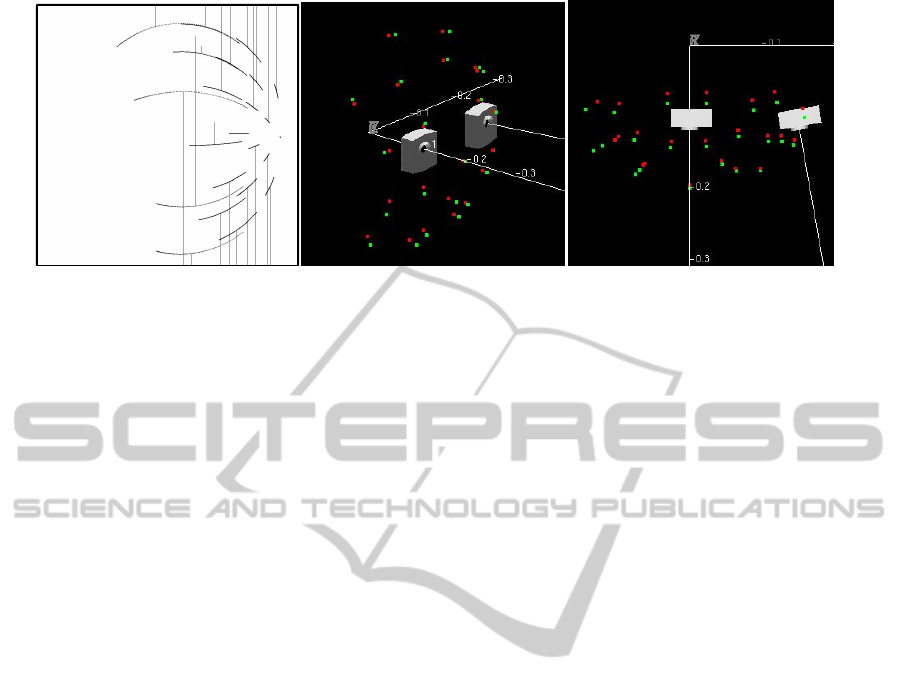
Figure 9 and 10 show the evaluation results for
Fish180 and Fish214 respectively. In the figure of
the first column, curved lines depict epipolar lines
on the left images which are predicted from the
image coordinates in the right image and the stereo
parameters by using SVP model. Here the correct
stereo parameters are used to clarify the errors
caused by SVP approximation. Vertical lines in the
figure of the first column depict the vertical errors
between the actual image coordinates on the left
image and the predicted epipolar lines. The length of
the short lines are magnified times 100 in the figure
9 and magnified times 10 in the figure 10. Error2 is
an average of the vertical errors in pixel. In the
figures of the second and third columns, red and
green dots depict real and measured 3D positions of
the targets respectively. Error3 is an average of the
3D distances between real and measured 3D
positions of the targets.
Vertical errors of epipolar lines increase when
the targets become close to a stereo camera. They
also seem to have relation with stereo configurations
though it is not clear. In most of cases, the average
sizes of errors increase in the order of parallel,
vergent and divergent. For the Fish180, the averages
of the vertical errors are between 0.004pixel to
VISAPP2015-InternationalConferenceonComputerVisionTheoryandApplications
362
0.61pixel. For the Fish214, the averages of the
vertical errors are between 0.03pixel to 9.3pixel. The
errors of Fish214 are much larger than ones of
Fish180 provably because of the differences of the
shift amounts of viewpoint and the pixel sizes of
camera images. For the every case, the error size
greatly varies depending on the target position in the
left image and looks some pattern which is
interesting and will need more evaluations. If a
stereo matching algorithm relays on an epipolar
constraint, more than one pixel error will drastically
affect the reliability of the matching results.
For the Fish180, the averages of the 3D position
measurement errors are between 1.6mm and 8.6mm.
For the Fish214, the averages of the 3D position
measurement errors are between 6.4mm and
43.4mm. No clear relation between the error sizes
and the distances to targets/stereo configurations is
found.
6 CONCLUSIONS
The errors caused by SVP approximation are
evaluated for self-localization, stereo calibration,
epipolar constraints and 3D depth measurements.
Visual analysis is actually affected by image
quantization etc. Whether the errors caused by SVP
approximation can be neglected or not depends on
processing methods and application demands.
If a stereo camera of Fish214 is used for the
stereo analysis of a target which is close to the stereo
camera, shift amount of viewpoint must be
considered.
REFERENCES
Kita, Nobuyuki, 2008. Improvements of MonoSLAM
performance by Wide Angle of View. DIA2008, O2-2
(in Japanese).
Kita, Nobuyuki, 2012. 3D Shape Measurement of a Large
Cloth close to a Fisheye Stereo, IEEE/SICE
International Symposium on System Integration, 895–
900.
Kita, Nobuyuki, 2011a. Direct floor height measurement
for biped walking robot by fisheye stereo, 11th IEEE-
RAS International Conference on Humanoid Robots,
187–192.
Kita, Nobuyuki, 2013. Obstacle Detection for a Bipedal
Walking Robot by a Fisheye Stereo, IEEE/SICE
International Symposium on System Integration, 119–
125.
Abraham, Steffen, and Förstner, Wolfgang, 2005. Fish-
eye-stereo calibration and epipolar rectification,
ISPRS Journal of Photogrammetry and Remote
Sensing, vol. 59, pp. 278-288.
Schwalbe, E., 2005. Geometric modelling and calibration
of fisheye lens camera systems, 2nd Panoramic
Photogrammetry Workshop.
Gennery, B., Donald, 2006. Generalized Camera
Calibration Including Fish-Eye Lenses. International
Journal of Computer Vision 68(3), 239–266.
Ramalingam, Srikmar, Sturm, Peter, and Lodha, K.,
Suresh, 2006. Theory and Calibration for Axial
Cameras. Asian Conference on Computer Vision,
704–713.
Kita, Nobuyuki, 2011b. Dense 3D Measurement of the
Near Surroundings by Fisheye Stereo, IAPR
Conference on Machine Vision Applications, 148–
151.
Bradski, Gary, and Kaehler, Adrian, 2008. Learning
OpenCV.
APPENDIX
Error2 = 0.004pixel Error3 = 4.43mm
Figure 9: Stereo measurements error evaluation results for Fish180.
Evaluationof3DAnalysisErrorCausedbySVPApproximationofFisheyeLens
363
Error2 = 0.017pixel Error3 = 5.90mm
Error2 = 0.070pixel Error3 = 8.56mm
Error2 = 0.070pixel Error3 = 2.13mm
Error2 = 0.039pixel Error3 = 1.64mm
Figure 9: Stereo measurements error evaluation results for Fish180 (cont.).
VISAPP2015-InternationalConferenceonComputerVisionTheoryandApplications
364
Error2 = 0.165pixel Error3 = 3.26mm
Error2 = 0.394pixel Error3 = 2.10mm
Error2 = 0.320pixel Error3 = 1.76mm
Error2 = 0.615pixel Error3 = 1.99mm
Figure 9: Stereo measurements error evaluation results for Fish180 (cont.).
Evaluationof3DAnalysisErrorCausedbySVPApproximationofFisheyeLens
365
Error2 = 0.026pixel Error3 = 6.43mm
Error2 = 0.295pixel Error3 = 41.97mm
Error2 = 0.339pixel Error3 = 43.38mm
Error2 = 1.506pixel Error3 = 14.20mm
Figure 10: Stereo measurements error evaluation results for Fish214.
VISAPP2015-InternationalConferenceonComputerVisionTheoryandApplications
366
Error2 = 2.689pixel Error3 = 23.40mm
Error2 = 3.883pixel Error3 = 22.55mm
Error2 = 6.392pixel Error3 = 10.22mm
Error2 = 8.316pixel Error3 = 13.99mm
Figure 10: Stereo measurements error evaluation results for Fish214 (cont.).
Evaluationof3DAnalysisErrorCausedbySVPApproximationofFisheyeLens
367
Error2 = 9.329pixel Error3 = 13.07mm
Figure 10: Stereo measurements error evaluation results for Fish214 (cont.).
VISAPP2015-InternationalConferenceonComputerVisionTheoryandApplications
368
