
Saliency Detection using Geometric Context Contrast Inferred from
Natural Images
Anurag Singh
1
, Chee-Hung Henry Chu
1,2
and Michael A. Pratt
3
1
Center for Advanced Computer Studies,
2
Informatics Research Institute,
3
W.H. Hall Department of Electrical and Computer Engineering,
University of Louisiana at Lafayette, Lafayette, LA, U.S.A.
Keywords: Visual Saliency, Geometric Context, Large Image Collections, Superpixels.
Abstract: Image saliency detection using region contrast is often based on the premise that salient region has a
contrast with the background which becomes a limiting factor if the color of the salient object background is
similar. To overcome this problem associated with single image analysis, we propose to collect background
regions from a collection of images where generative property of, say, natural images ensures that all the
images are spun out of it hence negating any bias. Background regions are differentiated based on their
geometric context where we use the ground and sky context as background. Finally, the aggregated map is
generated using color contrast between the superpixels segments of the image and collection of background
superpixels.
1 INTRODUCTION
Salient object detection has many useful applications
in image understanding, image summarization, and
object detection. The goal for single image salient
object detection is to highlight pixels that stand out.
We explore the view that for an object to be salient it
should not only be salient in the image itself but it
should be salient in a larger context of similar
images. In this paper we propose use of background
geometric context regions derived from similar
images to highlight a salient object.
In color comparison based salient object
detection algorithm, color comparisons are done
between regions in a single image. The major
drawback of this approach is if the salient object and
background has similar color profile the comparison
based algorithm fails to detect the salient region
correctly. To overcome that problem we propose the
use of salient features derived from a large
collection of similar natural images. The advantages
of using natural images are its generative property
(Hyvärinen, 2009) ensures that all images can be
seen as being spun out of it and natural images have
closeness to evolutionary visual process which is
developed in the visual cortex of primates.
For a given input image we first find the similar
natural images derived from its scene category and
Figure 1: Input Image, Saliency Map, and Ground Truth.
GIST descriptor based distance. For these natural
images we find their geometric context (Hoiem et
al., 2005). The geometric context divides an image
into three regions, namely sky, ground and verticals.
Geometric context helps to find only similar
background regions (sky or ground). The regions
here are represented using superpixels (Veksler et
al., 2010) as each of them is more or less
homogeneous in its color property.
We experimentally show that a salient region can
be effectively highlighted when the salient region is
compared to a large set of background superpixels
from a similar collection of natural images. The
main contributions of this paper are as follows. i) we
show that an object is salient in a context of similar
natural images, ii) a collection of natural images can
be used to aid saliency detection and, iii) geometric
context plays a useful role in comparison based
saliency detection.
609
Singh A., Henry Chu C. and A. Pratt M..
Saliency Detection using Geometric Context Contrast Inferred from Natural Images.
DOI: 10.5220/0005316906090616
In Proceedings of the 10th International Conference on Computer Vision Theory and Applications (VISAPP-2015), pages 609-616
ISBN: 978-989-758-089-5
Copyright
c
2015 SCITEPRESS (Science and Technology Publications, Lda.)

Figure 2: Flow diagram for proposed method.
This paper is organized as follows. We begin by
reviewing related work in Section 2. In Section 3,
we describe our algorithm by briefly introducing
how similar natural images are found followed by
image features required for saliency detection. We
then describe in details the method for computing
visual saliency detection using large collection of
background superpixels. In Section 4, we present our
experimental results. Finally, we draw our
conclusions in Section 5.
2 RELATED WORK
There are two general directions for saliency
detection, the first being biologically inspired where
the focus is to mimic eye-tracking which in practice
is not very useful for other computer vision
applications (Cheng et al., 2011). The second one is
that of salient object detection where the main goal
is to highlight the salient object in the image which
is mostly found using region based color contrast
(Singh et al., 2014; Goferman et al., 2010; Cheng et
al., 2011). The contrast based methods mainly differ
on how the color representation is chosen. Once the
color representation is established saliency is found
by contrasting between regions. The line of work
that are similar to our work is that of co-saliency
where an image-saliency pair is used to guide
saliency of a new image.
Co-saliency between images is learnt by
combining features using weights of a linear SVM
as a feature mapping technique between two image
pairs (Toshev et al., 2007). Co-saliency discovers
the common saliency on the multiple images where
the contrast, spatial and correspondence cues are
compared between clusters to find the co-occurrence
of an object in dataset. Co-saliency (Cheng et al.,
2011) is found as a product of saliency and
repeatedness. Co-saliency for salient object is found
using co-segmentation. An energy function is
minimized to get segmentation of an object from
two different images using a joint-image graph
(Jacobs et al., 2010). Co-segmentation (Mukherjee
et al., 2009) can be inferred with a penalty on the
sum of squared differences of the foreground
region’s histogram.
Our method is different from others methods in
a way that we use only background regions from
similar images because a region should be salient in
a larger background and not just in the image.
VISAPP2015-InternationalConferenceonComputerVisionTheoryandApplications
610

Figure 3: Pipeline for retrieving similar images and their background features.
3 SALIENCY DETECTION
Our goal is to highlight a salient region using
background geometric context (sky and ground)
from similar set of natural images. Figure 2 shows
the flow diagram for the computation of the
proposed saliency detection algorithm. In order, we
describe superpixels generation, retrieving similar
images, image features computation, and saliency
computation.
3.1. Image over Segmentation
To highlight a salient region in an image we want to
compare and contrast it against a collection of
similar images. Comparison step is of quadratic
order hence comparing pixels is computationally
expensive it is suitable to divide the images into
regions. Superpixels are a good representation of
regions. They are usually homogeneous and their
boundaries fall on image edges making them true
segments. Superpixels can be generated by
clustering of pixels based on similarity or defining
them as a labelling problem and solving it using an
energy minimization framework.
3.2 Similar Image Search
A salient image regions stands out in the context of
other similar natural images. To find similar images
we use a collection of publicly available natural
image datasets. For an input image we find the
image category that matches closet to it. This
ensures images are extracted based on the most
similar category. Next, using images from a similar
category we find the GIST descriptor to retrieve N
closest image. Figure 3 shows the pipeline of
retrieving similar images and their background
features.
3.2.1 Natural Image Category
The SUN database (Xiao et al., 2010) is the most
extensive scene category database where there are
three types of broad scene hierarchy as indoor,
outdoor man-made, and outdoor natural. We pick the
outdoor natural category as the source of natural
images. The outdoor category gives a generic set of
similar images for the input image.
3.2.2 Similar Image Search
Image categories can have results in thousands of
images and it is not feasible to compare using all of
them. Each category itself will have various types of
images. To get images that are most similar from the
chosen category to input image we use GIST
descriptors. Similar scene images provide a dual
advantage as in they are not semantically different
and yet they provide discriminant background
information.
GIST (Oliva and Torralba,
2001): GIST is one
of the first scene recognition descriptors. It has been
widely used for scene completion and image
retrieval applications. These descriptors are based on
perceptual properties of the natural images and it
summaries these images into low dimensional
representation. The GIST descriptor computes the
output energy of a bank of 24 filters. The filters are
Gabor-like filters tuned to 8 orientations at 4
different scales. The square output of each filter is
then averaged on a 4 × 4 grid. GIST summarizes the
scene (image) well and as a descriptor makes it very
useful for finding similar images.
Image Ranking: We rank category images
based on the closeness between their GIST
descriptors and input image descriptors. The ranking
ensures similar the images have a higher rank. We
choose N most similar images where N is
empirically set at 20 based on image ranking.
GIST
Scene Category
Input
Image
Retrieved
Images
Image Collection
Image
Ranking
Natural Images
Background
superpixels
Color
Position
Geometric
SaliencyDetectionusingGeometricContextContrastInferredfromNaturalImages
611

Figure 4: Image Features.
3.3 Image Features
For each superpixel region we would like to
compute features that are used for saliency
computation. For our algorithm we use geometric
context, color difference, position difference and
objectness measure. In this section we will describe
each of the features in detail. Figure 4 shows
example of image features at pixel level and
superpixel level.
3.3.1 Color Difference
Color is most dominant attribute for the salient
region. A salient region is highly discriminative in
the color space. The color space used is CIE L*a*b*
which is closest to human visual system. To
summarize a region most commonly used method is
to find the average color in each channel. Other
methods to summarize a region use quantized color
histogram (Cheng et al., 2011) and dominant color
descriptor (Singh et al., 2014). We use average
color as it is simple to compute and superpixels are
mostly homogeneous with respect to color.
3.3.2 Geometric Context Feature
Saliency detection as an early process is used to
assist higher level vision tasks like object detection.
It was found by (Torralba et al., 2003) that context
plays a very important role in object detection for
real world scenario. Conventional saliency detection
algorithms largely ignore the geometric context
while estimating the distinct pixels in an image. We
explore the use of context for saliency detection.
Any outdoor natural image can broadly be
divided into three contexts viz. sky, ground and
vertical objects. These three context categories are
relative to the 3D orientation of a region with respect
to camera. Dividing the image into geometric
context of the images by learning on image features
for a segment like color, texture, location, shape and
3D geometry was first proposed by (Hoiem et al.,
2005).
For saliency detection geometric context can be
used to compare between contrasting contexts. Most
salient regions are highly likely to be in the vertical
context while non salient background regions are
likely to be in sky and ground context. We propose
to use geometric context as a feature where only
background contexts (sky and ground) are used of
comparison.
The learning algorithm can learn more than one
context for the pixels within superpixel. To compute
geometric context for each superpixel is done by
estimating which context that has the maximum
influence. Maximum influence is the context with
the most number of pixels to it:
geo
gc
,ifmcsk
y
;
gc
,ifmcground
gc
, ifmcvertical
(1)
where, geo
is the geometric context for superpixel
r; the terms gc
,gc
, and gc
are categorical
labels associated with the context; and mc is the
maximum influencing context.
3.3.3 Position Difference
The spatial position of each superpixel in image
plane is given by calculating the mean position value
of all the constituent pixels in the superpixel. For
saliency detection purpose it gives the correct
estimate for the spatial location of superpixel in the
image plane. In our saliency model the motivation is
to show that salient superpixels are closer to each
other and background is all over the place.
Input Image Pixel Level Superpixel Level
Objectness
Average
Color
Geometric
Context
VISAPP2015-InternationalConferenceonComputerVisionTheoryandApplications
612
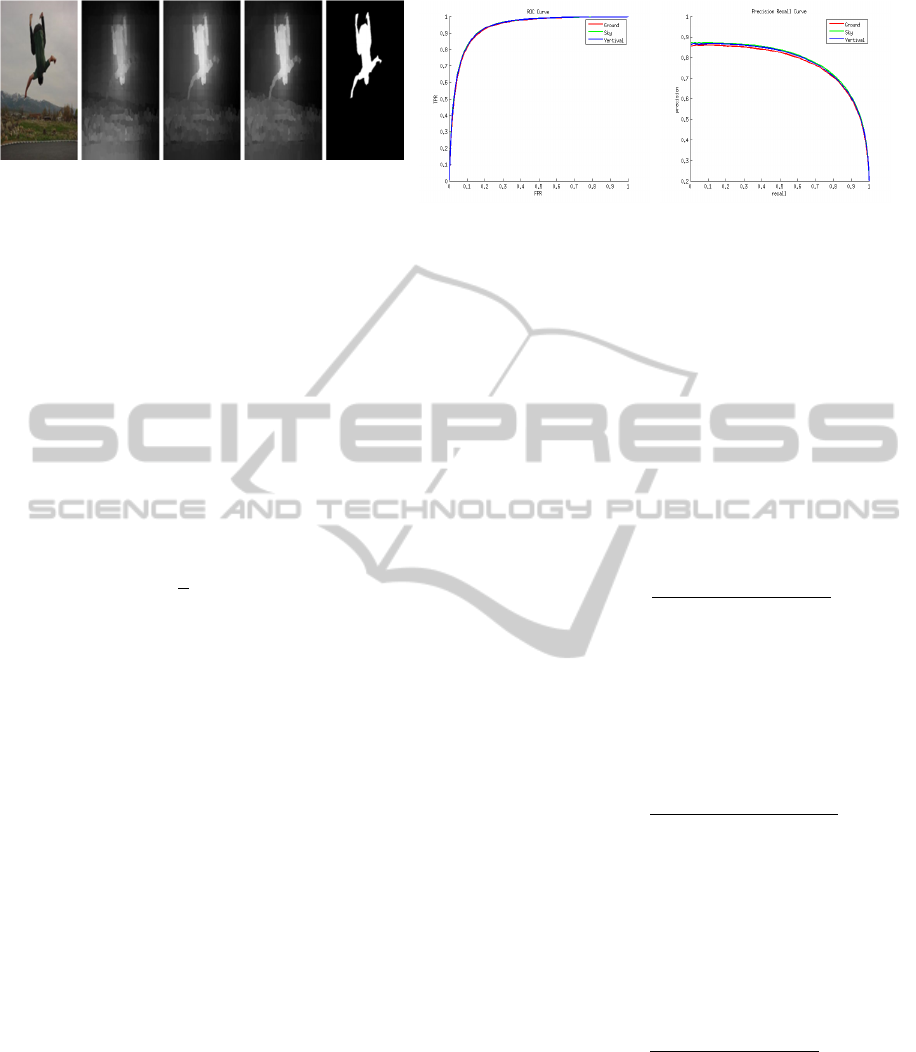
5a: Visual comparison. 5b: ROC curve. 5c: Precision Recall curve.
Figure 5: The sky and ground geometric context used as background gives better performance over the vertical context.
3.3.4 Objectness Measure
The objectness map of an image is the probability of
occurrence of a generic object in a window (
Alexe
et
al.
, 2012).
Sampling for object windows gives the
notion of objectness (Sun and Ling, 2013) which
ensures higher objectness measure for a pixel if
there is a higher probability of occurrence of an
object. Objectness for a superpixel is computed by
summing and averaging the objectness value of all
the pixels under each superpixel and is given by
objectness
1
J
Pob
x
,
y
(2)
where, objectness
is the objectness for superpixel i,
J is the total pixels in superpixel r, Pob
is the
probability of occurrence of an object. We use
objectness as noise reduction, bias and focus. It
effectively reduces low level responses attributed to
non object pixels.
3.4 Saliency Computation
First step in our saliency computation is quantization
of background features derived from natural images.
We extract sky and ground geometric context
superpixels from the similar natural images. These
superpixels are most likely to contribute to
background region as compared to vertical regions.
Since a large number of superpixels are collected we
quantize them into groups by using k-means
clustering. K-means uses objective function which
minimizes a measure to find cluster center. The
objective function used is given as:
min
,…,
x
c
(3)
where
x
c
is the distance measure between a
data point x
and the cluster centre c
. The total
number of clusters is determined by the number of
superpixels in the target image to ensure that the
number of comparisons remains constant.
3.4.1 Color Contrast
Color contrast or comparison is one of most distinct
ways of highlighting a salient region. Color contrast
has been extensively used for saliency detection
(Singh et al., 2014; Goferman et al., 2010; Cheng et
al., 2011). We use average color to represent each
superpixel. The color difference between two
superpixels is given as:
Dcolsp
,sp
L
a
b
(4)
where, Dcolsp
,sp
is color difference between
superpixel sp
and superpixel sp
. The variables
L
,a
andb
are color distance for L*a*b*
color channels respectively between superpixels sp
andsp
. The distance between centers of superpixels
is used to find the spatial or position difference:
Dpossp
,sp
x
x
y
y
(5)
where, Dpossp
,sp
is distance between centre
x
,
y
and centre x
,
y
of superpixels sp
and sp
.
We incorporate geometric context by computing
two sets of maps for sky and ground context. A
superpixel dissimilarity measure can be given by
combining the above equations
D
sp
,sp
Dcolsp
,sp
1Dpossp
,sp
(6)
where, the variable D
sp
,sp
is the
geometric dissimilarity, Dcolsp
,sp
is the color
difference between superpixel i from input image
and superpixel sp
from similar images with gc∈
sky,ground. The variable Dpossp
,sp
is the
Input Verticals Ground Sky GT
SaliencyDetectionusingGeometricContextContrastInferredfromNaturalImages
613
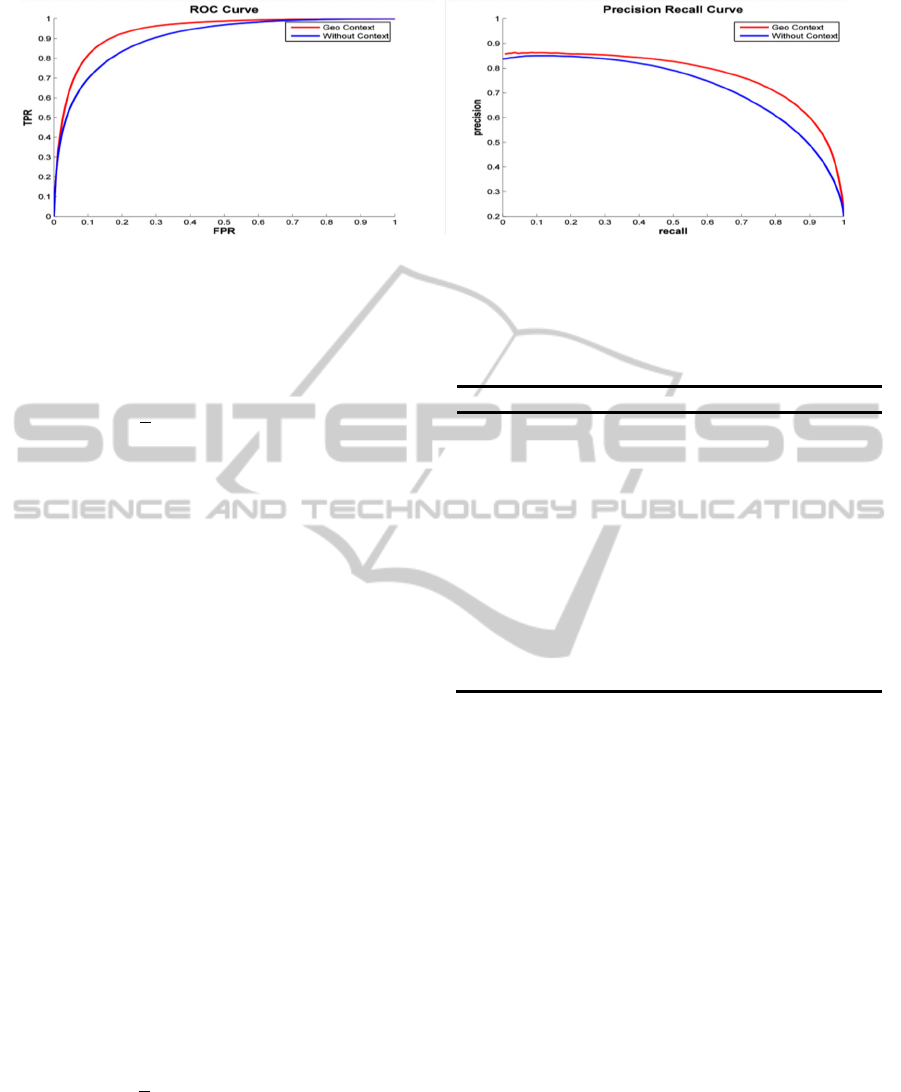
a: ROC curve.
b: Precision Recall curve.
Figure 6: Geometric context gives better result than baseline average color.
position difference between superpixel centres.
Aggregated dissimilarity is given as
Gsp
1
n
dsp
,sp
(7)
where, the variable Gsp
is aggregated dissimilarity
measure for superpixel i, n is the number of
superpixels and dsp
,sp
is local geometric
dissimilarity measure. Final map is given as an
average of maps
sal
w
∗sal
w
∗sal
(8)
where, sal
is the average saliency map and
sal
and sal
are the saliency map found
using sky and ground geometric context. The
weights w
and w
are set at 0.5.
3.4.2 Normalization Step
Every saliency map will have low-level responses as
some regions attract less attention. Our approach
focuses on salient object highlighting we would like
to suppress the low level responses associated with
non-salient regions. These low level responses are
associated with non object regions which affects the
connectedness of the saliency map. Normalization is
achieved using objectness measure. The objectness
measure gives a measure of occurrence of generic
object in a scene. Finally the saliency map is
normalized using objectness as follows
salNorm
1
2
sal
objectness
(9)
where, salNorm
is the normalized saliency value
and sal
is final saliency value and objectness
is
objectness map value for superpixel i.
4 EXPERIMENTS
Algorithm 1. Saliency Detection
1. Divide the image into superpixels
2. Find N similar natural images
a. Compute GIST descriptor
b. Rank and Retrieve Images
3. Compute features for similar images and input
image
4. Quantize the background superpixels using k-
means
5. Compute saliency detection for image vs sky
and image vs ground
6. Normalization for suppressing low-level
responses
Implementation: Algorithm 1 shows the steps for
computing saliency map. Implementation of our
saliency detection was done in C++ using the
OpenCV library. Superpixels were generated using
publically available code by (Veksler et al., 2010).
We use the respective authors’ implementations for
objectness (Alexe et al., 2012), geometric context
(Hoiem et al., 2005), GIST descriptors (Oliva and
Torralba, 2001) and scene category (Xiao et al.,
2010).
Data Set: We test our algorithm on the ASD
data set (Achanta et al., 2008), which has 1000
images, each with an unambiguous salient object.
The ground truth was generated by labelling only
one salient object in the image.
Evaluation: We perform quantitative
evaluations to shows (i) geometric context for sky
and ground gives better results than verticals
context, (ii) geometric context gives better
performance than average color and (iii) our method
outperform other state of art methods.
Evaluation metrics are consistent for all three
sets of experiment and we use benchmark code
VISAPP2015-InternationalConferenceonComputerVisionTheoryandApplications
614

7a: ROC curve.
7b: Precision Recall curve.
Figure 7: Comparisons of our method (“ours”) with other state-of-the-art methods (see Table 1) using the ROC and the
Precision Recall curves.
Input Ours CA AC HC GB IT SR GT
Figure 8: Visual comparisons of our results (“ours”) with other state-of-the-art methods. See Table 1 for method references.
given by (Borji et al., 2012). We use ROC curve
where area under the curve shows how well the
saliency algorithm predicts against the ground truth.
Precision is defined as the ratio of salient object
detected to ground truth thus higher the precision the
more the saliency map overlaps with the ground
truth while recall quantifies the amount of ground-
truth detected.
Background Context Evaluation: The ROC
curve in Figure 5b and the precision-recall curve in
Figure 5c as well as the visual comparison in Figure
5a show that background context (sky, ground) gives
better results than vertical context.
Geometric Context vs Average Color
Evaluation: The ROC curve in Figure 6a and the
precision-recall curve in Figure 6b show that use of
geometric context improves results over baseline
average color.
Table 1: Saliency detection methods for comparison.
Method
Reference
IT (Itti et al.,1998)
SR
(
Hou et al., 2007
)
MZ (Ma et al., 2003)
AC (Achanta et al, 2008)
CA (Goferman et al., 2010)
GB (Harel et al., 2007)
HC (Cheng et al., 2011)
FT (Achanta et al, 2009)
SaliencyDetectionusingGeometricContextContrastInferredfromNaturalImages
615

Comparison to State-of-the-art Methods: In
order to compare our work we use ROC curve
(Figure 7a), precision-recall curve (Figure 7b) and
visual comparison (Figure 8) with other saliency
detection methods (Table 1).
From the comparison result we can
quantitatively establish that our methods out-
perform other methods.
5 CONCLUSIONS
We present a novel method of detecting saliency
using geometric context derived from a large
collection of natural images. We give new direction
for highlighting salient region by deriving
background context from similar images. We
experimentally show that our method out performs
other state of art methods.
For future work we would like to include
attribute based information in extracting background
features along with attribute matching for image
segments.
ACKNOWLEDGMENTS
The authors thank the reviewers for their
suggestions. This work was supported in part by the
Louisiana Board of Regents through grant no.
LEQSF (2011-14)-RD-A-28.
REFERENCES
Achanta, R., Estrada, F., Wils, P., and S¨usstrunk, S.,
2008. Salient region detection and segmentation. In
ICVS, pp 66–75.
Achanta, R., Hemami, S., Estrada, F., and S¨usstrunk, S.,
2009. Frequency-tuned salient region detection. In
IEEE CVPR, pp 1597–1604.
Alexe, B., Deselaers, T., and Ferrari, V., 2012. Measuring
the objectness of image windows. IEEE Transactions
on PAMI, vol. 34, no. 11, pp. 2189-2202.
Borji, A., Sihite, D.N., and Itti, L., 2012. Salient object
detection: A benchmark. In ECCV, pp. 414-429.
Chang, K-Y., Liu, T-L., and Lai, S-H., 2011. From co-
saliency to co-segmentation: An efficient and fully
unsupervised energy minimization model. In IEEE
CVPR, pp. 2129-2136.
Cheng, M.-M., Zhang, G.-X., Mitra, N.J., Huang, X., and
Hu, S.-M., 2011. Global contrast based salient region
detection. In IEEE CVPR, pp.409-416.
Goferman, S., Zelnik-Manor, L., and Tal, A., 2010.
Context-aware saliency detection. In IEEE CVPR, pp.
2376-2383.
Harel, J., Koch, C., and Perona, P., 2007. Graph-Based
Visual Saliency. In NIPS, pp. 545-552.
Hoiem, D., Efros, A.A., and Hebert, M., 2005. Geometric
context from a single image, In IEEE ICCV, vol. 1, pp.
654-661.
Hou, X., and Zhang, L., 2007. Saliency detection: A
spectral residual approach. In IEEE CVPR, pages 1–8.
Huazhu. F., Xiaochun, C., Zhuowen, T., 2013. Cluster-
based co-saliency detection. IEEE Transactions on
Image Processing, vol.22, no.10, pp.3766-3778.
Hyvärinen, A., Hurri, J., and Hoyer, P. O., 2009. Natural
Image Statistics: A Probabilistic Approach to Early
Computational Vision, Springer-Verlag, London.
Itti, L., Koch, C., and Niebur, E., 1998. A model of
saliency-based visual attention for rapid scene
analysis. IEEE Transactions on PAMI, vol 20, no 11,
pp. 1254–1259.
Jacobs, D. E., Goldman, D.B., and Shechtman E., 2010.
Cosaliency: Where people look when comparing
images. In ACM UIST, pp. 219-228.
Li, X., Lu, H., Zhang, L., Ruan, X., and Yang, M-H.,
2013. Saliency detection via dense and sparse
reconstruction. In IEEE ICCV, pp. 2976-2983.
Ma, Y.-F., and Zhang, H.-J., 2003. Contrast-based image
attention analysis by using fuzzy growing. In ACM
Multimedia, pages 374–381.
Mukherjee, L., Singh, V., Dyer, C.R., 2009. Half-
integrality based algorithms for cosegmentation of
images. In IEEE CVPR
, pp.2028-2035.
Oliva, A., and Torralba, A., 2001. Modeling the shape of
the scene: a holistic representation of the spatial
envelope. IJCV, 42:145–175.
Singh, A., Chu, C.H., and Pratt, M.A., 2014.
Multiresolution superpixels for visual saliency
detection. In IEEE CIMSIVP.
Sun, J., and Ling, H., 2013. Scale and object aware image
thumbnailing. International Journal of Computer
Vision, vol. 104, no. 2, pp. 135-153.
Torralba, A., 2003. Contextual priming for object
detection. IJCV, vol 53, no 2, pp. 169-191.
Toshev, A., Shi, J., and Daniilidis, K., 2007. Image
matching via saliency region correspondences. In
IEEE CVPR, pp.1-8.
Veksler, O., Boykov, Y., and Mehrani, P., 2010.
Superpixels and supervoxels in an energy optimization
framework. In ECCV, pp. 211-214.
Xiao, J., Hays, J., Ehinger, K.A., Oliva, A., and Torralba,
A., 2010. SUN database: Large-scale scene
recognition from abbey to zoo. In IEEE CVPR, pp.
3485-3492.
Zhai, Y., and Shah, M., 2006. Visual attention detection in
video sequences using spatiotemporal cues. In ACM
Multimedia, pages 815–824.
VISAPP2015-InternationalConferenceonComputerVisionTheoryandApplications
616
