
Patch-based Statistical Performance Analysis of Upsampling for Precise
Super–Resolution
Djamila Aouada, Kassem Al Ismaeil and Bj
¨
orn Ottersten
Interdisciplinary Centre for Security, Reliability, and Trust, University of Luxembourg, Luxembourg, Luxembourg
Keywords:
Super-resolution, Affine Bias Model, UP-SR, MSE, Depth Camera, Patch-based.
Abstract:
All existent methods for the statistical analysis of super–resolution approaches have stopped at the variance
term, not accounting for the bias in the mean square error. In this paper we give an original derivation of the
bias term. We propose to use a patch-based method inspired by the work of (Chatterjee and Milanfar, 2009).
Our approach, however, is completely new as we derive a new affine bias model dedicated for the multi-frame
super resolution framework. We apply the proposed statistical performance analysis to the Upsampling for
Precise Super–Resolution (UP-SR) algorithm. This algorithm was shown experimentally to be a good solution
for enhancing the resolution of depth sequences in both cases of global and local motions. Its performance
is herein analyzed theoretically in terms of its approximated mean square error, using the proposed derivation
of the bias. This analysis is validated experimentally on simulated static and dynamic depth sequences with
a known ground truth. This provides an insightful understanding of the effects of noise variance, number
of observed low resolution frames, and super–resolution factor on the final and intermediate performance of
UP–SR. Our conclusion is that increasing the number of frames should improve the performance while the
error is increased due to local motions, and to the upsampling which is part of UP-SR.
1 INTRODUCTION
Multi–frame super–resolution (SR) is an inverse im-
age reconstruction problem. It consists in estimating
a high resolution (HR) reference image from multi-
ple observed low resolution (LR) frames (Milanfar,
2010), where the ratio between HR and LR is known
as the SR factor. Depth sensors of limited resolu-
tions, such as the 3D MLI by IEE S.A. of resolution
(56 ×64) (3d MLI, 2014) and the PMD camboard
nano of resolution (120×160) (pmd CamBoard nano,
2014), are good examples of current technologies that
could benefit from the multi-frame SR framework.
There have been some attempts to derive the
asymptotic limits of SR (Rajagopalan and Kiran,
2003; Robinson and Milanfar, 2006). Those, how-
ever, do not consider the bias of an SR estimator de-
spite it being always part of an image reconstruction
solution (Chatterjee and Milanfar, 2009). Moreover,
they assume a Gaussian noise model while UP-SR ex-
ploits an additive Laplace noise model.
Recently, Al Ismaeil et al. (K. Al Ismaeil, 2013a)
proposed a new multi-frame SR approach for the en-
hancement of static depth scenes captured with these
cameras. In (K. Al Ismaeil, 2013b), the authors have
extended this work to dynamic depth scenes subject
to local motions, i.e., scenes containing one or more
moving objects. This algorithm is referred to as Up-
sampling for Precise Super-Resolution (UP-SR). It is
based on upsampling the observed LR frames prior
to their registration. This has led to rewriting the
general SR data model to a simplified image denois-
ing problem from multiple noisy and blurred observa-
tions. The denoising is then achieved using a Maxi-
mum Likelihood (ML) approach. In both (K. Al Is-
maeil, 2013a) and (K. Al Ismaeil, 2013b) the perfor-
mance of UP-SR was characterized experimentally.
In this paper, in order to reach a better understand-
ing of this algorithm, and to separate the effect of the
number of frames and the effect of the SR factor, we
derive its performance in terms of mean square er-
ror (MSE) at a given noise level. The MSE is com-
posed of a variance and a bias term. We propose to
adapt to the considered problem the affine bias model
of (Chatterjee and Milanfar, 2009) based on a repre-
sentation with patches, leading to an approximation
of the UP-SR bias. This bias is related to the error
due to gradient-based motion estimation (Robinson
and Milanfar, 2003), and to the SR factor used in UP-
SR as the upsampling factor. Few assumptions are
186
Aouada D., Al Ismaeil K. and Ottersten B..
Patch-based Statistical Performance Analysis of Upsampling for Precise Super–Resolution.
DOI: 10.5220/0005316001860193
In Proceedings of the 10th International Conference on Computer Vision Theory and Applications (VISAPP-2015), pages 186-193
ISBN: 978-989-758-089-5
Copyright
c
2015 SCITEPRESS (Science and Technology Publications, Lda.)

introduced for simplicity of analysis but are shown
to still hold experimentally, both quantitatively and
qualitatively. We give the variance of the UP-SR esti-
mator considering an additive Laplacian noise model
as it has been shown to better fit the SR problem as
compared to a Gaussian noise model (S. Farsiu, 2003;
S. Farsiu, 2004).
The remainder of the paper is organized as fol-
lows: Section 2 reviews the UP-SR estimation. An
approximation of the corresponding MSE is derived
in Section 3. Quantitative and qualitative results con-
firming the theoretical performance analysis are given
in Section 4. The conclusion is given in Section 5.
2 UPSAMPLING FOR PRECISE
SUPER RESOLUTION (UP-SR)
The dynamic multi–frame SR problem considers a
sequence of N observed LR column images {y
t
, t =
1, ··· , N}of size m. The objective is to reconstruct the
corresponding HR sequence {x
t
, t = 1, ··· , N} con-
taining images of size n such that n = r ×m, with r
being the SR factor. The dynamic SR problem may
be simplified by reconstructing one HR image at a
time using the full observed sequence. To that end,
we fix the reference time to t
0
, and focus on the re-
construction of x
t
0
using the N
0
= (N −t
0
+1) preced-
ing measurements. The operation may be repeated for
t
0
= 1, ··· , N. A noisy LR observation is modeled as
follows:
y
t
= DHM
t
t
0
x
t
0
+ n
t
, t
0
≤t and t, t
0
∈ [1, N] ⊂ N
∗
,
(1)
where D is a known constant downsampling matrix
of dimension (m ×n). The system blur is represented
by the time and space invariant matrix H. The (n ×n)
matrices M
t
t
0
correspond to the motion between x
t
0
and y
t
before their downsampling. Without loss of
generality, both H and M
t
t
0
are assumed to be block
circulant matrices. The additive noise vector n
t
at
time t follows a white multivariate Laplace distribu-
tion (S. Farsiu, 2003) defined as:
p(n
t
) =
m
∏
i=1
√
2
2σ
exp
−
√
2|n
t
(i)|
σ
!
, (2)
where
σ
√
2
is a positive Laplace scale factor leading
to the diagonal covariance matrix Σ = σ
2
I
m
, with I
m
being the identity matrix of size (m ×m).
The UP-SR algorithm starts be upsampling the ob-
served LR images. This leads to a more accurate
and robust motion estimation which enhances the reg-
istration of frames. Moreover, it allows to directly
solve the problem of undefined pixels in the SR ini-
tialization phase (K. Al Ismaeil, 2013b). We define
the resulting r-times upsampled image as y
t
↑= U ·y
t
,
where U is an (n ×m) upsampling matrix. Due to the
specifications of depth data, classical interpolation–
based methods (e.g., bicubic) cannot be used as they
lead to jagged values and to blurring effects especially
for boundary pixels. Thus, the upsampling U has to
be dense, which is also known as nearest neighbor up-
sampling.
Two consecutive frames are better registered if the
motion between them is estimated from their upsam-
pled versions y
t−1
↑ and y
t
↑, by finding
ˆ
M
t
t−1
= arg min
M
Ψ(y
t−1
↑, y
t
↑, M) , (3)
where Ψ is a dense optical flow-related cost function
and
y
t
↑= M
t
t−1
y
t−1
↑ +v
t
. (4)
The vector v
t
contains the innovation that we assume
negligible in this framework. In addition, similarly
to (Elad and Feuer, 1999), for analytical convenience,
we assume that all pixels in y
t
↑ originate from pixels
in y
t−1
↑ in a one to one mapping. Therefore, each
row in M
t
t−1
contains 1 for each position correspond-
ing to the address of the source pixel in y
t−1
↑. This
bijective property implies that the matrix
ˆ
M
t
t−1
is an
invertible permutation, s.t., [
ˆ
M
t
t−1
]
−1
=
ˆ
M
t−1
t
. Fur-
thermore, its estimate leads to the following registra-
tion to y
t−1
:
y
t
↑=
ˆ
M
t−1
t
y
t
↑ . (5)
Using a cumulative motion compensation approach,
the registration of a non-consecutive frame y
t
↑ to the
reference y
t
0
↑ is achieved as follows:
y
t
0
t
↑=
ˆ
M
t
0
t
y
t
↑=
ˆ
M
t
0
t
0
+1
···
ˆ
M
t−1
t
| {z }
(t −t
0
) times
·y
t
↑ . (6)
Choosing the upsampling matrix U to be the transpose
of D, the product UD = A, gives a block circulant
matrix A that defines a new blurring matrix B = AH.
Considering that B and M
t
t
0
are block circulant matri-
ces, we have BM
t
0
t
= M
t
0
t
B. As a result, the estima-
tion of x
t
0
may be decomposed into two steps; estima-
tion of a blurred HR image z
t
0
= Bx
t
0
, followed by a
deblurring step. The data model in (1) becomes
y
t
0
t
↑= z
t
0
+ ν
t
, t
0
≤t and t, t
0
∈ [1, N] ⊂ N
∗
, (7)
where ν
t
=
ˆ
M
t
0
t
U ·n
t
is an additive noise vector of
length n. The permutation
ˆ
M
t
0
t
only reorders the el-
ements of n
t
while U leads to replicating each el-
ement r times. This results in a new (n × n) co-
variance matrix with a non-diagonal structure
˜
Σ =
ˆ
M
t
0
t
UΣD
ˆ
M
t
t
0
. For simplicity of analysis, we will
Patch-basedStatisticalPerformanceAnalysisofUpsamplingforPreciseSuper-Resolution
187

however assume an independent and identically dis-
tributed (i.i.d.) Laplace random vector with
˜
Σ = σ
2
I
n
.
The error due to this simplification is a blurring ef-
fect that should be largely reduced in the deblurring
step. The log-likelihood function associated with (7)
becomes
ln p(y
t
0
t
0
↑, ··· , y
t
0
N
↑ | z
t
0
) =
= ln
N
∏
t=t
0
√
2
2σ
exp
−
√
2ky
t
0
t
↑ −z
t
0
k
1
σ
!!
= −N
0
ln
σ
√
2
−
√
2
σ
N
∑
t=t
0
kz
t
0
−
y
t
0
t
↑ k
1
,
(8)
where k·k
1
is the L
1
–norm. Maximizing (8) with re-
spect to z
t
0
, we obtain
ˆ
z
t
0
= arg min
z
t
0
N
∑
t=t
0
kz
t
0
−y
t
0
t
↑ k
1
, (9)
which corresponds to the pixel-wise temporal median
estimator, i.e.,
ˆ
z
t
0
= med
t
{y
t
0
t
↑}
N
t=t
0
.
Then, as a second step, follows an image deblurring
to recover
ˆ
x
t
0
from
ˆ
z
t
0
. Considering a regularization
term Γ(x) added to compensate undetermined cases
by enforcing prior information about x
t
0
, we finally
find
ˆ
x
t
0
= argmin
x
kBx −
ˆ
z
t
0
k
1
+ λΓ(x)
, (10)
where λ is the regularization parameter.
3 STATISTICAL PERFORMANCE
ANALYSIS
Considering the data model in (7), we herein look into
the performance of the median estimator
ˆ
z
t
0
in terms
of MSE with respect to the SR factor r and the num-
ber of frames N
0
. The MSE may be decomposed into
two parts, the variance var(·) and the bias denoted as
bias(·). Given a known ground truth x
t
0
, we have
MSE(
ˆ
z
t
0
, x
0
) = var(
ˆ
z
t
0
) + kbias (
ˆ
z
t
0
)k
2
. (11)
Below, we detail the computation of each term.
3.1 Bias Computation
The SR problem has been reformulated as a denoising
problem in (7). The affine bias model of Chatterjee
and Milanfar (Chatterjee and Milanfar, 2009) for im-
age denoising may therefore be applied after modifi-
cations to fit the estimation in (9). This model is local
where processing is done on patches. We start by de-
composing the ground truth image x
t
0
into n patches
{q
t
0
(i), i = 1, ··· , n}. Each patch q
t
0
(i) is centered at
the pixel x
t
0
(i) and is chosen to be of the size of the
upsampling factor r. Similarly, y
t
0
t
↑ are decomposed
into n overlapping patches {p
t
(i), i = 1, ···, n}. The
data model (7) can be rewritten for patches as:
p
t
(i) = q
t
0
(i) + η
t
(i), (12)
where η
t
(i) is the patch measurement error due to
noise and to blur. Relating patches from frames at
different times leads to rewriting (4) but between any
two frames at t and t
0
as:
p
t
0
(i) = W
t
0
t
(i)p
t
(i) + w
t
0
t
(i), (13)
where W
t
0
t
(i) is a sub-block of
ˆ
M
t
0
t
centered at posi-
tion i, and w
t
t
0
(i) is a local innovation directly related
to cumulated innovations neglected in (4). The esti-
mation in (9) corresponds to locally selecting the el-
ement p
t
0
(i) with the highest ranking among the N
0
patches {p
t
(i), t = t
0
, ··· , N} as the estimate
ˆ
q
t
0
(i).
Thus, by combining (12) and (13), we may write
ˆ
q
t
0
(i) = W
t
0
t
0
(i)
q
t
0
(i) + η
t
0
(i)
+ w
t
0
t
0
(i) (14)
Therefore, given the expectation operator E(·) and I
r
the identity matrix of size (r ×r), the local bias per
patch can be calculated as:
bias(
ˆ
q
t
0
(i)) = E (
ˆ
q
t
0
(i)) −q
t
0
(i)
=
E
W
t
0
t
0
(i)
−I
r
q
t
0
(i) + E
W
t
0
t
0
(i)η
t
0
(i) + w
t
0
t
0
(i)
= S
i
q
t
0
(i) + u
i
.
(15)
The result in (15) is a local affine model inspired by,
but different from, the model in (Chatterjee and Mi-
lanfar, 2009). The final bias is
kbias(
ˆ
z
t
0
)k
2
=
n
∑
i=1
kbias(
ˆ
q
t
0
(i))k
2
. (16)
It is interesting to note that for the simple case where
the average motion per patch as well as its innovation
w
t
0
t
0
(i) are close to zero, the expected value of the ma-
trix of local motion is close to the identity matrix, i.e.,
E
W
t
0
t
0
(i)
≈ I
r
, and S
i
becomes a zero matrix. The
per–patch bias term becomes E (η
t
(i)) which repre-
sents the combined effect of blur and noise per patch.
The statistical properties of the noise part are the same
as those of ν
t
, i.e., of zero mean. The blur part is due
to the (r −1) pixels per patch that resulted from dense
upsampling. Assuming that they induce a fixed mean
error ε, the total bias may be simplified as follows:
kbias(
ˆ
z
t
0
)k
2
=
n
∑
i=1
kE (η
t
(i))k
2
= n ·(r −1)ε
2
. (17)
VISAPP2015-InternationalConferenceonComputerVisionTheoryandApplications
188
Note that in (17), for r = 1, there is no blur due to
upsampling, and the UP-SR estimation becomes un-
biased. In the general case, however, the bias term
is data dependent because of q
t
0
(i) in (15). It also
depends of the SR factor r, and the statistics of the
local motions and noise. We note that the bias is pro-
portional to the squared SR factor r
2
and to the im-
age size n. These results are also data dependent as
expressed by the pixel values p
k
(i) and the structural
decomposition of an image to patches. As can be seen
next, the variance term is proportional to the noise
variance σ
2
and the number of measurements N
0
.
3.2 Variance Computation
Assuming an i.i.d. n–multivariate Laplace distribu-
tion, we may write: var(
ˆ
z
t
0
) = tr (cov(
ˆ
z
t
0
)) = n ·
var(
ˆ
z
t
0
(i)), where tr(·) and cov(·) are the trace and
covariance functions, respectively. Therefore, using
the result of (Beaulieu and Jiang, 2010), we find
var(
ˆ
z
t
0
(i)) = 2σ
2
f (N
0
), i = 1, ··· , n, (18)
where for N
0
even,
f (N
0
) =
4N
0
!
N
0
−1
2
!
2
1
2
N
0
+1
2
N
0
−1
2
∑
k=0
N
0
−1
2
k
−
1
2
k
(N
0
+ 1 + 2k)
3
,
(19)
and for N
0
odd,
f (N
0
) =
N
0
!
N
0
2
!
N
0
2
−1
!
1
2
N
0
2
1
N
03
1
2
N
0
2
+
N
0
2
−1
∑
k=0
N
0
−1
2
k
−
1
2
k
7N
02
+ 8N
0
(k + 1) + 4(k + 1)
2
N
02
(N
0
+ 2k + 2)
3
.
(20)
We note that in addition to assuming that the noise is
i.i.d., we also assume that the effect of overlapping
patches is expressed in the bias term. Thus, the vari-
ance is independent of r, which means that it is the
same for a simple denoising operation where no SR is
involved and r = 1.
4 EXPERIMENTAL VALIDATION
In order to illustrate the statistical analysis of the UP-
SR algorithm with quantitative evaluation, we set up
the following experiment. We use the publicly avail-
able toolbox V-REP (V-REP, 2014) to create synthetic
data with fully known ground truth for both dynamic
and static scenes, Figure 1 (a), and Figure 1 (b), re-
spectively. Three depth cameras with the same field
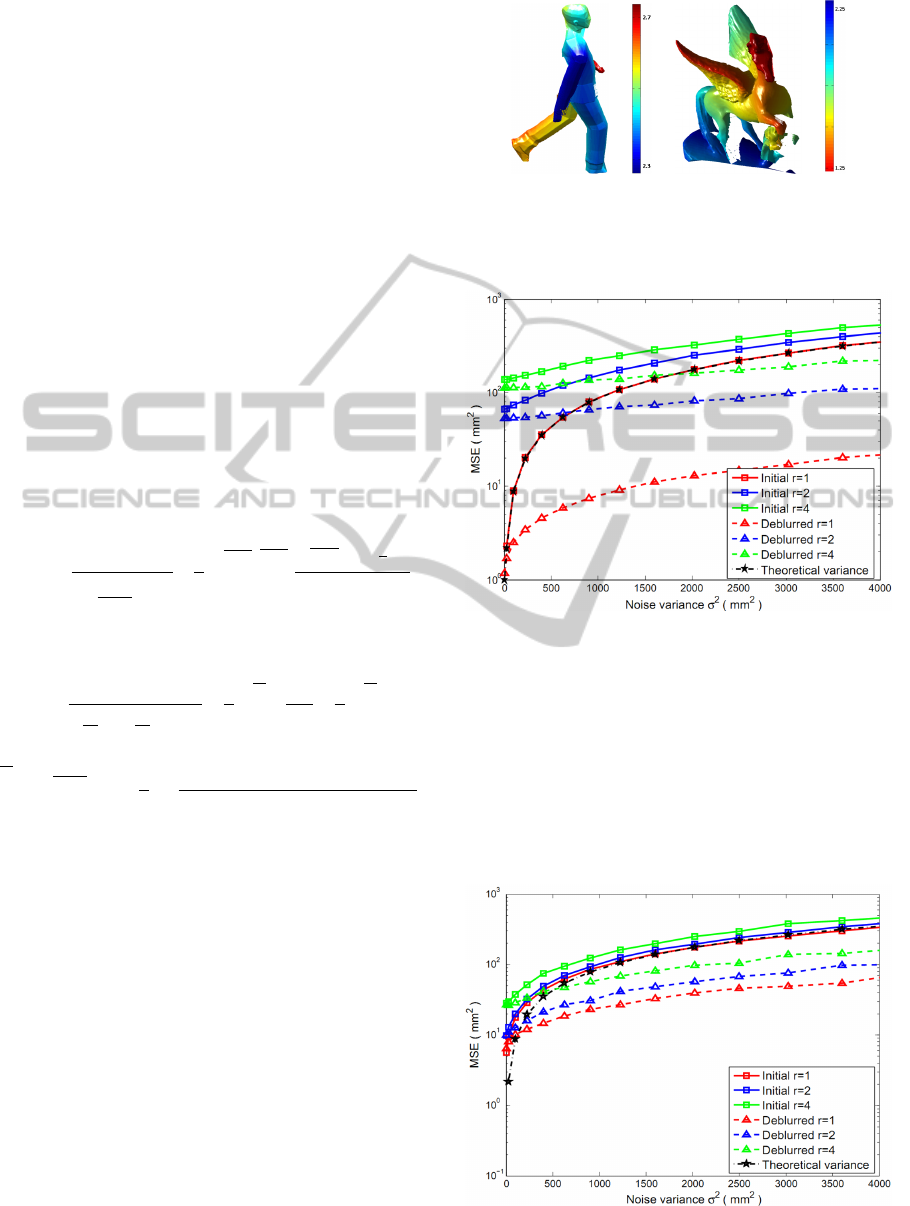
(a) (b)
Figure 1: Ground truth data used for the statistical perfor-
mance analysis. (a) Dynamic scene with a moving person,
(b) Static scene.
Figure 2: MSE of UP–SR versus noise variance for the
static scene in Figure 1 (b).
of view are fixed at the same position. These cam-
eras are of different resolutions, namely, (512 ×512),
(256 ×256), and (128 ×128) pixels. They are used
to capture three sequences for each subject. These se-
quences are further degraded with additive Laplacian
noise with a standard deviation σ varying from 0 mm
to 60 mm. Each sequence is super-resolved using UP-
SR by considering 9 successive frames.
Figure 3: MSE of UP–SR versus noise variance for the dy-
namic scene in Figure 1 (a).
Patch-basedStatisticalPerformanceAnalysisofUpsamplingforPreciseSuper-Resolution
189
(a) (b)
(c)
(d)
(e)
(f)
(g)
(h) (i)
(j)
(k) (l)
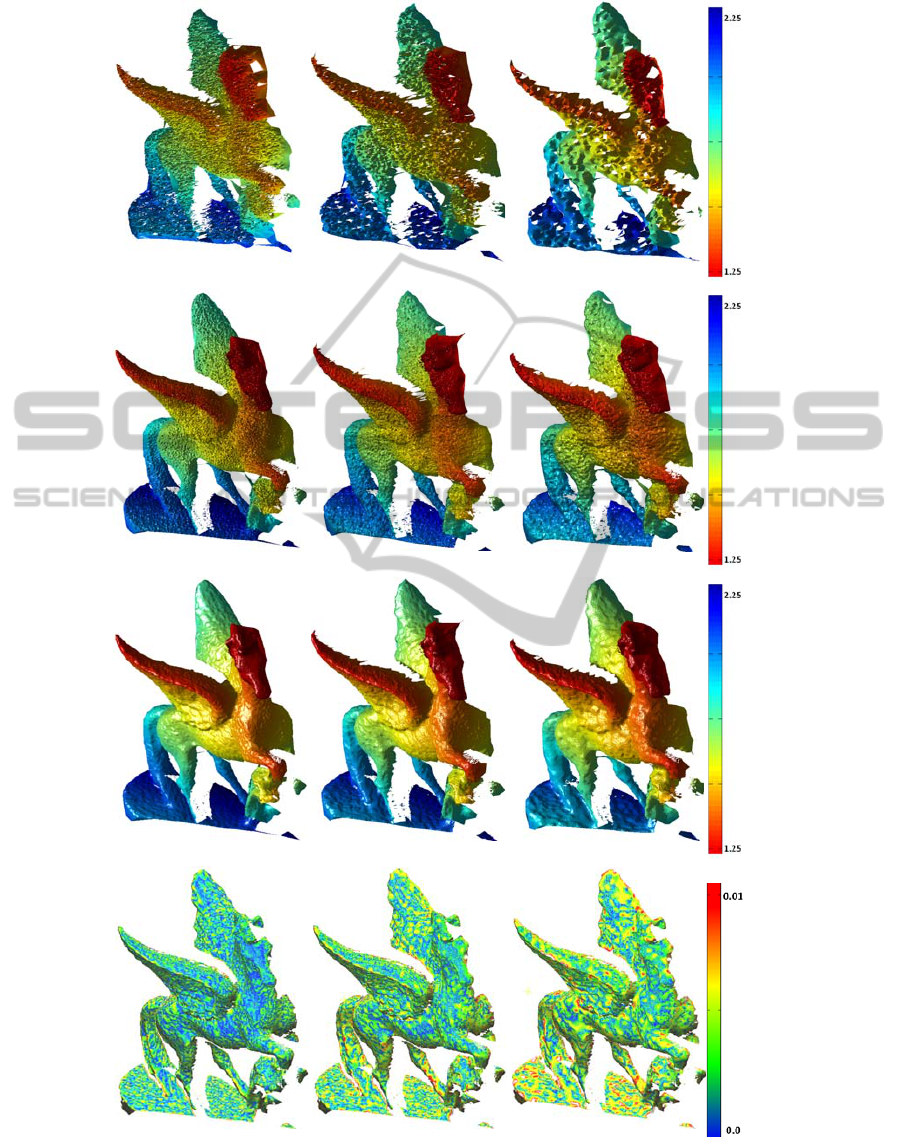
Figure 4: Statistical performance analysis of UP-SR for static depth scenes. First, second and third columns correspond
respectively to r = 1, r = 2, and r = 4 where (a), (b) and (c) are the noisy LR observations; (d), (e), and (f) are the result of
the Initial of UP-SR; (g), (h), and (i) are the result of deblurring step of UP-SR. The corresponding error maps as compared
with the ground truth Figure 1. (b) are given in (j), (k), and (l).
VISAPP2015-InternationalConferenceonComputerVisionTheoryandApplications
190
(a) (b) (c)
(d) (e) (f)
(g)
(h) (i)
(j)
(k) (l)
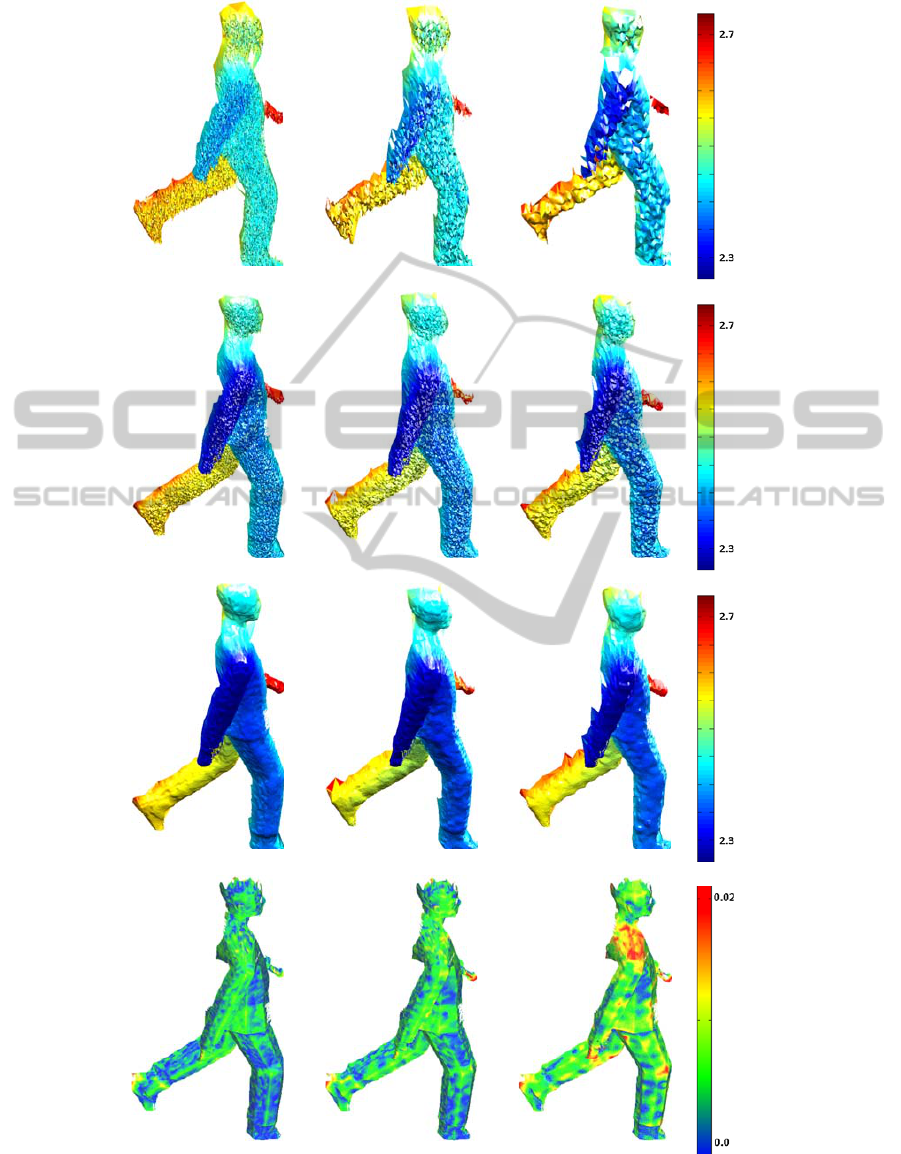
Figure 5: Statistical performance analysis of UP-SR for dynamic depth scenes. First, second and third columns correspond
respectively to r = 1, r = 2, and r = 4 where (a), (b) and (c) are the noisy LR observations; (d), (e), and (f) are the result of
the initialization step of UP-SR; (g), (h), and (i) are the result of the deblurring step of UP-SR. The corresponding error maps
as compared with the ground truth Figure 1. (a) are given in (j), (k), and (l).
Patch-basedStatisticalPerformanceAnalysisofUpsamplingforPreciseSuper-Resolution
191

Starting with the static case, the corresponding
MSE performance of the initialization step and the
second deblurring step of UP-SR are reported in Fig-
ure 2 in solid and dashed lines, respectively. In the
simple case where r = 1, the SR resolution problem is
merely a denoising one where the ground truth is es-
timated from 9 noisy measurements. In other words,
the objective is not to increase resolution, and hence
there is no blur due to upsampling. Indeed, as seen in
Figure 2, the solid red line overlaps with the dashed-
dotted black line which corresponds to the theoretical
variance for the odd case obtained using (20). A non-
zero bias is found for r = 2 and r = 4 where the cor-
responding blue and green solid lines are above the
theoretical variance. This suggests a correlation be-
tween motion and upsampling blur as expressed by
the vector u
i
in (15). We note an increased bias for
a larger SR factor r. This is justified by a larger blur
effect due to the dense upsampling and to motion. Fi-
nally, the dashed lines in Figure 2 confirm the perfor-
mance enhancement after applying the optimization
in (10); thus, ensuring an effective deblurring. We
used an exhaustive search to find the best parameters
for Γ. These quantitative results can be appreciated
visually in Figure 4 where the noise level is fixed at
σ = 30 mm. The effective resolution enhancement,
with a SR factor of r = 4, and denoising power of
UP-SR for a static depth scene is seen in 3D in Fig-
ure 4 (i). The average RMSE in 3D is shown in Fig-
ure 4 (l).
In the dynamic case, a similar behaviour has been
observed with some differences related to the local
motion estimation and data type. We can see that even
for the simple case with r = 1, a non-zero bias from
the theoretical variance is found for both the initial
and optimized results, represented by the solid and
dashed red lines in Figure 3, respectively. This bias
is mainly due to the error caused by self-occlusions
and errors in registration. In the case of resolution en-
hancement with SR factors r = 2 and r = 4, we can
see that the non-zero bias in Figure 3 follows the same
behaviour as the one for the static case. The difference
is a smaller shift from the theoretical variance, espe-
cially for low noise levels as can be seen in the corre-
sponding blue and green solid lines. This is directly
related to the data type. Whereas in the dynamic case
we used a simple CAD object (Figure 1 (a)), in the
static case we used a scanned object containing more
geometric details (Figure 1 (b)). Therefore, the down-
sampling process has more effect on the static object
and leads to a larger loss in details, hence a larger bias.
5 CONCLUSION
We have proposed to adapt the affine bias model pro-
posed by (Chatterjee and Milanfar, 2009) to approxi-
mate the bias of a depth multi–frame super–resolution
algorithm using a patch–based representation. Speci-
cally, the Upsampling for Precise Super–Resolution
(UP–SR) algorithm has been considered. With an ad-
ditional step to handle the effect of downsampling,
this derived statistical analysis may be applied to any
multi–frame super–resolution algorithm. The appli-
cation to UP–SR has the advantage that it does not
need to handle downsampling separately because it
directly transfers the super–resolution problem to a
denoising one. We provided a theoretical perfor-
mance analysis of UP–SR in terms of mean square
error, including the variance and the bias terms. We
validated these results experimentally using a syn-
thetic simulation setup. This analysis gave insights
on the effect of the different parameters: noise level,
the number of observed low resolution frames, and
the super–resolution factor. In summary, the perfor-
mance of UP–SR or any multi-frame super–resolution
algorithm increases with the increase of the number of
observations. In the case of dynamic scenes, this per-
formance decreases due to local motions and errors
of registration. In the case of UP–SR, there is an ad-
ditional error due to the upsampling effect. It can be
reduced thanks to the final deblurring phase.
ACKNOWLEDGEMENT
This work was supported by the National Research
Fund (FNR), Luxembourg, under the CORE project
C11/BM/1204105/FAVE.
REFERENCES
3d MLI (2014). http://www.iee.lu/technologies.
Beaulieu, N. and Jiang, S. (2010). Ml estimation of signal
amplitude in laplace noise,. In Global Telecommuni-
cations Conference. IEEE.
Chatterjee, P. and Milanfar, P. (2009). Bias modeling for
image denoising,. In 43rd Asilomar Conference on
Signals, Systems and Computers.
Elad, M. and Feuer, A. (1999). Super-resolution reconstruc-
tion of continuous image sequences,. In Transaction
Pattern Analysis and Machine Intelligence. IEEE.
K. Al Ismaeil, D. Aouada, B. M. B. O. (2013a). Depth
super-resolution by enhanced shift & add,. In 15th In-
ternational Conference on Computer Analysis of Im-
ages and Patterns. Springer.
VISAPP2015-InternationalConferenceonComputerVisionTheoryandApplications
192

K. Al Ismaeil, D. Aouada, B. M. B. O. (2013b). Dy-
namic super-resolution of depth sequences with non-
rigid motions,. In 20th IEEE International Conference
on Image Processing. IEEE.
Milanfar, P. (2010). Super-resolution imaging,. In CRC
Press.
pmd CamBoard nano (2014). http://www.pmdtec.com/.
Rajagopalan, A. and Kiran, P. (2003). Motion-free super-
resolution and the role of relative blur,. In J. Opt. Soc.
Amer.
Robinson, D. and Milanfar, P. (2003). Bias-minimizing fil-
ters for gradient-based motion estimation,. In 37th
Asilomar Conference on Signals, Systems and Com-
puters. IEEE.
Robinson, D. and Milanfar, P. (2006). Statistical perfor-
mance analysis of super-resolution,. In Transaction
Image Processing. IEEE.
S. Farsiu, D. Robinson, M. E. P. M. (2003). Robust shift
and add approach to super–resolution,. In Interna-
tional symposium on Optical Science and Technology,
SPIE’s 48th Annual Meeting.
S. Farsiu, D. Robinson, M. E. P. M. (2004). Fast and robust
multi-frame super-resolution,. In Transaction Image
Processing. IEEE.
V-REP (2014). http://www.k-team.com/mobile-robotics-
products/v-rep.
Patch-basedStatisticalPerformanceAnalysisofUpsamplingforPreciseSuper-Resolution
193
