
A Real-time Computer Vision System for Biscuit Defect Inspection
Yu Wang
1
, Chenbo Shi
2
, Chun Zhang
2
and Qingmin Liao
1
1
Shenzhen Key Lab. of Information Sci&Tech, Shenzhen Engineering Lab. of IS&DRM,
Department of Electronic Engineering, Graduate School at Shenzhen, Tsinghua University, Beijing, China
2
Department of Electronic Engineering, Tsinghua University, Beijing, China
Keywords: Computer Vision, Biscuit Inspection, Real-time, Unfolding Image, Feature Extraction, Polarized Image.
Abstract: This paper presents a computer vision system for biscuit defects inspection which contains both hardware
and software. By utilizing the system with two cameras, we focus on the detection of biscuit partial deletion
and cream overflow. For detecting partial deletion, a new algorithm with a membership function for
calculating feature descriptor is proposed. It’s convenient and efficient to extract feature of textons. For
cream overflow detection, a chemical property of enantiomers under polarized light is made use of
distinguishing cream from background. The proposed system has been implemented on the production line.
Groups of on-line experiments show that our system can achieve accurate defect detection with low missing
detection rate and false alarm.
1 INTRODUCTION
With the development of automation in industry, the
application of on-line detective equipment which
focuses on quality detection increases in a fast
growing speed. The detection equipments achieve
the accuracy and efficiency which automated
production requires. Moreover, they can reduce the
dependence on human at the period when it’s hard to
employ labors. Computer vision plays an
increasingly important role in the field of on-line
detection. Coffee roasting is evaluated by the
changes of brightness and surface area with image
processing on-line (Hernandez, J.A. 2007). Foreign
bodies in biscuits are inspected through computer
vision by infrared thermography (Senni, L. 2014). A
real-time computer vision system is implemented to
detect defects in textile fabric (Mak, K.L. 2005).
Mondellez International is a famous food
company which produces tons of Oreo cookies
through automatic line every day. Oreo cookie
consists of three parts: two chocolate biscuits and a
piece of cream between them. One of the procedures
is to put cream on the back biscuit and put top
biscuit on the cream on line. With this procedure,
it’s easy to product defective cookies which could be
partial deletion and cream overflow. Our computer
vision system is aimed at inspecting defective
cookies which may give rise to block on automatic
line and picking them out automatically.
Oreo cookies have uniform texture on biscuit.
The biscuit border textures are either peak stripes or
valley stripes which scatter from center to edge.
Under light, the peak stripes show brighter than
valley stripes as the shadow of peak stripes falls on
valley stripes. As the partial deletion or fray always
appears from biscuit edge to center, we can judge
the biscuit is intact or not by the integrity of border
texture. Since the width and length of stripes is not
uniform strictly, the method of template matching
(Mahalak-shmi, T. 2012) (Liu, C. 2012) or Fourier
transformation is not suitable. Histogram of textons
(Hoang, M. 2005) is a kind of classic texton
descriptor. As the detected area has some other
texture besides the stripes discussed above,
histogram of textons is not effective. Co-occurrence
matrix and local binary patterns (Heikkila, M. 2006)
could not describe stripe feature. Scale-invariant
feature transform (Mikolajczyk, K. 2005) and
speeded up robust features (Herbert, B. 2008)
(Chenbo, S. 2010) are so complicated that they are
not appropriate for online inspection. In section 2,
we propose an algorithm which is to extract the
texture of biscuit to inspect partial deletion or fray.
Firstly, the ring area is unfolded to a long strip for
feature extraction. Secondly, we introduce a
membership function to calculate pixel’s label
(Perrot, N. 1996) (Johannes, A.R., 2001). Then, we
define lines and make up of feature vector with lines.
531
Wang Y., Shi C., Zhang C. and Liao Q..
A Real-time Computer Vision System for Biscuit Defect Inspection.
DOI: 10.5220/0005306705310536
In Proceedings of the 10th International Conference on Computer Vision Theory and Applications (VISAPP-2015), pages 531-536
ISBN: 978-989-758-089-5
Copyright
c
2015 SCITEPRESS (Science and Technology Publications, Lda.)
The cookies are produced on metal production line.
It’s hard to distinguish white overflow cream from
the metal background in images. Chirality is a kind
of structure characteristic for molecules. A chiral
molecule is a type of molecule which has a non-
superposable mirror image like an asymmetric
carbon atom. A chiral molecule and its non-
superposable mirror molecule are defined as
enantiomer (Mcnaught, A. D., 1997). The
preponderance of right or left hand enantiomers will
change the linearly polarized light to a net circular
birefringence.
As the cream contains enantiomers while
background metal does not, under polarized light,
the characteristic of reflected light from biscuit is
changed to a net circular birefringence. (Eugene, H.,
2002) (Vollhardt, K. P. C., 2003). When we put a
polaroid ahead of camera, the reflected light from
cream will filter through polaroid while the reflected
light from metal won’t. We design a set of optical
device which consists of two cameras to detect
overflow cream and partial deletion respectively.
2 BISCUIT PARTIAL DELETION
INSPECTION ALGORIGHM
2.1 Unfolding the Ring Area
Partial deletion of biscuit usually appears at the
border of biscuit. The inspection of partial deletion
can be simplified by unfolding biscuit border. To get
an unfolded region of biscuit border, two steps are
needed as follows: firstly, biscuit has to be located
accurately; secondly, the region of biscuit border
should be unfolded to a long stripe.
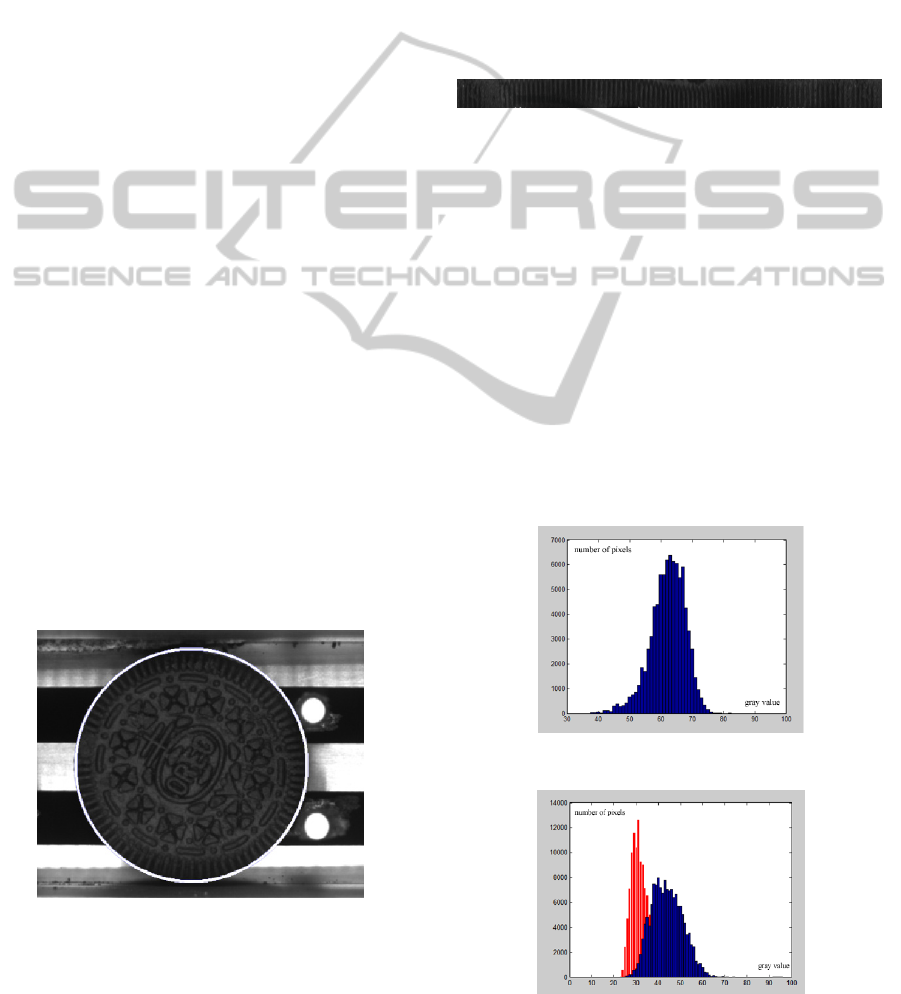
Figure 1: The result of locating cookies.
In our method, we use random sample consensus
(RANSAC) (Hossam, I. 2012) (Shi, C. 2012) to
calculate biscuit’s center and radius. Since the value
of biscuit edge is much lower than the value of
metal, we select 200 pixels from the edge of biscuit
after thresholding the original image. The location
result is shown in Fig.1. According to the result of
locating, a ring area from the edge to inside part is
unfolded to a long strip to form a new image.
In order to get a clear image efficiently, trilinear
interpolation is applied to unfold the ring area. We
unfold 390 degrees of the ring region to avoid
truncation defects in the new image. The unfolded
image is shown in Fig.2. We define the unfolded
image as a region of interest (ROI) for feature
extraction.
Figure 2: The unfolded image of ring area.
2.2 A Membership Function for Pixels
By observing the unfolded image, it’s obvious that
gray values of biscuit pixels are not uniform except
for the influence of light. One of the reasons is that
biscuit is made up of flour, chocolate and sugar
which won’t be uniform completely. With an
experiment, we can get a distribution of pixel values
without texture which is shown in Fig.3. However,
the main reason for the difference of pixel values is
the shadow caused by peak stripes and valley stripes
on biscuit. So from Fig.2, we can find the texture
which bright stripes alternate dark stripes clearly.
The distribution frequency of dark and bright stripe
pixel values is shown in Fig.4.
Figure 3: the histogram plot of biscuit without texture.
Figure 4: the histogram plot of dark and bright stripes.
VISAPP2015-InternationalConferenceonComputerVisionTheoryandApplications
532

In Fig.4, the red part is the distribution of dark stripe
pixel values and the blue part is the distribution of
bright stripe pixel values. For each pixel value, we
can calculate the probability belong to dark stripes
or bright stripes with the distribution of pixel values.
However in order to process efficiently, we use a
segmented function to fit the distribution of
possibility approximately. We call the segmented
function as a membership function. And the
probability is considered as a membership for bright
or dark. The membership function can be expressed
as:
0()
() () ( )
1()
L
wLH
H
x
T
Tx ax T x T
x
T
(1)
where
H
T denotes the middle value of bright stripe
pixel values and
L
T
represents the middle value of
dark stripe pixel values.
()
w
Tx
is the membership
to dark strip. While
()ax
can be calculated
according to following equation:
round(10 ) 5%
()
()
round(10 10 ) 5%
()
L
LM
ML
M
M
H
HM
xT
TxT
TT
ax
xT
TxT
TT
(2)
where
H
T
and
L
T
are same as the variables in
Eq.(1).
M
T
is the middle value in which the
number of dark stripe pixels is equal to the number
of bright stripe pixels.
round()
is a round function.
With the membership to dark strip, we can calculate
the membership to bright strip as follows:
() 1 ()
bw
Tx Tx
(3)
where
()
w
Tx
can be calculated by Eq.(1).
()
b
Tx
is the membership to bright strip.
2.3 Feature Extraction for ROI
With the membership of each pixel, we propose a
method of feature extraction in ROI for partial
deletion inspection. Continuous pixels in a column
are defined as a line. For texture part of ROI, long
bright or dark lines exist. We can find the longest
line in each column as a feature.
To determine a line whether belong to dark or
bright, we defined a sum function of pixels
membership. The function is shown as the following
two equations:
(,) ()
n
bb
im
K
mn T x
(4)
(,) ()
n
ww
im
K
mn T x
(5)
where
(,)
b
K
mn
is the sum of membership to dark
and
(,)
w
K
mn
is the sum of membership to bright
from pixel
m
to pixel
n
in a column.
()
b
Tx
and
()
w
Tx
are calculated by Eq.(1), Eq.(2) and Eq.(3).
And we can find the longest line in a column as
follows:
max( , )
bw
LLL
(6)
where
max ( ,) , ( ,)
bmnw Tb T
L
l K mn K K mn K
max ( ,) , ( ,)
wmnb Tw T
L l Kmn KKmn K
1
mn
lnm
1, 2, ...mN
;
, 1,...nmm N
.
T
K
is a threshold.
b
L is the longest line of which the sum of
membership to dark is larger than
T
K
while the
sum of membership to bright is smaller than
T
K
. If
it not exists,
b
L
is set to 0.
w
L
is the longest line of
which the sum of membership to bright is larger than
T
K
while the sum membership to dark is smaller
than
T
K
. If it not exists,
w
L
is set to 0.
L
is the
longest line in a column.
In this method, we can find the longest line in
each column. If the longest line is longer than
threshold N
T
, the column is labeled white or black,
otherwise the column is labeled gray. We define
several continuous black, white or gray columns as a
black, white or gray stripe respectively. According
to the process above, we can get the longest black,
white and gray stripes in each part. The procedure of
statistical process can be described as following
pseudo-code:
For(column j from 1 to M)
begin
j
L
=FindLongestLine();
if(
j
L
>= N
T
)
column label to black or
white ;
else column label to gray;
End
WBlackStripe=WidestContinuesC(B);
WWhiteStripe=WidestContinuesC(W);
WGrayStripe=WidestContinuesC(G);
j
L
(
j
=1, 2, 3,...
M
) is defined as the value of
L
in column
j
.
j
L
is small in defective area
meanwhile it’s would be a large number in intact
area. The last 3 items in feature vector consist of
AReal-timeComputerVisionSystemforBiscuitDefectInspection
533
width of the widest black, white and gray stripes:
B
W
,
G
W
,
W
W
. It would not be a large number in
texture area. Feature vector can be described by
following equation:
[(1) ... ( ) ]
T
BGW
LLMWWWV
(7)
2.4 Classify with Feature Vector
We choose adaptive boosting (Adaboost) (Freund,
Y., 1997) as our classifier. The classification and
regression tree is the weak learner in Adaboost.
Usually, the intact biscuits have a small value of
B
W
,
G
W
and
W
W
which will influence the weak
learner first. The first N items of feature vector can
improve the accuracy for further iterations. Iteration
time is set to a small number to satisfy the request
for speed for online detection.
3 DESIGN AND PROCESS OF
OVERFLOW DETECTION
3.1 Hardware Structure
In order to detect cream overflow, we utilize the
chemistry character of enantiomer. We put a
polaroid below camera to filter the reflected light
from metal. Because the intensity of polarized image
is low, it’s impossible to detect texture with the
polarized image. So we try to design a set of device
with two cameras to deal with the problem. The
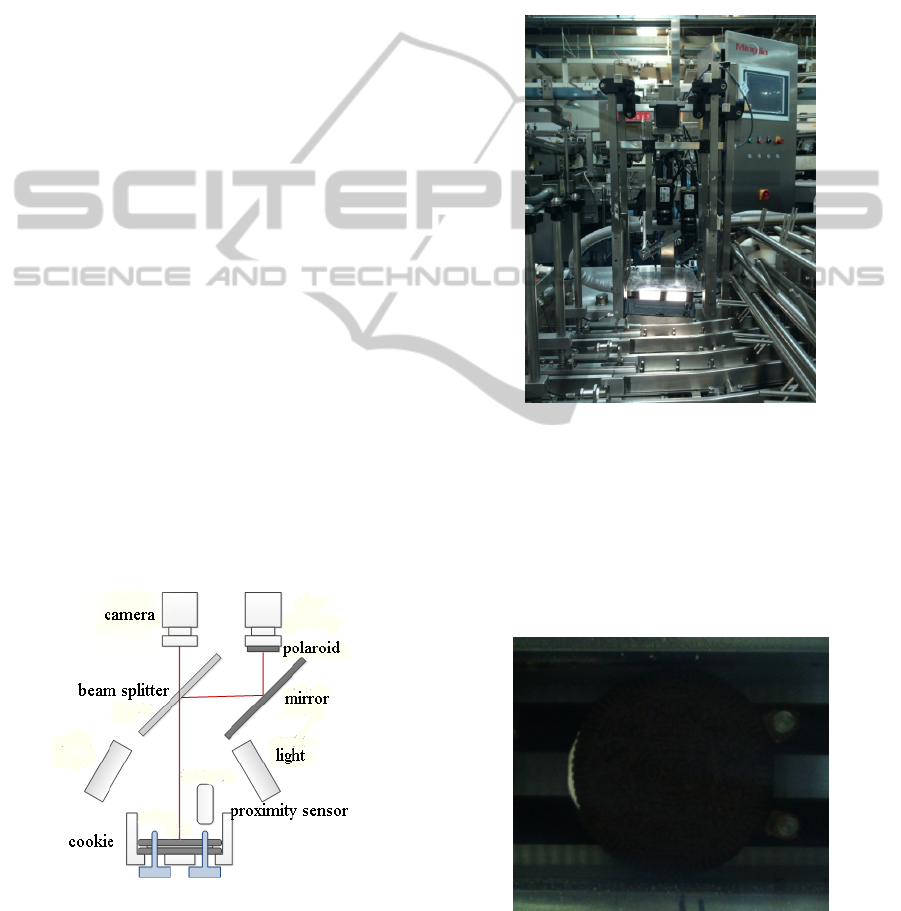
structure of optical device is shown in Fig.5
schematically.
Figure 5: Schematic of optical device.
There are two CCD cameras to take photos: one
is a mono camera which can take
640 480
pixels,
8-bit per pixel images, the other one is an RGB
camera which can take
640 480
pixels, 24-bit per
pixel images. A polaroid is below the RGB camera
which can detect various creams. Below the mono
camera, there is a beam splitter which transmits half
light to mono camera and reflects half to RGB
camera with another mirror. Two stripe polarized
lights are set along the both sides of production line.
We utilize a proximity sensor to trigger two cameras
to take photos when cookie reaches the best location.
Fig.6 shows the equipment on production line.
Figure 6: Schematic of optical device.
3.2 Calibration of Original Image and
Polarized Image
We need to detect the defect of cream overflow. The
polarized image of biscuit is shown in Fig.7 as
follows. With Fig.7, it’s hard to locate the position
of biscuit.
Figure 7: Polarized image of biscuit.
As original image and polarization image are formed
by a splitter light, calibration of two images can
VISAPP2015-InternationalConferenceonComputerVisionTheoryandApplications
534
achieve through training. Just taking translation and
scale into consideration, 3 variables need to be
solved:
X , Y and K . When training, the
polaroid is taken off, the center coordinate and
radius of two image’s biscuit can be solved by
random sample consensus. These 3 variables can be
calculated as following equation:
iOi i Pi
iOi i Pi
iOi Pi
KX X X
KY Y Y
KR R
(8)
where
1
1
N
TT
iii
i
XYK X YK
N
1, 2, 3...iN
. In Eq.(8),
N
means the number for
training images.
Oi
X
means the x-coordinate value
of biscuit center in original image
i
,
P
i
X
stands
for the x-coordinate of biscuit center in polarized
image
i
.
With the result in Eq.(8), we can calculate the
location of biscuit in polarization image with center
and radius of biscuit in original image.
3.3 Calculate the Area of Cream
Overflow
With the data of biscuit center and radius in
polarized image, we calculate the area of cream
overflow. The polarized image is transformed from
RGB to HSV color space. Three threshold bands are
set for hue, saturation and value component to get a
binary image. The noises in binary image are
removed by morphological operating. Then the
number of white pixels in binary image is counted in
the region which is a ring area from edge of biscuit
to outside. If the number is larger than threshold, the
biscuit is considered cream overflow. Otherwise, it’s
a biscuit with no cream overflow.
4 EXPERIMENTS
The method has been implemented in Visual Studio
2008 and all experiments are going on a Nuvo-
1005b IPC, core i5 540M and 2G RAM. We conduct
experiments on production line in Mondelez
International Suzhou Food Co.LTD Huxi Branch.
We make four groups of experiments as follows:
three groups for accuracy test, the last group for
stability test of system. Results of four groups are
shown from Fig.8 to Fig.10 and the data are shown
in Table 1 and Table 2.
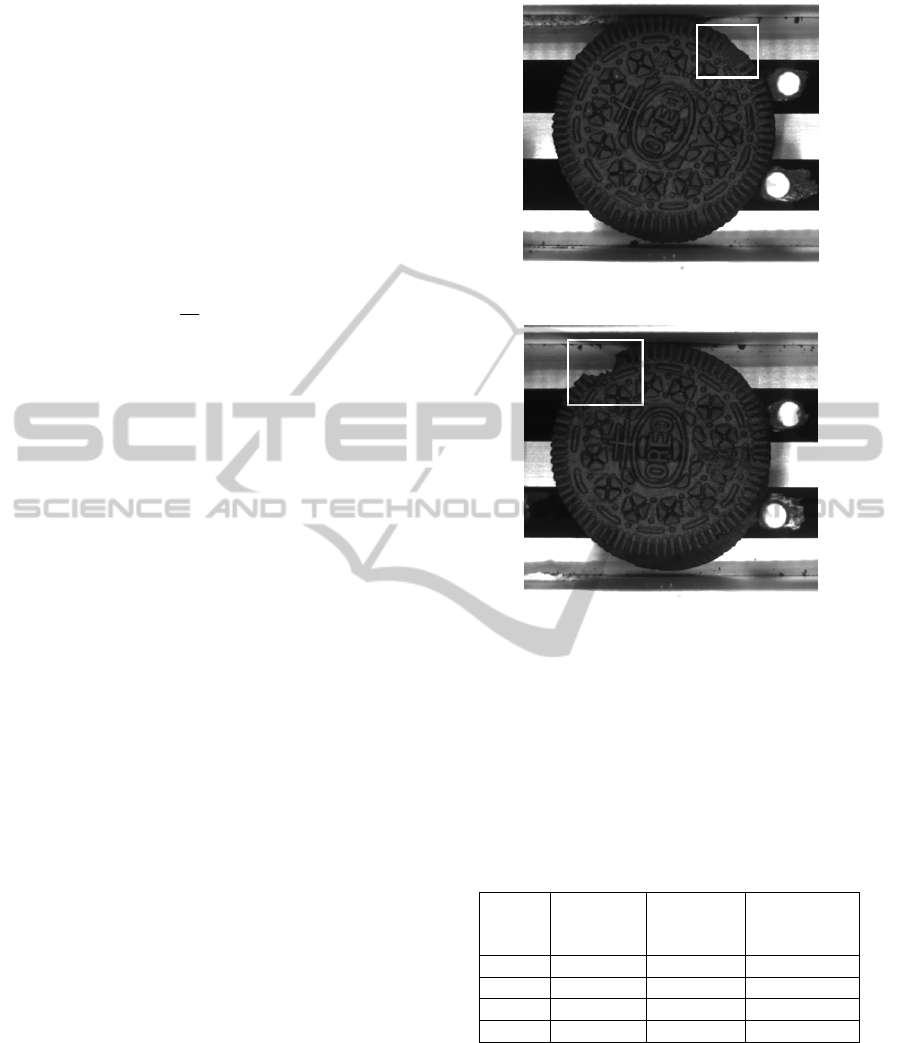
Figure 8: The result of partial fray biscuit.
Figure 9: The result of partial deletion biscuit.
From Table 1, we can get the result of inspection
partial deletion or fray biscuit. The false positive
proportion is range from 0.09‰ to 0.14‰. The false
negative rate is range from 0.09‰ to 0.27‰. The
total error rate in the four groups of experiments is
0.33‰. The precision of partial deletion or tray is
0.3 mm
2
.
Table1: The proportion of FP and FN in partial deletion or
fray detection.
Group
Number
of
biscuits
Proportion
of false
positive
Proportion
of false
negative
1 21756 0.09‰ 0.18‰
2 22052 0.14‰ 0.09‰
3 22034 0.14‰ 0.27‰
4 126843 0.13‰ 0.22‰
The result of cream overflow detection is shown in
Table 2. The false positive rate is range from 0.05‰
to 0.14‰. The false negative proportion is range
from 0.14‰ to 0.32‰. The total error rate in the
four groups of experiments is 0.32‰. The precision
of overflow detection can reach to a 0.5 mm width
cream overflow. The fourth experiment lasts 6 hours,
so the system has been proved stable.
AReal-timeComputerVisionSystemforBiscuitDefectInspection
535
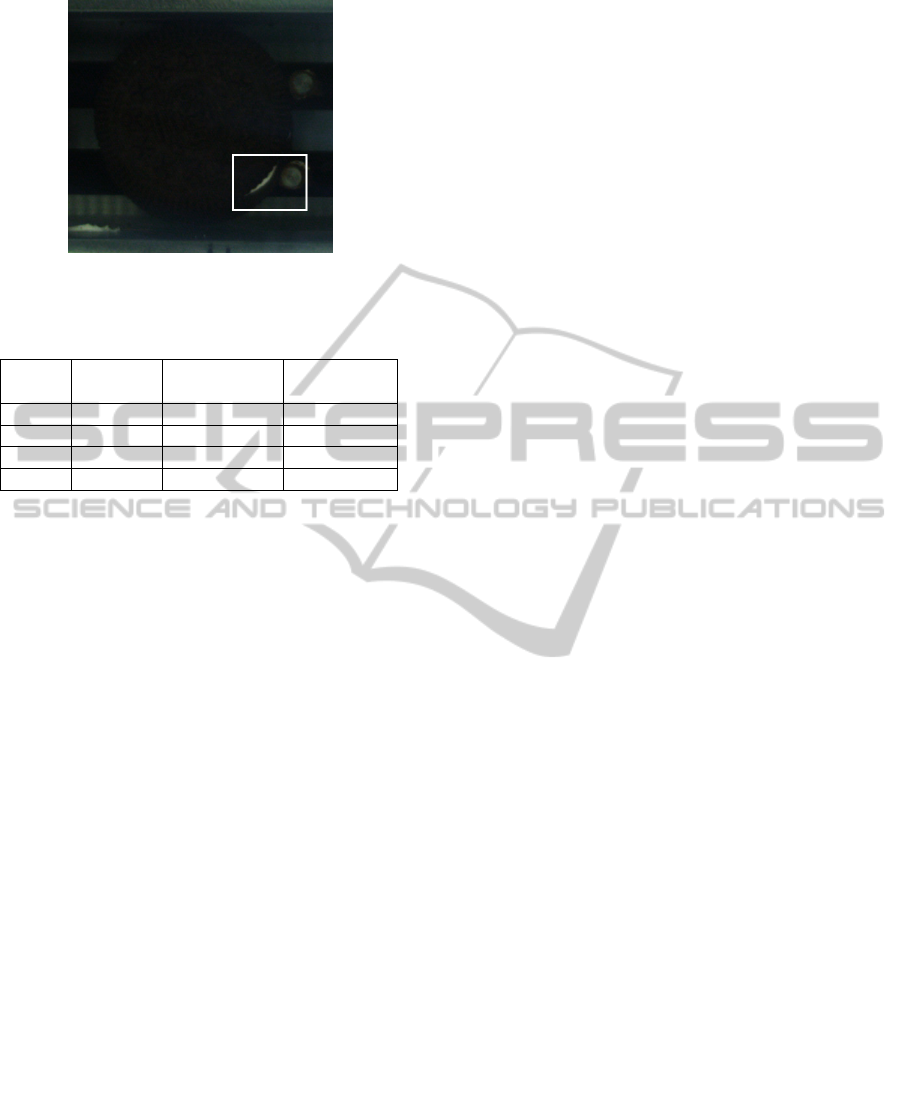
Figure 10: The result of cream overflow biscuit.
Table 2: The proportion of FP and FN in cream overflow
detection.
Group
Number of
biscuits
Proportion of
false positive
Proportion of
false negative
1 21756 0.05‰ 0.14‰
2 22052 0.14‰ 0.18‰
3 22034 0.09‰ 0.32‰
4 126843 0.12‰ 0.21‰
The time consuming of detecting a biscuit is less
than 40 ms in on-line experiments, which can satisfy
the speed of production. The experiments
demonstrate that our system is effective and efficient.
5 CONCLUSIONS
In this paper, a biscuit inspection system is proposed
in on-line detection. The feature extraction algorithm
can be described to three steps: locate and unfold
the ring area; calculate the membership for pixels;
find the longest line in each column and compose
the feature vector. The application of polarized light
can detect cream overflow of biscuit. The result of
experiment shows that our method is accurate and
can meet real-time demands. The system has been
implemented on biscuit production line.
ACKNOWLEDGEMENTS
Partially supported by Postdoctoral Fund
(No.023207009).
REFERENCES
Chenbo, S., Guijin, W., Xinggang, L., Yongming, W.,
Chao, L., Quan, M., 2010. Topology based affine
invariant descriptor for MSERs. IEEE Conference on
Image Processing, 133-136.
Eugene, H., 2002. Optics, Addison Wesley. United
States of America, 4
th
edition.
Freund, Y. and Schapire, R. E., 1997. A decision-theoretic
generalization of on-line learning and an application to
boosting. Journal of computer and system sciences, 55,
119-139.
Heikkila, M., Pietikainen, M., 2006. A texture-based
method for modeling the background and detecting
moving objects. IEEE Transactions on pattern
analysis and machine intelligence, 28(4), 657-662.
Herbert, B., Andreas, E., Tinne, T., Luc, V.G,. 2008. Surf:
Speeded Up Robust Features. Computer vision and
image understanding, 110(3) 346-359.
Hernandez, J.A., Heyd, B., Trystram, G., 2007. On-line
assessment of brightness and surface kinetics during
coffee roasting. Journal of food engineering, 87(3),
314-322.
Hoang, M., 2005. Energy-based geometric multi-model
fitting. International Journal of Computer Vision, 97(2)
23-147.
Hossam, I., Yuri, B., 2012. Color texture measurement
and segmentaion. Signal Processing, 85(2) 265-275.
Johannes, A.R., Magne, Setnes., Janos, A., 2001. Learning
fuzzy classification rules from labeled data.
Information sciences, 150(2003) 77-93.
Liu, C., Wang, G., Lin, X., Li, L., 2012. Person re-
identification by spatial pyramid color representation
and local region matching. IEICE Trans. Information
& System. E95D, 2154-2157.
Mahalakshmi, T., Muthaiah, R. and Swaminathan, P.,
2012. Review Article: An Overview of Template
Matching Technique in Image Processing. Research
journal of applied sciences, engineering and
technology. 4(24): 5469-5473.
Mak, K. L., Peng, P., Lau, H. Y. K., 2005. A real-time
computer vision system for detecting defects in textile
fabrics. ICIT’05, IEEE International Conference on
Industrial Technology., 469-474.
McNaught, A. D., Wilkinson, A., 1997. Compendium of
Chemical Terminology, International Union of Pure
and Applied Chemistry. Zürich. 2
nd
edition.
Mikolajczyk, K., Schmid, C., 2005. A performance
evaluation of local descriptors. IEEE Transactions on
pattern analysis and machine intelligence, 27(10),
1615-1630.
Perrot, N., Trystram, D., Guennec, F. And Guely, F.,
1996. Sensor fusion for real time quality evaluation of
biscuit during baking. journal of food engineering,
29(3-4), 301-315.
Senni, L., Ricci, M., Palazzi, A., 2014. On-line automatic
detection of foreign bodies in biscuits by infrared
thermography and image processing. journal of food
engineering, 128, 146-156.
Shi, C., Wang, G., Pei, X., He, B., Lin, X., 2012. Stereo
matching using local plane fitting in confidence-based
support window. IEICE Trans. Information & System.
E95D, 699-702.
Vollhardt, K. P. C., Schore, N. E., 2003. Organic
Chemistry, W. H. Freeman. American.4
th
edition.
VISAPP2015-InternationalConferenceonComputerVisionTheoryandApplications
536
