
Mental Workload Management as a Tool in e-Learning Scenarios
Andr
´
e Pimenta
1
, Sergio Gonc¸alves
2
, Davide Carneiro
1
, Florentino Fde-Riverola
2
, Jos
´
e Neves
1
and Paulo Novais
1
1
Departament of Informatics, University of Minho, Braga, Portugal
2
Informatics Department, University of Vigo, Ourense, Spain
Keywords:
Mental Workload, Mental Fatigue, Machine Learning, e-Learning, Fatigue Management, Human Perfor-
mance.
Abstract:
In our daily life, we often have a sense of being exhausted due to mental or physical work, together with a
feeling of performance degradation in the accomplishment of simple tasks. This is in part due to the fact that
the working capacity and the performance of an individual, either physical or mental, generally decrease as
the day progresses, although factors like motivation also play a significant role. These negative effects are
especially significant when carrying out long or demanding tasks, as often happens in an educational context.
In order to avoid these effects, initiatives to promote a good management of the time and effort invested in each
task are mandatory. Such initiatives, when effective, can have a wide range of positive effects, including on the
performance, productivity, attention and even mental health. Seeking to find a viable and realistic approach to
address this problem, this paper presents a non-invasive and non-intrusive way to measure mental workload,
one of the aspects that affects mental fatigue the most. Specifically, we target scenarios of e-learning, in which
the professor may not be present to assess the student’s state. The aim is to create a tool that enables an actual
management of fatigue in such environments and thus allows for the implementation of more efficient learning
processes, adapted to the abilities and state of each student.
1 INTRODUCTION
In our day-to-day we often feel a sense of tiredness
during mental or physical work, generally known as
fatigue. The term fatigue is used to describe a series
of manifestations that range from drowsiness or loss
of concentration to lack of physical strength or agility
(van der Linden et al., 2003). Thus, it is a very broad
and subjective term that may include symptoms such
as loss of performance (loss of attention, slowed reac-
tion and response times, impaired decision-making,
and poor performance on tasks that generally reflect
the good performance) as well as more subjective
ones such as sleepiness and tiredness (Williamson
et al., 2005; Perelli, 1980).
In seeking to formalize it, fatigue may be defined
as a degree of failure of physical or mental factors as-
sociated with loss of physical or mental performance,
hindering the natural or spontaneous accomplishment
of a usual activity. Bartlett provides one of the clear-
est definitions of fatigue with respect to day-to-day
tasks (Bartlett, n.d.) :
Fatigue is a term used to cover all those determinable
changes in the expression of an activity which can be
traced to the continuing exercise of that activity un-
der its normal operational conditions, and which can
be shown to lead, either immediately or after delay,
to deterioration in the expression of that activity, or,
more simply, to results within the activity that are not
wanted.
I.D. Brown, on the other hand, conceptualized mental
fatigue as:
(...) the subjective experience of individuals who are
obliged (...) to continue working beyond the point
at which they are confident of performing their task
efficiently (...) [Fatigue is] the subjectively experi-
enced disinclination to continue performing the task
at hand. [The] main effect of fatigue [is] a progressive
withdrawal of attention from the task at hand. [This
withdrawal] may be sufficiently insidious that [oper-
ators] are unaware of their impaired state and hence
in no position to remedy it (Brown, 1994).
Beyond the well-known effects on mood or en-
ergy, fatigue is also the cause or partial cause of er-
rors and accidents. Often, this happens because fa-
tigued individuals are unaware of the degree of their
25
Pimenta A., Gonçalves S., Carneiro D., Fde-riverola F., Neves J. and Novais P..
Mental Workload Management as a Tool in e-Learning Scenarios.
DOI: 10.5220/0005237700250032
In Proceedings of the 5th International Conference on Pervasive and Embedded Computing and Communication Systems (PECCS-2015), pages 25-32
ISBN: 978-989-758-084-0
Copyright
c
2015 SCITEPRESS (Science and Technology Publications, Lda.)

impaired mental state (Miller, 2013). These errors
and accidents assume particular importance when we
consider the domain of high-risk jobs that involve op-
erating vehicles as well as the military, firefighters or
medical personal, just to name a few. Beyond these
immediate problems, fatigue can also lead to health
problems in the long term, such as chronic fatigue
syndrome or depression.
The negative effects of fatigue are thus clear.
Moreover, they are also broad in the sense that affect
many of our cognitive abilities. Learning is one of
the functions that becomes impaired when under fa-
tigue. Hence the importance of addressing this issue,
especially in a time in which the teacher and student
are growing apart due to the increasing use of elec-
tronic tools for learning. Indeed, due to the separation
imposed by technology, it results more and more dif-
ficult for teachers to be sensible to the state of their
students, impairing their ability to adapt both the con-
tents and the teaching strategy accordingly.
This work details a tool for fatigue management
in e-learning scenarios, with or without the teacher’s
presence, through the assessment of mental work-
load quantified in terms of the interaction patterns of
the user with the computer. Through the use of be-
havioural biometrics, specifically Keystroke Dynam-
ics and Mouse Dynamics, we analyse the type of task
performed by each user, the time spent performing it,
as well as the mental workload of the task. With this
information we train classifiers that are able to distin-
guish situations in which users show signs of fatigue
or high mental workload.
This approach can be considered both non-
invasive and non-intrusive, since it is based solely on
the observation of the use of the mouse and keyboard,
which allow for an assessment of the user’s perfor-
mance. This approach opens the door to the develop-
ment of fatigue management initiatives in the context
of e-learning, allowing teachers to not only have a bet-
ter notion about their student’s state but also to more
efficiently adapt and above all personalize teaching
strategies.
1.1 The Need for Monitoring in the
Context of e-Learning
Electronic instruction, more commonly known as e-
learning, is increasingly used as a method of teach-
ing. E-learning differs from classroom-based train-
ing in several ways. Thus, the transition from a tradi-
tional course to a course supported by e-learning can
be complex and difficult. There is the need for a good
course planning and an increased effort in monitoring
and controlling all participants in all the different mo-
ments of the course while at the same time focusing
on getting feedback that may allow to better steer the
course (Hamburg et al., 2008).
Without the obligatory physical presence of a
teacher, the process of e-learning is exposed to some
deficiencies that may result in poor student learning.
Specifically, the teacher is not able to observe the stu-
dents in search of signs evidencing problems such as
doubts, frustration, stress or fatigue, preventing teach-
ers from taking action in such scenarios. The set-
ting up of appropriate monitoring mechanisms in the
context of e-learning is therefore very important in
achieving an efficient learning process.
As shown in the literature, for an efficient mon-
itoring of the student to take place, it is crucial that
the e-learning system allows for a personalized study
strategy and is able to show the needs and strengths
of each student (Cantoni et al., 2004). Thus it be-
comes possible to track the progress of students, as
well as improving their learning, by providing better
personalized learning methods. The identification of
learning problems and the cause of those problems is
another advantage that can be achieved through the e-
learning context, and via monitoring systems, such as
the tool proposed in this paper.
1.2 Including Subjective Measures of
Workload
In this paper we look at the monitoring and managing
of mental workload as a way to improve the quality
of information of the e-learning environment, espe-
cially to improve the teacher’s decision making abili-
ties. One of the important parts of this work is a previ-
ously developed approach, deemed non-invasive and
non-intrusive, for the analysis of the students’ inter-
action patterns.
Indeed, it was established in preliminary work that
one’s patterns of interaction with the computer, mea-
sured in terms of the use of the keyboard and mouse,
change when under fatigue as well as in periods of in-
creased mental workload or even stress. Moreover, it
were also found behavioral differences in performing
different kinds of tasks, allowing to analyze patterns
of attention in the students who participated in the
experimental studies (Pimenta et al., 2015; Pimenta
et al., 2014).
However, the work developed so far has the short-
coming of not considering mental workload, which is
an important aspect when it comes to determining the
actual level of fatigue. It is also important, for ex-
ample, to distinguish between scenarios of boredom
or excess of work (which, in a first instance, are both
characterized by slowed performance).
PECCS2015-5thInternationalConferenceonPervasiveandEmbeddedComputingandCommunicationSystems
26

Figure 1: Conceptualisation of the set of factors that influence human performance and fatigue. (Balkin and Wesensten, 2011).
This aspect is now included in this paper, thus
representing a step forward in the development of
more accurate fatigue assessment approaches (Figure
1) that encompass the type of task, the time on task,
and the mental workload of the task. Indeed, work-
load levels can help isolate the causes affecting per-
formance at a given time, improving fatigue manage-
ment initiatives. To this end, and besides the metrics
derived from the use of the mouse and keyboard, sub-
jective measures of mental workload are also used.
Obtaining mental workload levels during task per-
formance may be a challenging procedure. Moreover,
the workload level experienced by an individual can
affect task performance twofold: either through ex-
cessive or reduced mental workload. To this end,
subjective measures are often used, some of them de-
tailed in (Reid et al., 1982).
The two instruments most often used in research
were developed in parallel in the 1980s, one at the
NASA-Ames Research Center in California and the
other within the U.S. Air Force human factors re-
search group at Wright-Patterson AFB, Ohio.
The NASA Task Load Index (NASA-TLX) is a
multidimensional assessment tool (Hart and Stave-
land, 1988). The main seven-point scale is: Overall
Performance: How successful were you in perform-
ing the task? How satisfied were you with your per-
formance? The TLX has five seven-point subscales
that help identify difficult task characteristics. The
subscales are:
• Mental Demand: How much mental and percep-
tual activity was required? Was the task easy or
demanding, simple or complex?
• Physical Demand: How much physical activity
was required? Was the task easy or demanding,
slack or strenuous?
• Temporal Demand: How much time pressure did
you feel due to the pace at which the tasks or task
elements occurred? Was the pace slow or rapid?
• Frustration Level: How irritated, stressed, and an-
noyed versus content, relaxed, and complacent
did you feel during the task?
• Effort: How hard did you have to work (mentally
and physically) to accomplish your level of per-
formance?
Although these measures require a manual data
entry, they are extremely useful to validate the
interaction-based performance. It must thus be made
clear that we do not intend for a final version of a
fatigue management tool to include such indicators.
Nonetheless, at the moment we look at such indica-
tors as a viable way to assess the validity of the de-
veloped approach, when both are used in parallel, as
described further ahead in this paper.
2 FATIGUE MANAGEMENT AS A
TOOL FOR IMPROVING
LEARNING PERFORMANCE
As stated before, this paper presents a tool for mon-
itoring fatigue in e-learning scenarios using non-
intrusive and non-invasive techniques. To this end it
proposes an analysis and classification of the interac-
tion patterns of users with the computer while using
the mouse and keyboard. It is thus based on the stu-
dents behavioural changes regarding the computer.
Similar approaches have been used in the past to
estimate performance, albeit with more limited or dif-
ferent final aim. Cart et al. (Card et al., 1980) pre-
sented, in 1980, on of the earliest works on the topic,
MentalWorkloadManagementasaTooline-LearningScenarios
27

aimed at the development of better interaction mech-
anisms with computers.
The proposed approach distinguishes from exist-
ing work twofold: (1) the application area and (2) the
features considered, as detailed further ahead in this
section. The tool collects data bout the user’s inter-
action with the computer and stores it in the form of
a log. This log contains each particular interaction
event, their timestamp and other important informa-
tion such as coordinates or key code, when applica-
ble.
The following events are considered:
• MOV, timestamp, posX, posY - an event describ-
ing the movement of the mouse, in a given time,
to coordinates (posX, posY) in the screen;
• MOUSE DOWN, timestamp, [Left—Right],
posX, posY - this event describes the first half of
a click (when the mouse button is pressed down),
in a given time. It also describes which of the
buttons was pressed (left or right) and the position
of the mouse in that instant;
• MOUSE UP, timestamp, [Left—Right], posX,
posY - an event similar to the previous one but
describing the second part of the click, when the
mouse button is released;
• MOUSE WHEEL, timestamp, dif - this event de-
scribes a mouse wheel scroll of amount dif, in a
given time;
• KEY DOWN, timestamp, key - identifies a given
key from the keyboard being pressed down, at a
given time;
• KEY UP, timestamp, key - describes the release
of a given key from the keyboard, in a given time;
From these events, that fully describe the interac-
tion of the user with the mouse and keyboard, we ex-
tract a set of features, based on notions of behavioural
biometrics:
KEY DOWN TIME - the timespan between two
consecutive KEY DOWN and KEY UP events, i.e.,
for how long was a given key pressed.
TIME BETWEEN KEYS - the timespan between two
consecutive KEY UP and KEY DOWN events, i.e.,
how long did the individual took to press another key.
VELOCITY - The distance travelled by the mouse
(in pixels) over the time (in milliseconds). The
velocity is computed for each interval defined by
two consecutive MOUSE
UP and MOUSE DOWN
events. Let us assume two consecutive MOUSE UP
and MOUSE DOWN events, mup and mdo, re-
spectively in the coordinates (x1,y1) and (x2,y2),
that took place respectively in the instants time
1
and time
2
. Let us also assume two vectors posx
and posy, of size n, holding the coordinates of the
consecutive MOUSE MOV events between mup and
mdo. The velocity between the two clicks is given
by r dist/(time
2
− time
1
), in which r dist represents
the distance travelled by the mouse and is given by
equation 1.
r dist =
n−1
∑
i=0
q
(posx
i+1
− posx
i
)
2
+ (posy
i+1
− posy
i
)
2
(1)
ACCELERATION - The velocity of the mouse (in
pixels/milliseconds) over the time (in milliseconds).
A value of acceleration is computed for each in-
terval defined by two consecutive MOUSE UP and
MOUSE DOWN events, using the intervals and data
computed for the Velocity.
TIME BETWEEN CLICKS - the timespan between
two consecutive MOUSE UP and MOUSE DOWN
events, i.e., how long did it took the individual to
perform another click.
DOUBLE CLICK DURATION - the timespan between
two consecutive MOUSE UP events, whenever this
timespan is inferior to 200 milliseconds. Wider
timespans are not considered double clicks.
AVERAGE EXCESS OF DISTANCE - this feature mea-
sures the average excess of distance that the mouse
travelled between each two consecutive MOUSE UP
and MOUSE DOWN events. Let us assume two
consecutive MOUSE UP and MOUSE DOWN
events, mup and mdo, respectively in the coor-
dinates (x1,y1) and (x2, y2). To compute this
feature, first it is measured the distance in straight
line between the coordinates of mup and mdo as
s dist =
p
(x2 − x1)
2
+ (y2 − y1)
2
. Then, it is mea-
sured the distance actually travelled by the mouse by
summing the distance between each two consecutive
MOUSE MV events. Let us assume two vectors posx
and posy, of size n, holding the coordinates of the
consecutive MOUSE MV events between mup and
mdo. The distance actually travelled by the mouse,
real dist is given by equation 1. The average excess
of distance between the two consecutive clicks is thus
given by r dist/s dist.
AVERAGE DISTANCE OF THE MOUSE TO THE
STRAIGHT LINE - in a few words, this feature
measures the average distance of the mouse to the
straight line defined between two consecutive clicks.
Let us assume two consecutive MOUSE UP and
PECCS2015-5thInternationalConferenceonPervasiveandEmbeddedComputingandCommunicationSystems
28

MOUSE DOWN events, mup and mdo, respectively
in the coordinates (x1,y1) and (x2,y2). Let us also
assume two vectors posx and posy, of size n, holding
the coordinates of the consecutive MOUSE MOV
events between mup and mdo. The sum of the
distances between each position and the straight
line defined by the points (x1,y1) and (x2,y2) is
given by 2, in which ptLineDist returns the distance
between the specified point and the closest point on
the infinitely-extended line defined by (x1,y1) and
(x2,y2). The average distance of the mouse to the
straight line defined by two consecutive clicks is this
given by s dists/n.
s dists =
n−1
∑
i=0
ptLineDist(posx
i
, posy
i
) (2)
DISTANCE OF THE MOUSE TO THE STRAIGHT LINE
- this feature is similar to the previous one in the sense
that it will compute the s dists between two consecu-
tive MOUSE UP and MOUSE DOWN events, mup
and mdo, according to equation 2. However, it returns
this sum rather than the average value during the path.
SIGNED SUM OF ANGLES - with this feature the
aim is to determine if the movement of the mouse
tends to ”turn” more to the right or to the left.
Let us assume three consecutive MOUSE MOVE
events, mov1,mov2 and mov3, respectively in the
coordinates (x1,y1), (x2,y2) and (x3,y3). The angle
α between the first line (defined by (x1,y1) and
(x2,y2)) and the second line (defined by (x2,y2) and
(x3,y3)) is given by degree(x1,y1,x2, y2,x3,y3) =
tan(y3 − y2,x3 − x2) − tan(y2 − y1,x2 − x1). Let
us now assume two consecutive MOUSE UP and
MOUSE DOWN events, mup and mdo. Let us also
assume two vectors posx and posy, of size n, holding
the coordinates of the consecutive MOUSE MOV
events between mup and mdo. The signed sum of
angles between these two clicks is given by equation
3.
s angle =
n−2
∑
i=0
degree(posx
i
, posy
i
, posx
i+1
,
posy
i+1
, posx
i+2
, posy
i+2
)
(3)
ABSOLUTE SUM OF ANGLES - this feature is very
similar to the previous one. However, it seeks to find
only how much the mouse ”turned”, independently
of the direction to which it turned. In that sense, the
only difference is the use of the absolute of the value
returned by function degree(x1,y1,x2,y2, x3,y3), as
depicted in equation 4.
s angle =
n−2
∑
i=0
| degree(posx
i
, posy
i
, posx
i+1
,
posy
i+1
, posx
i+2
, posy
i+2
) |
(4)
DISTANCE BETWEEN CLICKS - represents the to-
tal distance travelled by the mouse between two
consecutive clicks, i.e., between each two con-
secutive MOUSE UP and MOUSE DOWN events.
Let us assume two consecutive MOUSE UP and
MOUSE DOWN events, mup and mdo, respectively
in the coordinates (x1,y1) and (x2,y2). Let us also
assume two vectors posx and posy, of size n, hold-
ing the coordinates of the consecutive MOUSE MOV
events between mup and mdo. The total distance trav-
elled by the mouse is given by equation 1.
After the collection of the data, it is processed and
converted into a set of behavioural biometric features,
able to classify the behaviours of the user in terms of
fatigue and level of attention to the task, described in
detail in (Pimenta et al., 2015). This approach to as-
sess performance has been developed, validated and
used previously. However, after its development, we
concluded that its most significant drawback is that it
looks at performance of interaction alone. Fatigue is a
complex phenomenon and performance measures by
themselves may not be enough for an accurate mea-
surement. In particular, and as stated before, mental
workload is a very important aspect when it comes to
characterizing fatigue.
We are thus now extending this approach with the
acquisition of contextual information about the user,
including the type of task being performed, the time
spent on each different task, as well as the mental
workload felt while performing the task (Figure 1).
This means that this tool will now also be able to anal-
yse the level of attention of a user to each task (e.g.
distinguish between time spent on tasks related to e-
learning activities against time spent on other tasks).
In the overall, the new tool results in a more complete
approach by including these important contextual fac-
tors.
Figure 2 depicts the process through which the
system operates, where it is possible to observe the
different classifications of information in order to al-
low, in the end, the management of fatigue. Initially
the system captures the mouse and keyboard inputs.
These data are further processed, stored and then used
to calculate the values of the behavioural biometrics.
In the learning phase the system shows a question-
naire in order to evaluate the subjective feeling of
fatigue of the user, as well as the mental workload.
When the system has a large enough dataset that al-
lows to make classifications with precision, it will
classify the inputs received into different mental fa-
tigue and mental workload levels in real-time. At this
MentalWorkloadManagementasaTooline-LearningScenarios
29

Figure 2: The flow of data in the fatigue management tool for e-learning scenarios.
point, the system can start to be used by the people
involved, especially the teacher who can better adapt
and personalize his teaching strategies.
3 CASE STUDY
In order to assess the validity of the approach de-
scribed in the previous section a case study was im-
plemented with the aim of collecting data over a pe-
riod of time that encompassed different sessions of
e-learning, and thus test if it is possible to monitor fa-
tigue through the use of behavioural biometrics and
mental workload.
For this purpose, twenty four students volunteered
(19 men, 5 women), all students of the course of Phys-
ical Sciences at the University of Minho. Their age
ranged between 18 and 30. Participants were pro-
vided with the application for logging the events of
the mouse and keyboard during the duration of the
class. This application started automatically in the
background, when the Operating System started, re-
quiring no specific action from the part of the stu-
dents. The previously mentioned list of features was
extracted from the use of the mouse and keyboard for
the whole period.
3.1 Methodology
The methodology followed to implement the study
was devised to be as minimally intrusive as the ap-
proach it aims to support. Participants were provided
with an application for logging the previously men-
tioned events of the mouse and keyboard. This ap-
plication, which maintained the confidentiality of the
keys used, needed only to be installed in the partic-
ipant’s computer and would run in the background,
starting automatically with the Operating System.
The only explicit interaction needed from the part of
the user was the input of very basic information on
the first run, including the identification and age.
The course takes place physically in a classroom
and comprises a teacher who is responsible for teach-
ing a programming language (in this case MatLab)
to a class of students. Each class has a duration of
three hours, which always follows the same ”proto-
col”: some theoretical concepts are introduced at the
beginning of the class and the rest of the session is
spent practising and solving exercises using the com-
puter and a specific IDE. During each session the sys-
tem, while in a learning phase, presents the user with
a questionnaire (Figure 3) based on the NASA TLX
for measuring mental workload.
Thus, in each session all inputs resulting from the
interaction of the user with the computer using the
mouse and keyboard are collected, together with the
subjective values of cognitive load, acquired from the
NASA TLX.
3.2 Results
Using the data collected in the classroom over the
two weeks, a classification model was trained based
on the K-Nearest Neighbour (KNN) algorithm. It is
a method of classification based on closest training
samples in the feature space.
A model was built based on a dataset with 74 in-
stances, each instance being constituted by the aver-
age values of all features during periods of one our.
Each instance is also assigned a label, which repre-
sents the response of students to the questionnaire for
measuring workload, provided while using the com-
PECCS2015-5thInternationalConferenceonPervasiveandEmbeddedComputingandCommunicationSystems
30
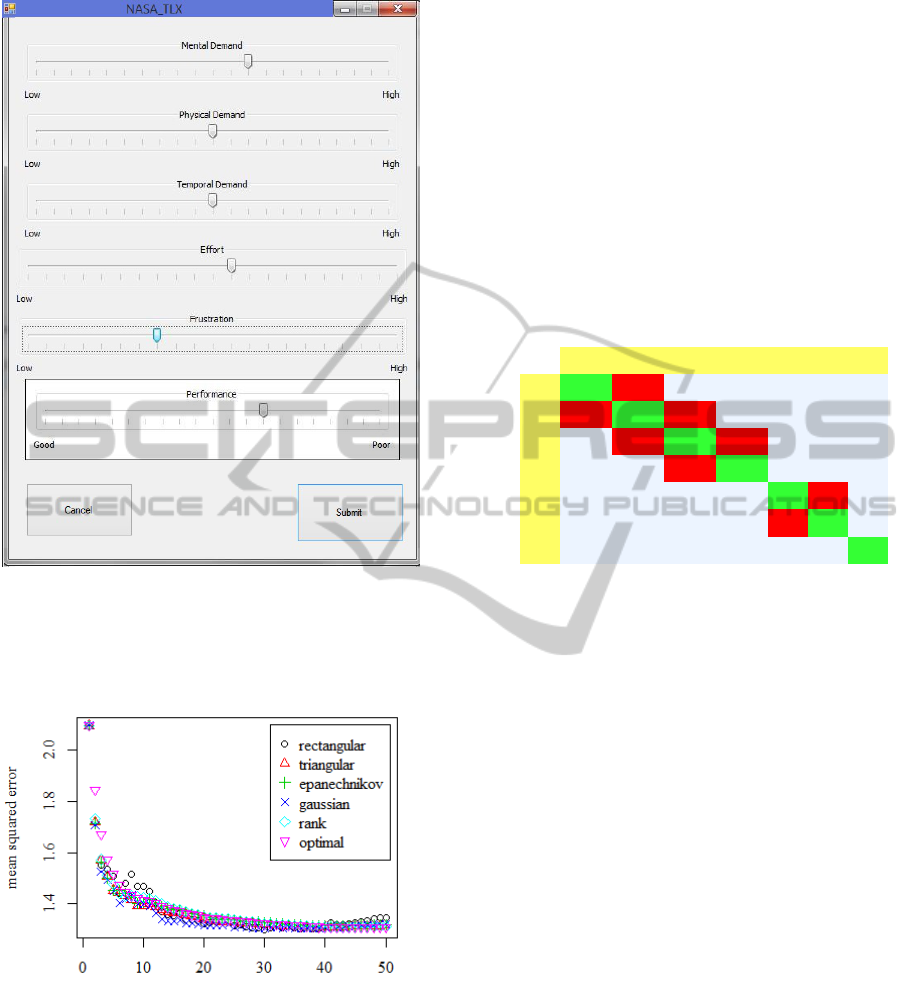
Figure 3: NASA TLX questionnaire used to collect infor-
mation of mental workload.
puter during classes, thus in parallel with the collec-
tion process of the aforementioned data.
Figure 4: Results of different models trained with different
kernels and number of neighbours (K).
Several tests with different numbers of neigh-
bours (K) and with different heuristics to the dis-
tance between neighbouring (rectangular, triangu-
lar, epanachicov, gaussian, rank, optimal) were per-
formed. With a maximum of 50 neighbours, the so-
lution having a lower mean squared error (MSE), was
found with K = 30 and using the rectangular kernel,
as shown in Figure 4.
The trained model was then used to predict the
mental workload in data collected in the second pe-
riod, in a total of 78 instances resulting from the in-
teraction of users with the computer. According to
the classification carried out, 64 out of 78 (83%) of
the instances were in accordance with the subjective
opinion of the user about the mental workload of the
task that was to perform, i.e., were correctly classi-
fied. It is also important to note that the remaining 14
instances (17%) were classified as adjacent values.
Table 1: Results of the validation of the classification
model (KNN). 83% of the instances were correctly classi-
fied (green cells). The 17% misclassified instances where
nonetheless classified as neighboring values (red cells).
PREDICTED
1 2 3 4 5 6 7
1 13 3 0 0 0 0 0
2 2 11 1 0 0 0 0
3 0 1 12 2 0 0 0
4 0 0 2 15 0 0 0
5 0 0 0 0 7 1 0
6 0 0 0 0 1 6 0
N
A
S
A
T
L
X 7 0 0 0 0 0 0 1
4 CONCLUSIONS
This paper describes a prototype of a tool for man-
aging fatigue. Its main innovative aspect is that, for
the first time, it considers the mental workload of a
user while performing a task as an important compo-
nent of fatigue assessment. The main objective is to
detect patterns of behavior at different levels of men-
tal workload. Measurement of levels of mental work-
load are obtained through the NASA TLX instrument,
which is based on a subjective self-evaluation. These
subjective measures, paired with measures of perfor-
mance and context of the task being performed by
a user, allow to train a classifier as the one depicted
which achieved fairly good results. In the described
case study, the tool was used in several classes during
the period of two weeks, which allowed not only to
test it in a real scenario .
The results achieved from the implementation of
the case study show that it is indeed possible to anal-
yse and quantify mental workload through the use of
the mouse and keyboard, and this allows not only to
measure cognitive load but also to improve the pro-
cess of monitoring mental fatigue.
Although at the moment we aim to support the
teacher’s decision making process, the long-term goal
of this work is to develop environments that are
MentalWorkloadManagementasaTooline-LearningScenarios
31

autonomous and take actions concerning their self-
management. These actions will be guided by sev-
eral objectives, one of them being to manage cogni-
tive load, minimize fatigue and increase performance
and well-being of an individual or group of individu-
als through an appropriate selection of tasks and task
durations.
ACKNOWLEDGEMENTS
This work is part-funded by ERDF - European Re-
gional Development Fund through the COMPETE
Programme (operational programme for competi-
tiveness) and by National Funds through the FCT
( Portuguese Foundation for Science and Tech-
nology) within project FCOMP-01-0124-FEDER-
028980 (PTDC/EEI-SII/1386/2012) and project PEst-
OE/EEI/UI0752/2014.
REFERENCES
Balkin, T. and Wesensten, N. (2011). Differentiation of
sleepiness and mental fatigue effects. (2004):47–66.
Brown, I. D. (1994). Driver fatigue. Human Factors: The
Journal of the Human Factors and Ergonomics Soci-
ety, 36(2):298–314.
Cantoni, V., Cellario, M., and Porta, M. (2004). Perspec-
tives and challenges in e-learning: towards natural in-
teraction paradigms. Journal of Visual Languages &
Computing, 15(5):333–345.
Card, S. K., Moran, T. P., and Newell, A. (1980). The
keystroke-level model for user performance time with
interactive systems. Communications of the ACM,
23(7):396–410.
Hamburg, I., Engert, S., Anke, P., Marin, M., and
im IKM Bereich, E.-C. A. (2008). Improving e-
learning 2.0-based training strategies of smes through
communities of practice. learning, 2:610–012.
Hart, S. and Staveland, L. (1988). Development of NASA-
TLX (Task Load Index): Results of empirical and the-
oretical research. Advances in psychology.
Miller, J. C. (2013). Anatomy of a Fatigue-Related Acci-
dent. Shiftwork, Fatigue and Safety, Book 3.
Perelli, L. (1980). Fatigue Stressors in Simulated Long-
Duration Flight. Effects on Performance, Informa-
tion Processing, Subjective Fatigue, and Physiological
Cost. (March 1977).
Pimenta, A., Carneiro, D., Neves, J., and Novais, P. (2014).
A non-invasive approach to detect and monitor acute
mental fatigue. In Ali, M., Pan, J.-S., Chen, S.-M.,
and Horng, M.-F., editors, Modern Advances in Ap-
plied Intelligence, volume 8482 of Lecture Notes in
Computer Science, pages 338–347. Springer Interna-
tional Publishing.
Pimenta, A., Carneiro, D., Novais, P., and Neves, J. (2015).
Detection of distraction and fatigue in groups through
the analysis of interaction patterns with computers.
In Camacho, D., Braubach, L., Venticinque, S., and
Badica, C., editors, Intelligent Distributed Computing
VIII, volume 570 of Studies in Computational Intel-
ligence, pages 29–39. Springer International Publish-
ing.
Reid, G. B., Eggemeier, F. T., and Shingledecker, C. A.
(1982). Subjective Workload Assessment Technique.
Technical report.
van der Linden, D., Frese, M., and Meijman, T. F. (2003).
Mental fatigue and the control of cognitive processes:
effects on perseveration and planning. Acta Psycho-
logica, 113(1):45–65.
Williamson, R. J., Purcell, S., Sterne, A., Wessely, S., Ho-
topf, M., Farmer, A., and Sham, P. C. (2005). The re-
lationship of fatigue to mental and physical health in a
community sample. Social psychiatry and psychiatric
epidemiology, 40(2):126–32.
PECCS2015-5thInternationalConferenceonPervasiveandEmbeddedComputingandCommunicationSystems
32
