
Quality Assessment of Fingerprints with Minutiae Delaunay
Triangulation
Z. Yao, J. Le bars, C. Charrier and C. Rosenberger
Universite de Caen Basse Normandie, ENSICAEN, UMR 6072 GREYC, Caen, France
Keywords:
Fingerprint, Minutiae Template, Quality Assessment, Evaluation.
Abstract:
This article proposes a new quality assessment method of fingerprint, represented by only a set of minutiae
points. The proposed quality metric is modeled with the convex-hull and Delaunay triangulation of the minu-
tiae points. The validity of this quality metric is verified on several Fingerprint Verification Competition (FVC)
databases by referring to an image-based metric from the state of the art (considered as the reference). The
experiments of the utility-based evaluation approach demonstrate that the proposed quality metric is able to
generate a desired result. We reveal the possibility of assessing fingerprint quality when only the minutiae
template is available.
1 INTRODUCTION
The purpose of fingerprint quality assessment is to
improve or guarantee the performance of a biomet-
ric system (Grother and Tabassi, 2007) by forbid-
ding bad quality fingerprint samples, especially dur-
ing the enrollment session. Existing studies of this
issue mostly define the quality in terms of the clarity
of ridge-valley pattern, contrast between foreground
and background, smoothness of orientation and etc
(Ratha and Bolle, 1999; Bolle et al., 1999; Chen et al.,
2004). No matter how many aspects are considered
by a fingerprint quality assessment approach, it is all
about features employed for generating the quality
metric. Prior studies in estimating fingerprint qual-
ity had proposed several features (Alonso-Fernandez
et al., 2007), among which some are carried out by
using an unique feature, while some others combine
multiple features together. For instance, Chen et al.
proposed the Fourier spectrum-based quality metric
with the Butterworth function, Zhao el al. (Zhao
et al., 2010) concluded that the orientation certainty
level (OCL) (Lim et al., 2002) also performs well for
high resolution fingerprint image and Tabassi et al.
(Tabassi et al., 2004) proposed NFIQ with multiple
features including minutiae quality. To standardize
the quality metric of biometric sample, the quality has
been defined as a utility property (Staff, 2009), i.e.
sample quality reflects its impact on the performance
of the system. However, system performance fully
relies on the matching approach such as minutiae-
based system which is employed most in actual de-
ployments. In this case, it is reasonable to consider
qualifying fingerprint with only minutiae information,
particularly when using for embedded applications.
There are very few quality assessment approaches
that take into account minutiae information, such
as NFIQ. Moreover, none of the state-of-the-art ap-
proaches qualifies a fingerprint from the minutiae
template alone. The main contribution of the pro-
posed study is a black box algorithm that computes
quality score from a minutiae template associated to
the fingerprint. In another word, it could be viewed as
a quality metric for assessing the quality of a minu-
tiae template. The benefit of having this type of met-
ric is related to embedded biometric systems in smart
cards or smart objects where only the minutiae tem-
plate is available due to computational and storage
constraints.
This paper is organized as follows. Section 2
presents the proposed quality metric. Details of the
experimental results are given in section 3. Section 4
concludes the paper and discusses the perspectives.
2 METRIC DEFINITION
Fingerprint matching approaches, according to the lit-
erature (Maltoni et al., 2009), are broadly classified
as minutiae-based, correlation-based or image-based,
among which minutiae-based is the most widely stud-
315
Yao Z., Le Bars J., Charrier C. and Rosenberger C..
Quality Assessment of Fingerprints with Minutiae Delaunay Triangulation.
DOI: 10.5220/0005235603150321
In Proceedings of the 1st International Conference on Information Systems Security and Privacy (ICISSP-2015), pages 315-321
ISBN: 978-989-758-081-9
Copyright
c
2015 SCITEPRESS (Science and Technology Publications, Lda.)
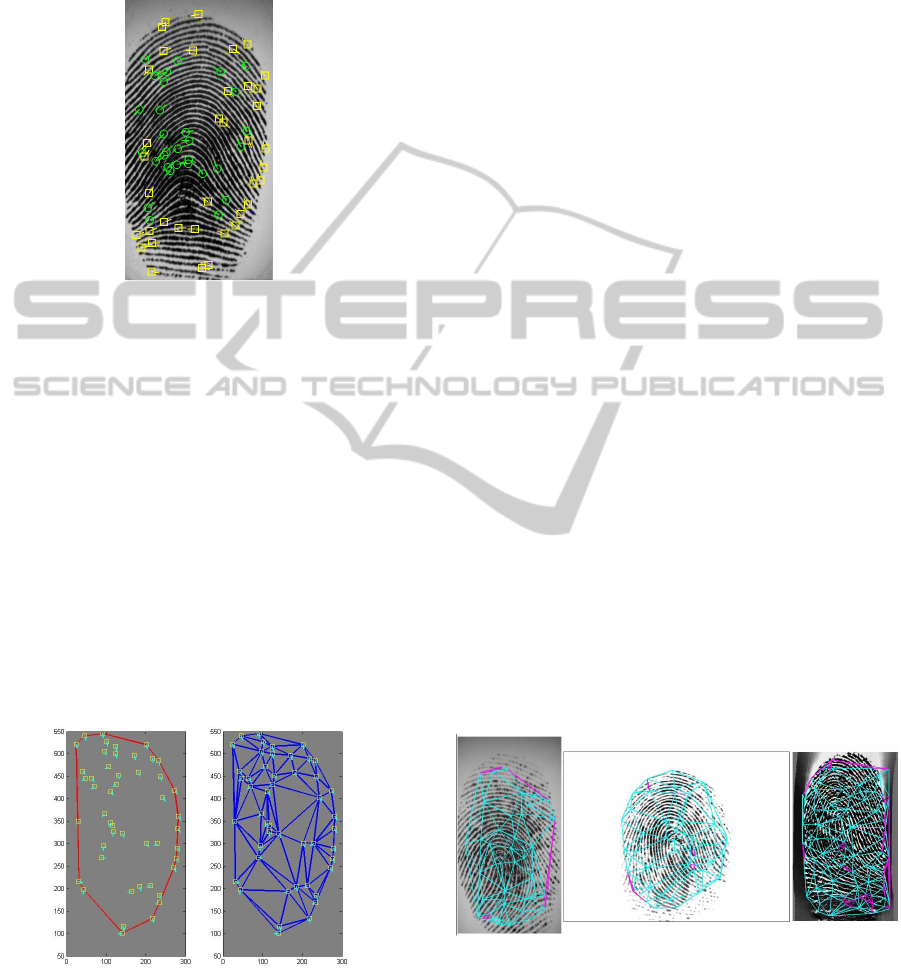
ied solution. A minutiae template generally provides
three kinds of information: 1) minutia location, 2)
the orientation and 3) the type of minutia point (ridge
ending and bifurcation), see figure 1.
Figure 1: A fingerprint and its minutiae template.
These features are sufficient to reconstruct a syn-
thetic fingerprint from a given template (Feng and
Jain, 2011) as the orientation field can be estimated.
Another kind of information is the amount of detected
minutiae points, which has been used as one factor
(Tabassi et al., 2004) for quality assessment of finger-
print samples. However, this information is far from
being enough for generating an effective quality met-
ric. In order to do so, the minutiae template is related
with the foreground of fingerprint because the area of
minutiae indicates an available and useful region for
the so-called ’extractability’ of features. In this case,
this paper proposed to estimate fingerprint quality by
modeling the associated minutiae template with the
convex-hull and Delaunay triangulation (Cf. figure
2).
Figure 2: A convex hull (left) and Delaunay Triangulation.
The 2D convex hull (Andrew, 1979)
C
i
= {(x
j
, y
j
)| j = 1, ··· , N
i
} (where N
i
is the
minutiae number of the i
th
fingerprint) is defined as
the smallest convex set that contains all the points of
a given set of minutiae F
i
in this case (Cf. figure 2).
The Delaunay Triangulation of a set of points P in 2D
plane is defined as a triangulation DT(P) (Delaunay,
1934) that none of the points of the given set are
inside the circumcircle of any triangle of DT(P), as
illustrated in figure 2.
With the respective properties of these two geo-
metric structures, an area of the smallest informative
region of the fingerprint and a set of areas and
perimeters of triangles composed by each 3 minutiae
points are obtained. By doing so, one unavoidable
problem is observed that almost all the templates
of bad quality fingerprints contain both correctly
detected minutiae point and spurious points. Based
on this observation, we proposed a quality metric as
described below.
Let a minutiae template F
i
of a fingerprint con-
taining a set of detected minutiae points represented
by m
j
= (x
j
, y
j
, θ
j
), where (x
j
, y
j
) is the location
and θ
j
is the orientation of the j
th
minutia point;
A convex hull denoted by C
i
and a set of triangles
(T
k
) formed by Delaunay triangulation, formulated
as DT (F
i
) = {T
k
|k = 1, 2, ··· , L
i
} where L
i
(< 2N
i
)
is the number of triangles can be constructed from
F
i
. Correspondingly, the convex hull encloses all the
minutiae of F
i
with the smallest area represented by
A
i
, and a set of areas S
k
and perimeters P
k
of DT (F
i
)
are respectively obtained.
In the experiments, we observed that bad quality
samples generate tiny and extremely narrow triangles
(considered as unreasonable) due to spurious minu-
tiae points. The quantitative values of their area and
perimeter are (visually) not proportional to each other,
as observed in Figure 3.
Figure 3: Example of minutiae Delaunay triangulations of 3
different FVC images. NFIQ values are 2, 2 and 1, respec-
tively.
In figure 3, triangles drew by the pink color indi-
cates the unreasonable minutiae structures. Based on
these observations, the quality metric (abbreviated as
MQF afterwards) is calculated with several steps, as
described by algorithm 1. In the computation of the
ICISSP2015-1stInternationalConferenceonInformationSystemsSecurityandPrivacy
316

proposed quality metric, three thresholds are set for
triangle perimeter, triangle area and the ratio between
the perimeter and area of the triangle, which are rep-
resented by Y
p
, Y
a
and Y
r
, respectively. The details
for choosing the most appropriate parameters are dis-
cussed in section 3. The quality value q is dependent
on the size of the minutiae region so that it is normal-
ized into the range of [0, 100] on each database.
Algorithm 1: Computation of the quality score.
Input:
Minutiae Template F
i
.
Output:
Quality index, q;
1: Calculate the area of the convex hull C
i
, denoted
as A
i
;
2: Calculate perimeter and area for each triangle T
k
,
denoted as P
k
and S
k
;
3: A
Y
p
= area (Search(P
k
< Y
p
));
4: A
Y
a
= area (Search(S
k
< Y
a
));
5: A
Y
pa
= area (Search(P
k
< Y
p
& S
k
< Y
a
));
6: A
Y
r
= area (Search(P
k
S
k
) > Y
r
);
7: S
area
=
A
i
− A
Y
p
− A
Y
a
− A
Y
r
− A
Y
pa
;
8: return q = S
area
;
Obviously, this algorithm relates the minutiae
template with the area of a region for matching oper-
ations as it has just been mentioned before. However,
this factor is not sufficient so that we consider to re-
move a part of potentially useless area from the infor-
mative region due to the lack of image information.
Delaunay triangulation gives a relatively ideal solu-
tion to this problem thanks to the spurious minutiae of
bad quality images. For example, as it is depicted in
figure 3, some unreasonable triangles formed by spu-
rious minutiae on the border enable us to remove the
corresponding area. Another case is the tiny triangle
which is mostly happened to the area where the qual-
ity of ridge-valley pattern is relatively bad. The study
also noted that some fingerprint images have several
genuine minutiae clustering in a very small area. This
case is not specially considered in the proposed al-
gorithm just because of the limitation of the template.
The area of each triangle is obtained by using Heron’s
formula (Aufmann et al., 2007).
3 EXPERIMENTAL RESULTS
In order to validate the MQF, we adopt several ap-
proaches to estimate the performance of the quality
metric: 1) the Pearson correlation coefficients be-
tween the MQF and several others (from the state-of-
the-art) are calculated and 2) the MQF is evaluated
by using an utility-based evaluation approach (Yao
et al., 2014). The experiment is performed with a
laptop driving by an Intel Celeron dual-core CPU of
1.73GHz. The experimental protocol is presented at
first.
3.1 Protocol et Database
In this study, several FVC databases with dif-
ferent resolutions (Maio et al., 2004) have
been used for experiments: FVC2000DB2A,
FVC2002DB2A, FVC2004DB1A, FVC2004DB2A
and FVC2004DB3A. The first database is established
by a low capacitive sensor and the last one relies on a
thermal sweeping sensor, while others are established
by several optical sensors, see table 1 for details.
Table 1: Details of databases.
DB Sensor Type Resolution Image Dim
00DB2A Capacitive 500dpi 256×364
02DB2A Optical 569dpi 296×560
04DB1A Optical 500dpi 480×640
04DB2A Optical 500dpi 328×364
04DB3A Thermal 512dpi 300×480
Each of these databases involves 100 fingerprints,
and 8 samples for each fingerprint. In this case,
the matching scores involved in the experiment have
been calculated by using the NBIS tool (Watson
et al., 2007), Bozorth3. The intra-class scores con-
tain 7×100 = 700 genuine scores, and the inter-
class scores consist of 7×99×100 = 69300 impos-
tor scores for the whole database. Minutiae templates
used in the experiment were also extracted by us-
ing the NBIS tool, MINDTCT. This software gen-
erates a quadruple representation of minutia point,
m
i
= {x, y, o, q}, where (x, y) is the location of minutia
point, o indicates orientation and q is a quality score
of minutia point. In the experiment, the location has
been used only for calculating the proposed quality
metric.
3.2 Parameter Settings
Fernandez et al. (Alonso-Fernandez et al., 2007)
and Olsen (Olsen et al., 2012) respectively calcu-
lated Pearson and Spearman correlation coefficients
between different quality metrics to observe their
behavior. Similarly, we investigate the behavior of
the proposed quality metric through the Pearson
correlation coefficients, by which the parameters are
appropriately selected as well.
QualityAssessmentofFingerprintswithMinutiaeDelaunayTriangulation
317
The three thresholds (Y
p
, Y
a
and Y
r
) are all empir-
ical values observed in the experiments and they are
all dependent on the resolution of the image which is
supposed to be over 500 dpi in this study. With the
experiment, we noted that the smallest area of the tri-
angles of each template is generally less than 70 (con-
sidering a histogram of 100 bins). This value is only
a scalar without considering the unit of the measure-
ment. In this case, we firstly preferred to choose a
value of the area over 70. In addition, it is easy to
observe that a threshold larger than 80 may loose the
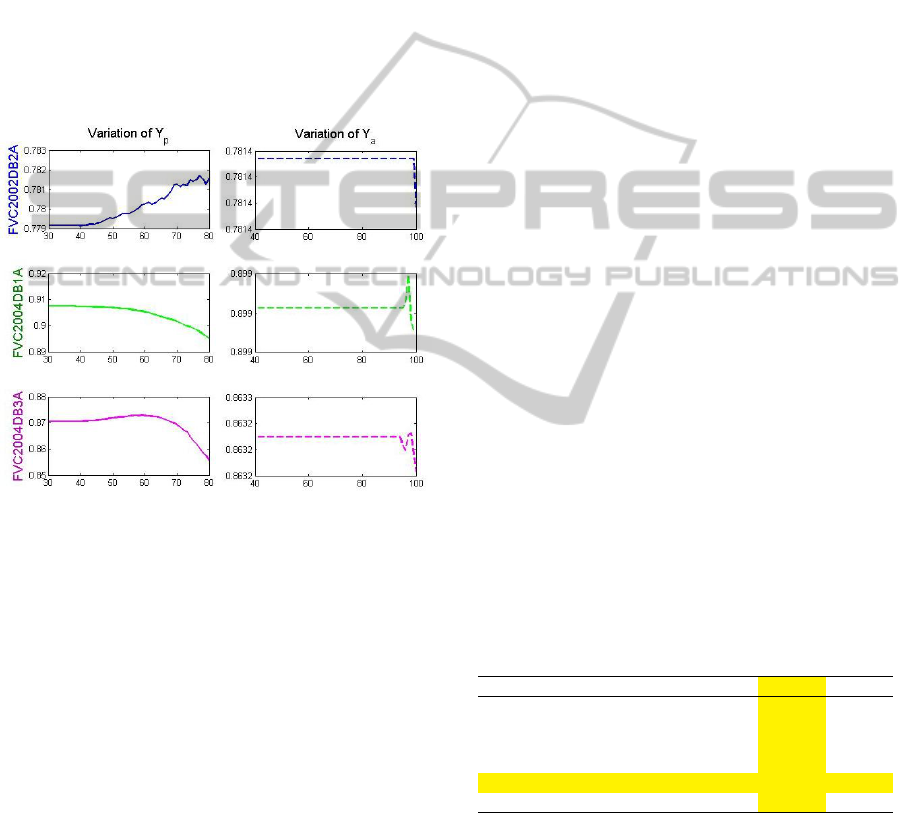
significance of this parameter. The variation of the
correlation values (larger than 0.3) demonstrates this
problem, see figure 4.
Figure 4: The variation of correlation between the proposed
metric and OCL as the parameter changes.
Likewise, the smallest perimeter value of the tri-
angles of each template is mostly within the interval
[10, 80], and generally lies around 35 (according to
the histogram). In this case, we further consider the
relation between the area and the perimeter of those
triangles that seemed abnormal. Without considering
the unit of the two measurements (one is 1-D and
another is 2-D), we observed that the value of the
perimeter is generally smaller than the area. In this
case, inspiring by the Heron’s formula, we choose
a threshold to represent the ratio between these two
measurements. We observed that the triangle is
extremely narrow if the ratio between a perimeter
and an area is close to 1. Besides, similarly, it is
also not necessary to consider larger values for the
perimeter. We first choose a reference quality metric
among all the others. The correlation of OCL doesn’t
vary so much on variant databases. Therefore, we
simply choose the OCL in the experiment. Figure 4
provides only the graphical result of the variation of
correlation value between OCL and the quality metric
obtained with a series values of two parameters. In
the experiments, the thresholds of the area and
perimeter vary in the range of [40, 100] and [30, 80]
with an interval of 1, respectively.
According to figure 4, we also observed that the
variation of Y
p
leads to more impacts on the corre-
lation coefficient than Y
a
when other parameters had
been set approximately. In order to achieve a general-
ity of the proposed quality metric, the values of Y
p
, Y
a
and Y
r
in this study are 75, 70 and 0.8, respectively.
At last, the behavior of these parameters were esti-
mated by using performance validation approach, and
the variation of the performance measurement (EER)
obtained in a small interval of each of them tends to be
stagnant. With this empirical analysis, the parameters
are set as what had just been mentioned.
3.3 Feature Analysis
To validate the MQF, we calculate the correlation co-
efficients between several quality metrics we have
studied including the MQF. In addition to the two
orientation-based indexes, OCL and the orientation
flow (OF) (Lim et al., 2002), we also employ a
wavelet domain feature carried out via the Pet Hat’s
continuous wavelet (PHCWT) (Nanni and Lumini,
2007). In the literature, it is said that the Pet Hat
wavelet is sensitive to the sharp variations of features
such as fingerprint ridges. Nevertheless, we also use a
pixel-based quality metric which is the standard devi-
ation (STD) of fingerprint local block indicating pixel
information of the image (Lee et al., 2005). The NFIQ
is also involved in this section. Table 2 presents the
correlation results of the trial quality metrics.
Table 2: Inter-class Pearson correlation coefficients.
FVC2002DB2A
OCL OF PHCWT STD MQF NFIQ
1 0.013 0.932 0.892 0.781 -0.503
0.013 1 0.092 0.122 0.070 0.061
0.932 0.092 1 0.954 0.788 -0.474
0.892 0.122 0.954 1 0.678 -0.374
0.781 0.070 0.788 0.678 1 -0.422
-0.503 0.061 -0.474 -0.374 -0.422 1
Table 2 provides only an inter-class correlation re-
sult of the employed quality metrics obtained from
FVC2002DB2A. According to the coefficient values
indicated with the highlighted cells, one can observe
that MQF demonstrates the correlated behavior with
the others except the OF. The correlation coefficients
between the proposed metric and others calculated
from the remaining databases are given in table 3
ICISSP2015-1stInternationalConferenceonInformationSystemsSecurityandPrivacy
318
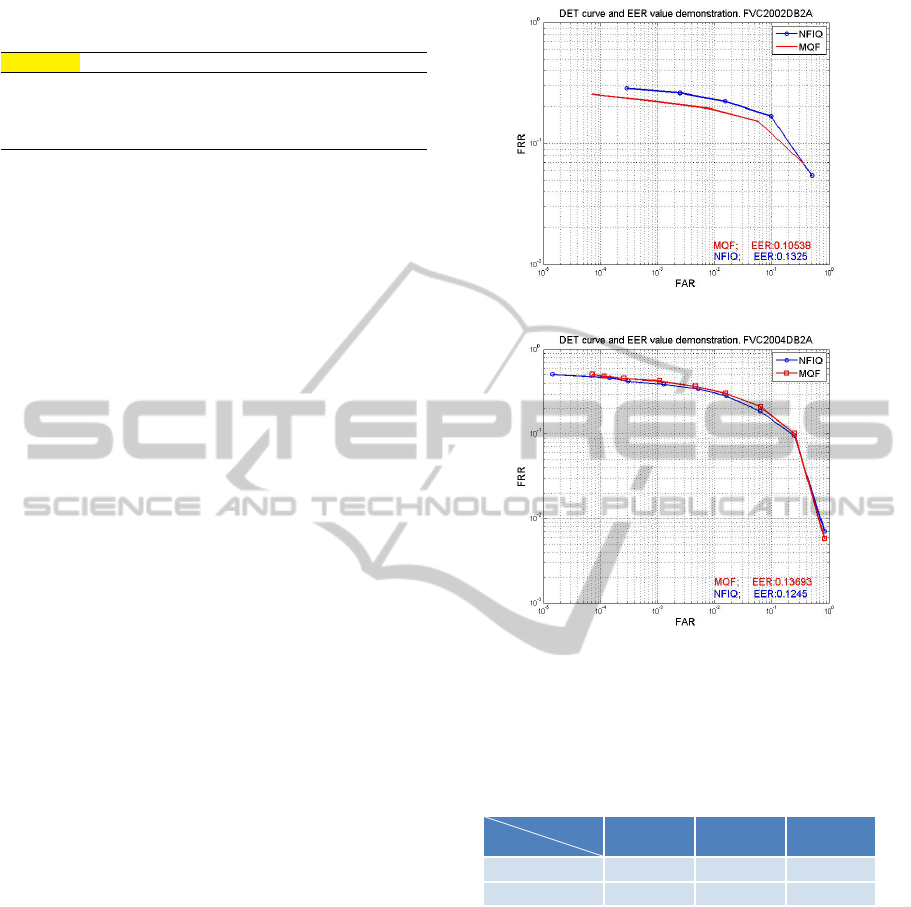
Table 3: Pearson correlation coefficients between MQF and
others.
MQF of OCL OF PHCWT STD NFIQ
00DB2 0.409 -0.131 0.291 0.301 -0.081
04DB1 0.899 0.253 0.905 0.817 -0.201
04DB2 -0.050 -0.489 0.722 0.650 -0.378
04DB3 0.863 0.021 0.818 0.811 -0.363
According to the results, in addition to
FVC2000DB2A, one can note that MQF shows
a relatively stable correlation with other metrics, i.e.
it exhibits an usability to variant databases. The cor-
relation value between the proposed metric and OCL
for FVC2004DB2A shows an odd value because
a lot of over-inked samples are contained in this
database. This problem results in some difficulties
for calculating the OCL and leads to a lot of singular
values. Note that the proposed metric uses only the
set of minutiae location, and the fingerprint image is
considered as unavailable.
3.4 Evaluation
According to the literature (Grother and Tabassi,
2007), the quality measure of a biometric sample is
generally employed within 3 different cases: 1) in-
cluding enrollment phase, 2) verification task and 3)
identification. Enrollment is known as a supervised
task for getting relatively good quality samples. The
purpose for doing so is to guarantee the performance
or reduce the recognition error as much as possible,
i.e. the typical quality control operation. However,
if the purpose is to validate a quality metric without
considering the testing type (i.e. algorithm testing,
scenario testing and so on.), the variation of the qual-
ity of enrollment sample would generate distinctive
impacts on matching performance and the result is re-
peatable in the experiments. In this case, to estimate
the validity of the MQF, an enrollment phase evalu-
ation approach is applied to the quality metric (Yao
et al., 2014).
We computed the EER values of all the trial
databases by choosing the best quality samples as the
enrollments (in terms of quality value generated by
MQF and NFIQ). A valid quality metric for choos-
ing the enrollment samples should reduce error rates.
Two graphs with the logarithmic curves and the EER
values of two different cases are given in figure 5 to
illustrate the enrollment selection strategy.
In figure 5, the EER values of the two datasets
based on NFIQ are 13.2% (02DB2A) and 12.4%
(04DB2A), while the values corresponding to MQF
are: 10.5% (02DB2A), and 13.6% (04DB2A), respec-
tively.
(a) FVC2002DB2A
(b) FVC2004DB2A
Figure 5: The DET curves and global level EER val-
ues obtained by using the evaluation approach. 5a is
FVC2002DB2A; 5b is FVC2004DB2A.
Table 4: The average EER values based-on enrollment se-
lection.
QM
DB
00DB2A 04DB1A 04DB3A
MQF 5.05% 15.03% 6.96%
NFIQ 4.98% 15.33% 7.48%
According to this result, the performance of MQF
is validated with the property that a good quality in-
dex reduces the matching error. However, a further
validation needs to be acquired for making a conclu-
sion that the global EER value is a statistically ob-
jective measurement of the performance. To do so,
we calculate a confidence interval (CI) (Giot et al.,
2013) at 95% level for the global EER values based
on different quality metrics. In biometrics, the CI of
two different measurements are able to indicate the
statistical difference between them if their confidence
intervals do not overlap each other. The CI values of
the EER for each quality metric is calculated via a set
of randomly selected intra-class and inter-class score
QualityAssessmentofFingerprintswithMinutiaeDelaunayTriangulation
319
samples after enrollment selection. The size of each
kind of randomly selected matching scores is 500, and
hence the 95% CI is obtained with 1000 samples of
the EER values, i.e. this random selection has been
performed for 1000 iterations to calculate EER sam-
ples. Table 4 provides the average EER values of the
other 3 databases.
Table 5: The 95% confidence interval of the EERs.
DB
QM
MQF NFIQ
00DB2A (CI) [0.0498 0.0510] [0.0492 0.0502]
02DB2A (CI) [0.1101 0.1118] [0.1323 0.1337]
04DB1A (CI) [0.1493 0.1509] [0.1531 0.1548]
04DB2A (CI) [0.1509 0.1535] [0.1318 0.1340]
04DB3A (CI) [0.0683 0.0694] [0.0742 0.0754]
In table 5, the CI of the EER values based on the
two quality metrics statistically illustrates the validity
of the proposed quality metric. The overlap happened
to FVC2000DB2A, for the EER values obtained from
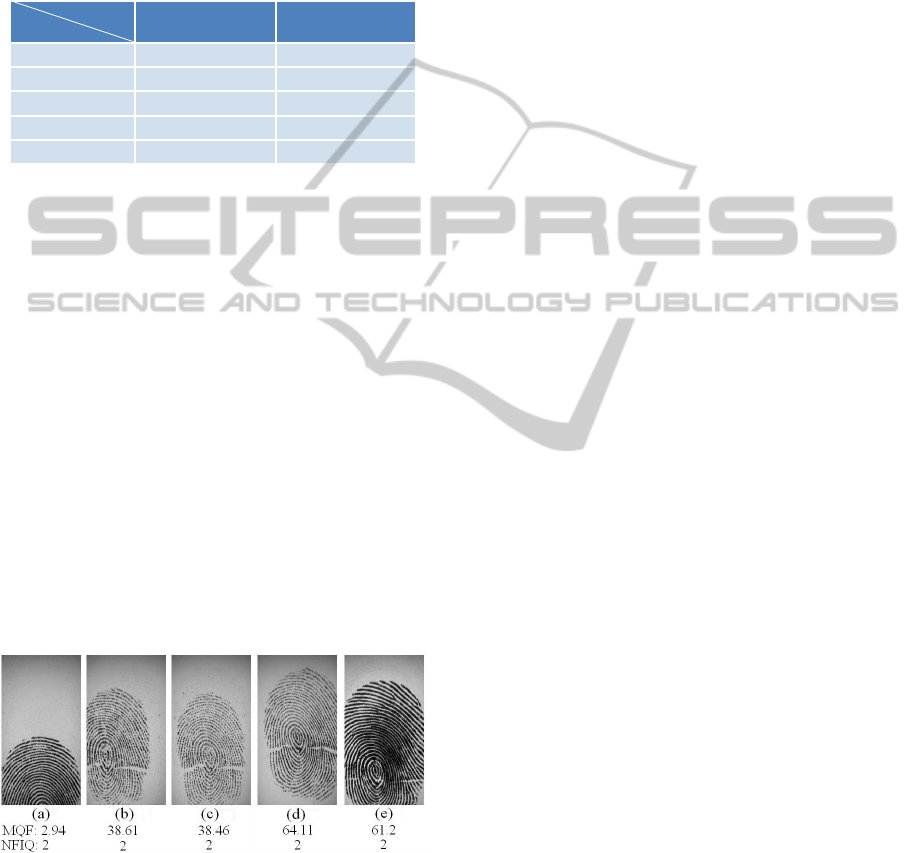
this database is nearly the same. Moreover, we sim-
ply choose several images to illustrate the differences
between the two quality metrics and their drawbacks.
For instance, the MQF values of the samples given in
figure 6 are (2.94, 38.61, 38.46, 64.11, 61.2), and
their NFIQ values are all level 2. According to sam-
ple (a), one can find that it contains only a partial of
the fingerprint image which is not suitable for match-
ing. In addition, the samples with MQF values under
40 are not as good as a level 2 sample in this exam-
ple. The samples (b) and (c) would result in spurious
minutiae. On the other hand, an obvious shortage of
MQF is the area measurement which would generate
outliers in many cases, such as the samples illustrated
by figure 6 (d) and (e).
Figure 6: Illustration of the different between MQF and
NFIQ.
The experiments are implemented via Matlab
7.12. The computation takes approximately 0.423
seconds per sample according to a calculation of 1600
samples when the input is image, and 0.122 seconds
for template inputs.
4 CONCLUSION
This study mainly focuses on estimating fingerprint
quality simply with a minutiae template. By investi-
gating the relation between image-based quality crite-
ria and the structure of minutiae template, we calcu-
late the area of minutiae region via a convex hull and
the Delaunay triangulation. The uniqueness of Delau-
nay triangulation provides a possibility that some un-
reasonable minutiae could be further eliminated from
template, and the particular rules for calculating con-
vex hull enables estimating a relatively minimum area
of the detected minutiae. Accordingly, we define
a simple yet efficient quality metric for fingerprint
and minutiae template. In another aspect, the quality
metric could be affected by some bad samples with
large minutiae region. The lack of image informa-
tion makes this problem inevitable. Correspondingly,
we analyzed the proposed quality metric via Pearson
correlation coefficients and evaluated its performance
with an enrollment phase approach. Therefore, it is
reasonable to conclude that the proposed quality met-
ric is an effective measurement for assessing the qual-
ity of a various of fingerprint samples when their as-
sociated templates are available only.
As fingerprint quality metric is generally defined
with multiple features, this quality metric therefore
could be a candidate for those composite metrics. The
future work of this study tends to concentrate on com-
bining this quality metric with some others extracted
from minutiae template to obtain better performance.
REFERENCES
Alonso-Fernandez, F., Fierrez, J., Ortega-Garcia, J.,
Gonzalez-Rodriguez, J., Fronthaler, H., Kollreider,
K., and Bigun, J. (2007). A comparative study of
fingerprint image-quality estimation methods. Infor-
mation Forensics and Security, IEEE Transactions on,
2(4):734–743.
Andrew, A. M. (1979). Another efficient algorithm for con-
vex hulls in two dimensions. Information Processing
Letters, 9(5):216–219.
Aufmann, R., Barker, V., and Nation, R. (2007). College
Trigonometry. Cengage Learning.
Bolle, R. M., Pankanti, S. U., and Yao, Y.-S. (1999). System
and method for determining the quality of fingerprint
images. US Patent 5,963,656.
Chen, T., Jiang, X., and Yau, W. (2004). Fingerprint image
quality analysis. In Image Processing, 2004. ICIP ’04.
2004 International Conference on, volume 2, pages
1253–1256 Vol.2.
Delaunay, B. (1934). Sur la sphere vide. Izv. Akad.
Nauk SSSR, Otdelenie Matematicheskii i Estestven-
nyka Nauk, 7(793-800):1–2.
ICISSP2015-1stInternationalConferenceonInformationSystemsSecurityandPrivacy
320

Feng, J. and Jain, A. K. (2011). Fingerprint reconstruction:
from minutiae to phase. Pattern Analysis and Machine
Intelligence, IEEE Transactions on, 33(2):209–223.
Giot, R., El-Abed, M., and Rosenberger, C. (2013). Fast
computation of the performance evaluation of biomet-
ric systems: Application to multibiometrics. Future
Gener. Comput. Syst., 29(3):788–799.
Grother, P. and Tabassi, E. (2007). Performance of biomet-
ric quality measures. Pattern Analysis and Machine
Intelligence, IEEE Transactions on, 29(4):531–543.
Lee, B., Moon, J., and Kim, H. (2005). A novel measure
of fingerprint image quality using the Fourier spec-
trum. In Jain, A. K. and Ratha, N. K., editors, Society
of Photo-Optical Instrumentation Engineers (SPIE)
Conference Series, volume 5779 of Society of Photo-
Optical Instrumentation Engineers (SPIE) Conference
Series, pages 105–112.
Lim, E., Jiang, X., and Yau, W. (2002). Fingerprint qual-
ity and validity analysis. In Image Processing. 2002.
Proceedings. 2002 International Conference on, vol-
ume 1, pages I–469–I–472 vol.1.
Maio, D., Maltoni, D., Cappelli, R., Wayman, J. L., and J.,
A. K. (2004). Fvc2004: Third fingerprint verification
competition. In Biometric Authentication, pages 1–7.
Springer.
Maltoni, D., Maio, D., Jain, A. K., and Prabhakar, S. (2009).
Handbook of fingerprint recognition. Springer.
Nanni, L. and Lumini, A. (2007). A hybrid wavelet-
based fingerprint matcher. Pattern Recognition,
40(11):3146–3151.
Olsen, M., Xu, H., and Busch, C. (2012). Gabor filters as
candidate quality measure for NFIQ 2.0. In Biomet-
rics (ICB), 2012 5th IAPR International Conference
on, pages 158–163.
Ratha, N. K. and Bolle, R. (1999). Fingerprint image qual-
ity estimation. IBM TJ Watson Research Center.
Staff, B. S. I. (2009). Information Technology. Biometric
Sample Quality. Framework. B S I Standards.
Tabassi, E., Wilson, C., and Watson, C. (2004). NIST fin-
gerprint image quality. NIST Res. Rep. NISTIR7151.
Watson, C. I., Garris, M. D., Tabassi, E., Wilson, C. L.,
Mccabe, R. M., Janet, S., and Ko, K. (2007). User’s
guide to nist biometric image software (nbis).
Yao, Z., Charrier, C., and Rosenberger, C. (2014). Util-
ity validation of a new fingerprint quality metric.
In International Biometric Performance Conference
2014. National Insititute of Standard and Technology
(NIST).
Zhao, Q., Liu, F., and Zhang, D. (2010). A comparative
study on quality assessment of high resolution finger-
print images. In Image Processing (ICIP), 2010 17th
IEEE International Conference on, pages 3089–3092.
IEEE.
QualityAssessmentofFingerprintswithMinutiaeDelaunayTriangulation
321
