
The Gradient Product Transform for Symmetry Detection and Blood
Vessel Extraction
Christoph Dalitz, Regina Pohle-Fr
¨
ohlich, Fabian Schmitt and Manuel Jeltsch
Institute for Pattern Recognition, Niederrhein Univerity of Applied Sciences, Reinarzstr. 49, 47805 Krefeld, Germany
Keywords:
Symmetry Detection, Image Filtering, Blood Vessels, Vesselness Filter, Angiography.
Abstract:
The “gradient product transform” is a recently proposed image filter for assigning each image point a symmetry
score based on scalar products of gradients. In this article, we show that the originally suggested method for
finding the radius of the symmetry region is unreliable, and a more robust method is presented. Moreover, we
extend the symmetry transform to rectangular symmetry regions so that it is more robust with respect to skew,
and the transform is generalised to also work with three dimensional image data. We apply the transform
to two different problems: detection of objects with rotational symmetry, and blood vessel extraction from
medical images. In an experimental comparison with other solutions for these problems, the gradient product
transform performs comparable to the best known algorithm for rotational symmetry detection, and better than
the vesselness filter for blood vessel extraction.
1 INTRODUCTION
A symmetry is a geometric transformation under
which a subset of an image is invariant. Formally,
when f (~x) is the pixel value at position ~x, then a re-
gion Ω is symmetric under the transformation σ if
f (σ(~x)) = f (~x) for all ~x ∈ Ω (1)
The class of the transformation σ defines the symme-
try type: reflection, rotation, or translation. In Fig-
ure 1, the symmetry region Ω is the church window
and it is invariant under reflections at the six yellow
axes, and also under rotations with angles α = k ·2π/6
around the intersection point of the axes. Rotations by
multiples of 2π/m form the symmetry group C
m
, with
the special case C
∞
denoting rotation invariance under
arbitrary angles.
A survey of symmetry detection algorithms can
be found in (Liu et al., 2010). Generally, these algo-
rithms assign each image point a “symmetry score”
that measures how suitable the point is as a symmetry
centre. The image of symmetry score values thus rep-
resents a “symmetry transform”, and symmetry points
correspond to maxima in the symmetry transform im-
age. The computation of the symmetry score depends
on the type of symmetry and is specific to each algo-
rithm.
For detecting C
2m
(point reflection) symmetries in
greyscale images, Dalitz et al. have recently proposed
an algorithm that is based on scalar products of grey
value gradients at corresponding positions. Let us call
the resulting symmetry transform the gradient prod-
uct transform. In (Dalitz et al., 2013), this transform
was defined based on a square shaped mask and meth-
ods were given for determining the size of the symme-
try region and for discriminating between rotational
symmetries and axial symmetries. The latter can be
useful for finding actual rotation symmetries, because
reflection symmetries can also show up as C
2
symme-
tries (see Figure 2).
The gradient product transform was reported in
(Dalitz et al., 2013) to perform comparable to or even
better than the method by Loy & Eklundh (Loy and
Figure 1: A symmetric object. The church window shows
reflection symmetries according to the yellow axes and a C
6
rotation symmetry.
177
Dalitz C., Pohle-Fröhlich R., Schmitt F. and Jeltsch M..
The Gradient Product Transform for Symmetry Detection and Blood Vessel Extraction.
DOI: 10.5220/0005234101770184
In Proceedings of the 10th International Conference on Computer Vision Theory and Applications (VISAPP-2015), pages 177-184
ISBN: 978-989-758-090-1
Copyright
c
2015 SCITEPRESS (Science and Technology Publications, Lda.)

π
axis
rotation by
symmetry
Figure 2: A C
2
symmetry that also is a reflection symmetry.
Eklundh, 2006), an algorithm that performed best in
several comparative studies (Rauschert et al., 2011;
Park et al., 2008; Liu et al., 2013). Nevertheless,
there are still two shortcomings of the gradient prod-
uct transform as defined by Dalitz et al., which we
address in the present article. The first is that its def-
inition is based upon square shaped regions, which is
not appropriate for non circular point symmetric ob-
jects and which also makes the symmetry transform
very sensible to skew. We therefore generalise the
transform to work with rectangular regions and give
a recursion formula that allows for an efficient com-
putation of the transform.
The other shortcoming is that the original method
for determining the size of the symmetry region is not
very robust. In (Dalitz et al., 2013), it is defined as
the radius with the highest occurring symmetry score,
which worked in the experiments because the radii
used for testing were not greater than the largest sym-
metric object in each image. In this article we demon-
strate however that the symmetry score tends to in-
crease with the size of the trial region, even when
the size goes beyond the actual symmetry region. In
other words, the detected symmetry size for the origi-
nal method is generally simply the largest radius tried
out. We therefore propose a normalisation that reme-
dies this problem.
Comparative studies on symmetry detection usu-
ally discuss and evaluate symmetry transforms as
a means for locating symmetric objects within
an unsymmetrical environment (Park et al., 2008;
Rauschert et al., 2011; Liu et al., 2013), thereby only
taking the location of maxima of a symmetry trans-
form into account. From a more general viewpoint,
the symmetry transform can alternatively be consid-
ered as an image filter that transforms a greyscale im-
age into an image of symmetry scores. To demon-
strate the usefulness of such a filter, we apply the gra-
dient product transform as a preprocessing operation
to retina fundus photographs and show that blood ves-
sels can be easily extracted from this filtered image.
In the preliminary study (Pohle-Fr
¨
ohlich and Stalder,
2014), Pohle-Fr
¨
ohlich & Stalder have demonstrated
that the gradient product transform can be useful for
blood vessel extraction in 3D medical images. In the
present article, we do a systematic evaluation of the
gradient product transform performance on the 2D
dataset of retina images by Staal et al. (Staal et al.,
2004) and compare it to the standard algorithm for
blood vessel extraction, the vesselness filter (Drech-
sler and Laura, 2010).
2 THE GRADIENT PRODUCT
TRANSFORM
The gradient product transform first computes for
each image point ~x = (x,y) of a greyscale image and
for a range of radii ~r = (r
x
,r
y
) a symmetry score
s(~x,~r). From these values, an “optimal” radius
~
R(~x) =
(R
x
,R
y
) is determined for each image point, and the
final symmetry transform is then defined as S(~x) =
s(~x,
~
R(~x)). In (Dalitz et al., 2013), only the case of
square shaped symmetry regions was considered, i.e.
r
x
= r
y
. Here we give formulae for the general case.
Section 2.1 describes the computation of s(~x,~r),
Section 2.2 defines a criterion for selecting
~
R(~x), and
in Section 2.3 we give a criterion for discriminating
between axial and actual rotational symmetries.
2.1 Symmetry Score
Although homogeneous regions comply with the
symmetry definition (1), they are of little interest for
symmetry detection, because objects are better char-
acterised by their edges. The starting point of the
symmetry score computation is thus the gradient im-
age
~
G(~x), which can be computed from a greyscale
image, e.g., with a Sobel filter.The symmetry score
formula is based on two observations:
• under point reflection symmetry, the mirrored gra-
dient
~
G
0
is anti-parallel to the gradient
~
G (see Fig-
ure 3)
• the scalar product h
~
G,
~
G
0
i is minimal for
~
G
0
= −
~
G
The symmetry score for the rectangle with circum-
radius ~r = (r
x
,r
y
) around the centre point ~x = (x,y),
i.e., the rectangle with upper left~x −~r and lower right
x + d
G
= −
G
→
→→
G ′
x
→
→
→
→
x − d
→
Figure 3: Effect of a point reflection at ~x on the gradient.
The gradient
~
G at ~x +
~
d is mapped onto the gradient
~
G
0
=
−
~
G at ~x −
~
d.
VISAPP2015-InternationalConferenceonComputerVisionTheoryandApplications
178
~x +~r, is therefore defined as
s(~x,~r) = −
r
x
∑
d
x
=1
D
~
G(d
x
,0),
~
G(−d
x
,0)
E
−
r
y
∑
d
y
=1
r
x
∑
d
x
=−r
x
D
~
G(d
x
,d
y
),
~
G(−d
x
,−d
y
)
E
(2)
where
~
G(d
x
,d
y
) denotes the gradient at position (x +
d
x
,y + d
y
). The sum is split up so that each point pair
only occurs once, and the minus sign is added for con-
venience so that a higher symmetry corresponds to a
higher score value, not vice versa. As the size of the
symmetry region is not known in advance, the score
(2) must be computed for all radii 1 ≤ r
x
,r
y
≤ r
max
.
All scores s(~x,~r) can be computed in a single run over
the symmetry region with the following recursion for-
mula for r
x
,r
y
> 1:
s
~x,(r
x
,r
y
)
= s
~x,(r
x
− 1,r
y
)
(3)
+s
~x,(r
x
,r
y
− 1)
−s
~x,(r
x
− 1,r
y
− 1)
−h
~
G(r
x
,r
y
),
~
G(−r
x
,−r
y
)i
−h
~
G(r
x
,−r
y
),
~
G(−r
x
,r
y
)i
The computation of all scores up to a radius r
max
thus only requires O(r
2
max
) additions, not O(r
4
max
) that
would be required by a na
¨
ıve application of Eq. (2).
To generalise Eq. (2) to more than two dimensions, it
is more convenient to notate the formula in a compact
vector notation:
s(~x,~r) = −
1
2
∑
~
d∈Ω(−~r,~r)
~
d6=
~
0
D
~
G(
~
d),
~
G(−
~
d)
E
(4)
where
~
G(
~
d) denotes the greyscale gradient at position
~x +
~
d, and Ω(−~r,~r) denotes the region of the rectangle
or cuboid with corners −~r and~r. The factor 1/2 com-
pensates for the fact that each pair of corresponding
mirror points occurs twice in the sum. Eq. (4) holds
for any dimension.
2.2 Symmetry Size
When the symmetry score (2) is computed for a range
of circumradii ~r, the question arises which of these
radii represents the size of the symmetry region. In
(Dalitz et al., 2013), Dalitz et al. suggested to simply
take the radius with the highest score, which would be
for our generalised case of rectangular regions
~
R = arg
~r
max{s(~x,~r) | max(r
x
,r
y
) ≤ r
max
} (5)
−α
(r/r )
0
s(r) / s(r )
0
r / r
0
0
0.2
0.4
0.6
0.8
1
1.2
1.4
0 0.5 1 1.5 2
α = 0.0
α = 0.5
α = 1.0
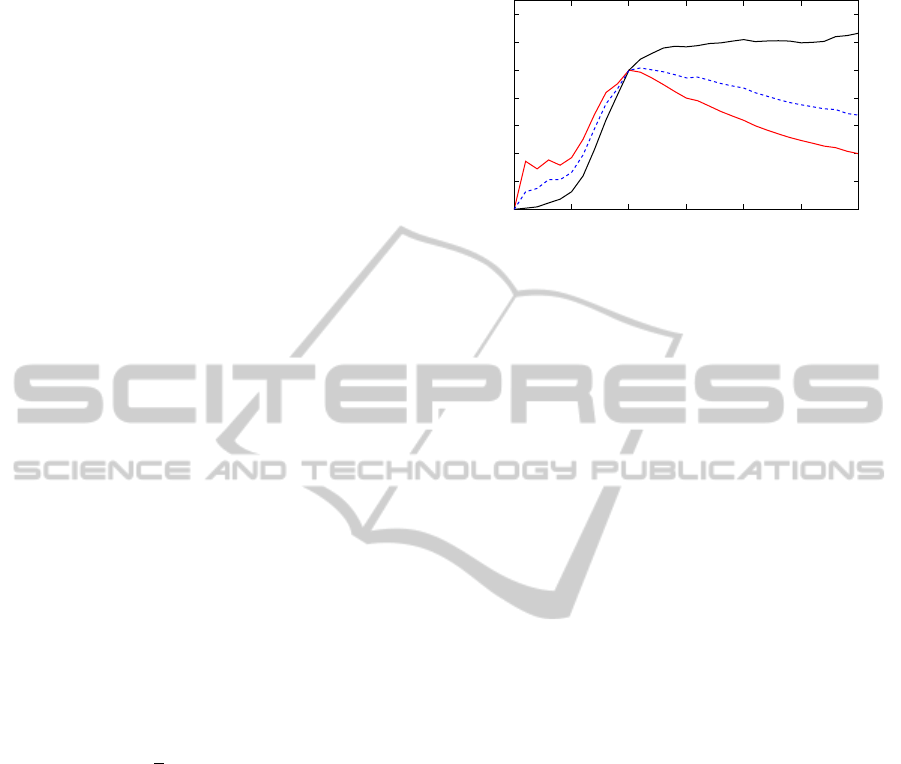
Figure 4: Symmetry score as a function of the radius. On
average, the symmetry score s(r) increases with r even
when r becomes larger than the actual size r
0
of the sym-
metric object. Division by a factor r
α
can compensate for
this effect.
The problem with this definition is that it tends to pick
a radius quite close to r
max
, even when the actual sym-
metric object is much smaller. To understand this phe-
nomenon, we have computed the symmetry score as
a function of the radius r with square shaped regions
(r
x
= r
y
= r) for all ground truth symmetry points in
the data set (Dalitz et al., 2013). To make the mea-
surements comparable, we have normalised all radii
with the ground truth radius r
0
, and all scores with
the score S(r
0
). As can be seen in Figure 4 (curve for
α = 0), the score increases steeply for r ≤ r
0
, as ex-
pected, but still increases as r becomes larger than r
0
,
albeit not as steep. This is simply due to the fact that
the number of summands in (2) grows with r so that
random fluctuations can increase the sum.
To remedy this problem, the symmetry score
needs to be normalised by a factor that depends on~r.
Even though the number of summands in (2) is pro-
portional to the area of the symmetry region, which is
r
x
· r
y
, only scalar products with large gradients will
contribute significantly to the sum. As the gradient
is large for edges, and the number of edge points is
proportional to the surface of the symmetry region,
it seems natural to normalise with r
x
+ r
y
. As can
be seen from the curve for α = 1.0 in Figure 4, this
indeed leads on average to a maximum score at the
actual symmetry size, but it also has the side effects
that the score values of small symmetry regions are
increased.
To control the trade off between these two effects,
we normalise with (r
x
+r
y
)
α
, where α = 0.5 is a com-
promise between both effects. The effect of the choice
of α on the symmetry radius detection can be seen in
Figure 5, where we have set r
max
to the size of the im-
age. We therefore define the optimum circumradius
~
R = (R
x
,R
Y
) and the resulting symmetry transform
value S at position~x as
TheGradientProductTransformforSymmetryDetectionandBloodVesselExtraction
179
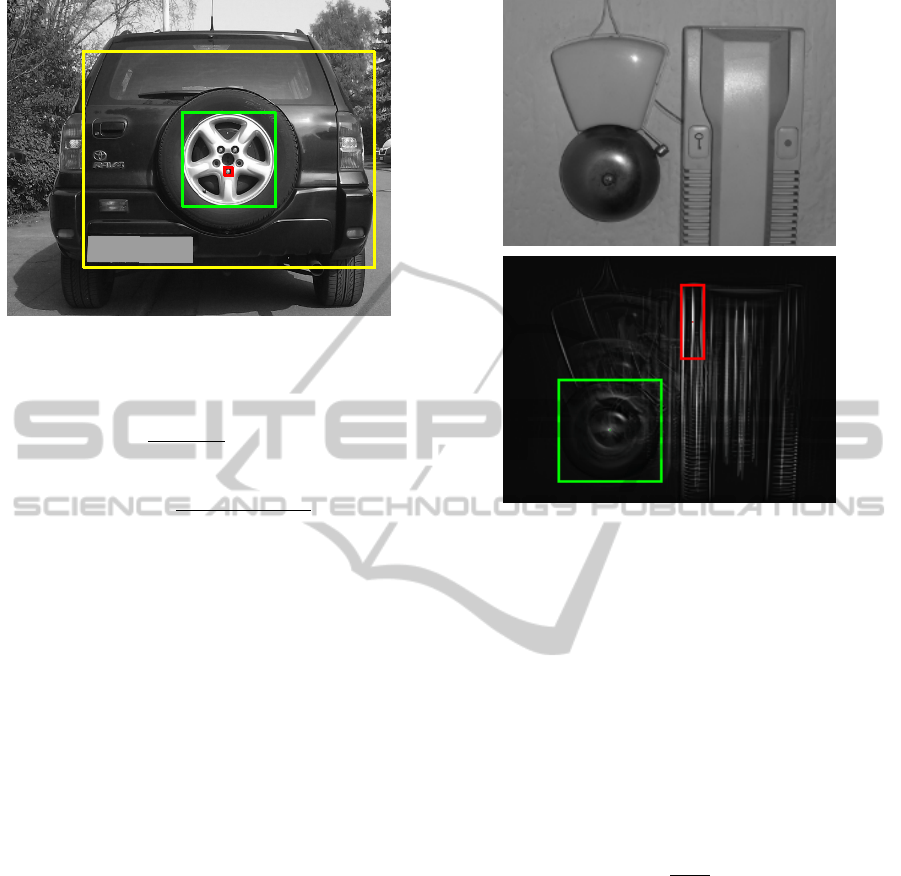
Figure 5: Impact of α on the symmetry radius determina-
tion. Symmetry circumradius around the highest symmetry
score in the image with α = 0 (yellow), α = 0.5 (green),
and α = 1.0 (red).
~
R(~x) = arg
~r
max
s(~x,~r)
(r
x
+ r
y
)
α
max(r
x
,r
y
) ≤ r
max
and S(~x) =
s(~x,
~
R(~x))
(R
x
(~x) + R
y
(~x))
α
(6)
For more than two dimensions, the normalisation de-
nominator (r
x
+ r
y
)
α
in Eq. (6) must be replaced with
(
∑
n
i=1
|r
i
|)
α
for the circumradius~r = (r
1
,...,r
n
).
2.3 Symmetry Type
As already pointed out in the introduction (see Figure
2 above), some axial symmetries can also be C
2
sym-
metries. A practical example can be seen in Figure 6:
the highest local maximum in the symmetry transform
corresponds to the region highlighted in red, which
has both a C
2
and an axial symmetry, while the second
highest local maximum in the symmetry transform
corresponds to the C
∞
symmetry highlighted in green.
In (Dalitz et al., 2013), a simple threshold based dis-
crimination between these two types of symmetry was
proposed, based upon the edge directedness in the
neighbourhood of the symmetry centre (the threshold
was set to 0.27).
In this section, we investigate this discrimination
in more detail with a quadratic discriminant analysis.
As can be seen from the symmetry transform image
in Figure 6, for axial symmetries the entire symme-
try axis tends to obtain high symmetry scores, while
for pure rotational symmetries the symmetry score de-
cays with the distance to the symmetry centre inde-
pendent from the direction. We therefore compute the
following features for a candidate symmetry centre ~x,
i.e., for a local maximum of the symmetry score S(~x):
Edge Directedness. This feature is based on the angle
histogram of the gradients of the symmetry trans-
Figure 6: Symmetry transform of a sample image. The two
highest symmetry scores and the corresponding circumradii
according to Eq. (6) with α = 0.5.
form in a k × k window centred at ~x. We compute
the gradients by applying a Sobel filter to the sym-
metry transform and build a weighted histogram
with 16 bins of the gradient angles. Each angle is
weighted in the histogram with the corresponding
absolute value of the gradient. The edge directed-
ness is then defined as the highest occurring fre-
quency in this histogram, and it should be higher
for axial symmetries.
Skeleton Size. Starting from~x, we follow the skeleton
until the score falls below a percentage p of S(~x).
The feature is then the ratio between the skeleton
length and the size
p
h~r,~ri of the symmetry re-
gion, where~r is the circumradius of the symmetry
region. It should be higher for axial symmetries.
Antiparallel Directions. This feature is based on the
gradient of the original greyscale image. We com-
pute the direction histogram with eight bins of all
gradients in a window with the radius min{R
x
,R
y
}
according to Eq. (6). Only those gradients are
taken into account for which the mirrored gradi-
ent is “antiparallel”, i.e. the cosine of the angles
between the gradients is less than -0.975. The fea-
ture is the highest relative frequency in the direc-
tion histogram. The value for “antiparallel direc-
tions” should be lower for rotational symmetries.
Covariance Eigenratio. For the points in a k ×k win-
dow around (x,y) in the symmetry transform im-
VISAPP2015-InternationalConferenceonComputerVisionTheoryandApplications
180

Scatter Plot Matrix
edge_dir
0.4
0.5
0.6
0.7
0.4 0.5 0.6 0.7
0.1
0.2
0.3
0.4
0.1 0.2 0.3 0.4
skel_size
0.6
0.8
1.0
0.6 0.8 1.0
0.0
0.2
0.4
0.0 0.2 0.4
anti_par
0.4
0.5
0.4 0.5
0.2
0.3
0.2 0.3
cov_ratio
0.6
0.8
1.0
0.6 0.8 1.0
0.0
0.2
0.4
0.0 0.2 0.4
Figure 7: Scatterplots for the four features for symmetry
type discrimination. The blue points belong to axial sym-
metries, the magenta points to rotational symmetries.
age, we compute the covariance matrix K as
K =
1
N
k/2
∑
dx=−k/2
k/2
∑
dy=−k/2
S(x + dx, y + dy) (7)
×
dx dx dx dy
dy dx dy dy
where S(x,y) is the symmetry transform value at
(x,y), and the normalisation factor N is the sum
over all symmetry values in the window. The
eigenvalues of K indicate how strongly the val-
ues spread in the direction of the corresponding
eigenvector. Consequently, the ratio between the
smaller and the larger eigenvalue should be higher
for rotational symmetry.
The data set (Dalitz et al., 2013) contains lists of
ground truth points that are labelled as either axial or
rotational symmetry centres, which provides a test set
for this classification tasks. The scatterplots in Figure
7 actually reveal the tendencies in the above descrip-
tions, but there is considerable overlap between the
classes. Nevertheless, the scatterplots indicate that it
is better to use more than one feature, and we there-
fore applied a quadratic discriminant analysis as im-
plemented in the MASS package of the R statistical
language
1
, which decides for the class with the largest
discriminant function
g
i
(~x) = −w
i
− k(~x −~µ
i
) ·W
i
k
2
(8)
where the index i ∈ {a,r} denotes the class (axial or
rotational) and ~x is the row vector of the four features
1
http://www.r-project.org
in the same order as in the list above. The parameters
~µ
i
, w
i
and W
i
were evaluated by the R function qda as
w
a
= −15.03338 w
r
= −21.49041 (9)
~µ
a
= (0.4334,0.4975, 0.4417,0.4352)
~µ
r
= (0.1859,0.0654, 0.2302,0.7136)
W
a
=
−9.3921 3.1451 7.8727 0.8677
0 −2.4364 0.3522 0.1780
0 0 −18.5275 3.1907
0 0 0 4.3365
W
r
=
14.3116 −6.1912 15.5453 −6.7814
0 20.3183 0.3754 −0.9648
0 0 −20.5954 −3.8730
0 0 0 −7.7489
In our experiments in Section 3.1, this quadratic
discrimination rule improved the recognition rates for
rotational symmetries by about 8% compared to the
simple decision rule based on the edge directedness
alone.
3 EXPERIMENTAL RESULTS
We have evaluated the usefulness of the gradient
product transform and compared it to other state-of-
the-art algorithms for two use cases: detection of ro-
tational objects in real world images, and extracting
the blood vessel skeleton from two-dimensional retina
fundus photographs. For the first problem, we have
chosen the algorithm by Loy & Eklundh (Loy and
Eklundh, 2006) as a reference, because it performed
best in different comparison studies (Rauschert et al.,
2011; Park et al., 2008; Liu et al., 2013). For the sec-
ond problem, we have chosen the vesselness filter as
a reference algorithm, because it is a widely utilised
general purpose algorithm for blood vessel extrac-
tion. In the comparative study (Drechsler and Laura,
2010), Drechsler et al. demonstrated that each of the
three vesselness filter variants (Frangi et al., 1998;
Sato et al., 1998; Erdt et al., 2008) has its strengths
and weaknesses. In our experiments, we have imple-
mented the filter by Frangi et al., because the retina
images were two-dimensional, and the filter by Frangi
et al. is the only vesselness filter that can also be ap-
plied to 2D images in a straightforward way.
3.1 Rotational Symmetry Detection
To evaluate the detection of rotational symmetric ob-
jects, we have used the dataset that was used in the
study (Dalitz et al., 2013), and that is freely available
on the Internet
2
. This dataset consists of 159 images
2
http://informatik.hsnr.de/∼dalitz/data/visapp13/
TheGradientProductTransformforSymmetryDetectionandBloodVesselExtraction
181

Table 1: Effect of the normalisation with α and the extension to nonsquare symmetry regions on the recognition rates for
symmetric objects in the test set (Dalitz et al., 2013). For comparison, the results for the reference algorithm by Loy &
Eklundh (Loy and Eklundh, 2006) are given. The last row gives the average area precision p
A
according to Eq. (10) for the
correctly detected objects.
square rectangular Loy &
Count α = 0 α = 0.5 α = 0 α = 0.5 Eklundh
Detail 83 0.58 0.60 0.59 0.58 0.37
Context 76 0.16 0.30 0.22 0.32 0.37
Front 43 0.51 0.63 0.56 0.53 0.70
Light skew 57 0.39 0.51 0.46 0.53 0.39
Strong skew 59 0.27 0.29 0.27 0.32 0.12
Total 159 0.38 0.46 0.42 0.45 0.37
Area precision 0.39 0.70 0.37 0.80
of size 600 ×400, showing 27 different subjects. Each
subject is shown in different perspectives and both in
context and in detail. This allowed us to investigate
how an algorithm performs under skew and contex-
tual noise.
For each image, we have computed all local max-
ima of the gradient product transform (r
max
= 300,
i.e. the maximum possible radius) and, among these,
searched for the highest value that was classified as
“rotational” by the quadratic discriminant analysis de-
scribed in Section 2.3. The algorithm took in total
about 3.6 sec per image on an Intel i7-4770 CPU
3.40GHz. When the position of this maximum had
a distance less than 10 pixels from a ground truth
symmetry point, we considered a symmetry to be cor-
rectly detected, otherwise it was an error. The result-
ing recognition rates are shown in Table 1. Compared
to the results in (Dalitz et al., 2013), which only used
no normalisation (α = 0) and square shaped regions
(r
x
= r
y
), the recognition rates in the corresponding
column are lower. This is because in the experiments
of (Dalitz et al., 2013), r
max
was set to the largest
ground truth symmetry radius for each image, thereby
introducing a priori bias, especially as for α = 0 the
symmetry radius tends to be selected as r
max
.
The recognition rates in Table 1 show that the nor-
malisation of the symmetry score with (r
x
+r
y
)
0.5
(see
the columns for α = 0.5) significantly improves the
symmetry detection for the images in the “context”
category, but has little effect for the “detail” category.
This is because for the context images, the radii of
the symmetry regions are typically much smaller than
r
max
, and are thus less likely to be found without nor-
malisation (α = 0). The detail images on the other
hand are mostly filled out by the symmetric object so
that the correct symmetry radius is close to r
max
.
A comparison of the recognition rates for square
shaped regions versus rectangular regions shows that
the extension to rectangular regions indeed improves
symmetry detection for skewed symmetries, indepen-
dent of the choice for α. For unskewed symmetries
in the category “front” which actually have a circular
symmetry region, the recognition rate for rectangular
regions was however 10% smaller for α = 0.5, due to
the larger search space for the optimum circumradius
(r
x
,r
y
). Depending on the application, it is thus rec-
ommendable to restrict the ratio r
x
/r
y
to a maximum
amount of permitted skew.
The recognition rates only measure whether the
location of a symmetry centre was correctly found,
but not whether the entire symmetry region has been
correctly detected. We have therefore additionally
measured the area precision of the detected circum-
radius for the correctly detected symmetries. Let G
be the smallest rectangle enclosing the ground truth
symmetry region, and T be the detected symmetry re-
gion with corners ~x ±
~
R(~x). Then we defined the area
precision p
A
as
p
A
=
|T ∩ G|
|T ∪ G|
with |X| = area of X (10)
As can be concluded from the last row in Table 1, both
the normalisation and the generalisation to rectangu-
lar regions clearly improve the accuracy of the shapes
of the detected symmetry regions.
Compared to the algorithm by Loy & Eklundh,
the gradient product transform is unaffected by light
skew, but is less robust with respect to contextual
noise. For the algorithm by Loy & Eklundh, it is just
the other way round.
3.2 Blood Vessel Extraction
The problem of blood vessel extraction occurs for
many types of medical images, e.g. for angiographs,
fundus photographs, or MRT-TOF datasets. For blood
vessel extraction from two-dimensional retina fundus
photographs, Staal et al. have created an evaluation
dataset known as the DRIVE database (“Digital Reti-
nal Images for Vessel Extraction”) (Staal et al., 2004).
VISAPP2015-InternationalConferenceonComputerVisionTheoryandApplications
182
In consists of 40 colour images, divided into 20 train-
ing and 20 test images, with ground truth data manu-
ally extracted by medical experts (see Figure 8).
From the colour images, we have used the green
channel as input to both our symmetry transform and
the vesselness filter, because this channel had the
highest contrast. It should be noted that Shahbeig
recently suggested sophisticated preprocessing oper-
ations on these particular images which strongly en-
hance the visibility of the blood vessels (Shahbeig,
2013). As we were less concerned with the specific
problem of retina photographs, but wanted to evaluate
the vessel extraction on typical medical images, we
restricted ourselves to a Gaussian blur with window
size k = 3 and variance σ
2
= 1.0 as the only prepro-
cessing operation on the green channel images; this
preprocessing operation was only applied before the
symmetry transform, but not before the vesselness fil-
ter because the latter does a Gaussian blurring any-
way.
When applying the gradient product transform to
blood vessel extraction, there are two issues:
1) Depending on the imaging technique, blood ves-
sels are either darker or lighter than the surround-
ing tissue, but the gradient product transform in-
variably detects symmetries in both dark and light
objects.
2) The gradient product transform results in a float
image of symmetry scores and not in a skeleton
image. The same holds for the vesselness filter.
To solve the the first issue, we have modified the
symmetry score from Eq. (4) to
s(~x,~r) = −
1
2
∑
~
d∈Ω(−~r,~r)
~
d6=
~
0
D
~
G(
~
d),
~
G(−
~
d)
E
(11)
× H
±
D
~
d,
~
G(
~
d)
E
where H denotes Heavyside’s step function (zero for
negative arguments, and one for positive arguments),
and the sign in its arguments controls which type of
objects are detected. For dark vessels, the plus sign
should be used because it has the effect that only gra-
Figure 8: Sample image from the DRIVE dataset and its
corresponding ground truth.
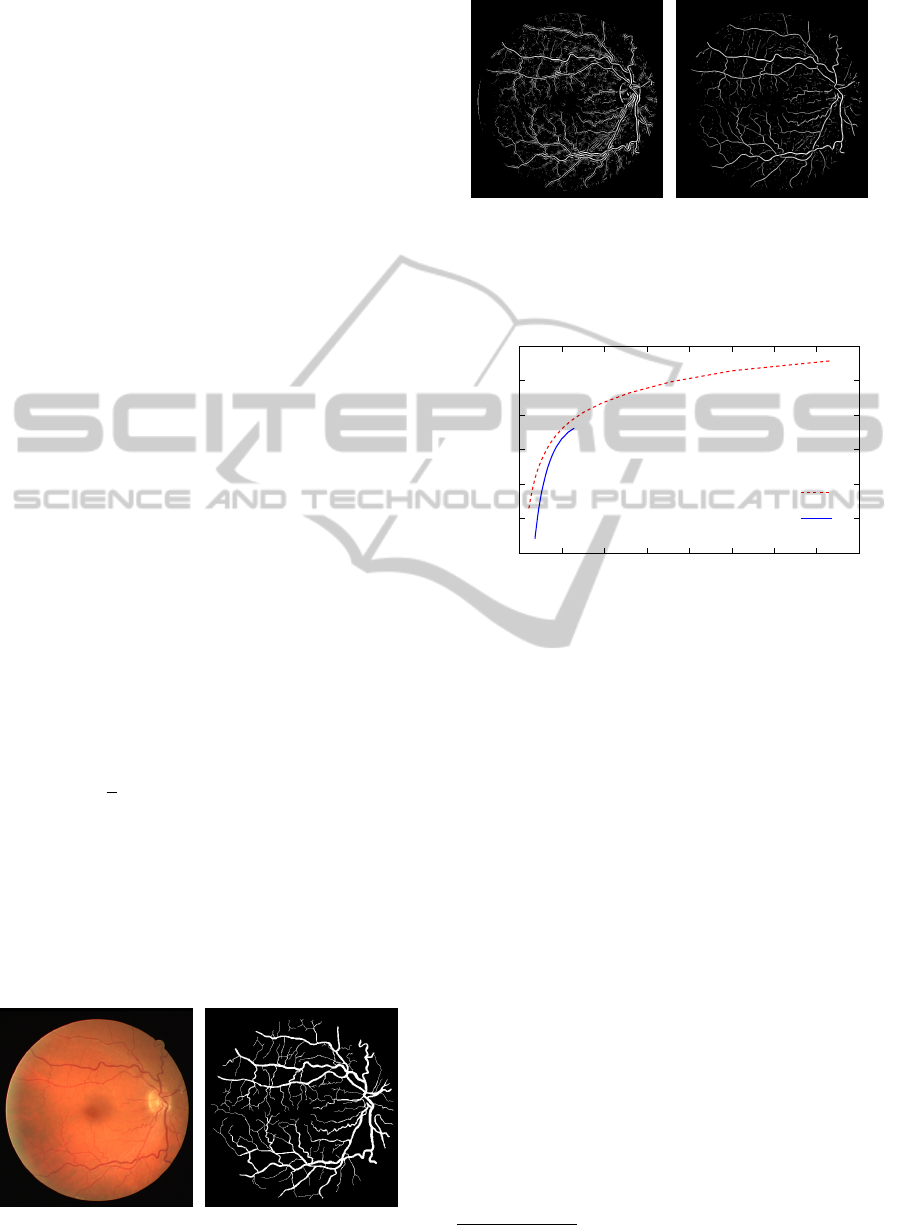
Figure 9: Impact of Heavyside’s step function on the gra-
dient product transform. The left image is the result of
the original gradient product transform, and the right image
the result after the modification (11) (the float images have
been converted to greyscale and the greyscale histogram
was equalised).
p
excess
p
missed
1 −
gradient product transform
vesselness filter
0 0.1 0.2 0.3 0.4 0.5 0.6 0.7 0.8
0.4
0.5
0.6
0.7
0.8
0.9
1
Figure 10: ROC-curves for blood vessel extraction on the
DRIVE dataset. p
missed
and p
excess
have been averaged over
all of the 40 images. Different points on the same curve
correspond to different threshold values.
dients pointing outwards contribute to the sum. Fig-
ure 9 shows the impact of this modification.
Concerning the second issue, we have binarised
the float image with a global threshold and extracted
the medial axis transform skeleton from the binary
image with the algorithm by Haralick & Shapiro (Har-
alick and Shapiro, 1992), as implemented in the Gam-
era framework
3
. To compare a resulting skeleton T
with the skeleton S of the corresponding ground truth
image, we computed the percentage of missed and ex-
cess pixels as
p
missed
= |S \ (T ⊕ H)|
.
|S| (12)
p
excess
= |T \ (S ⊕ H)|
.
|T |
where “⊕H” denotes morphological dilation with a
3 × 3 structuring element H and |X| denotes the num-
ber of pixels in X.
There is a trade-off between the values for p
missed
and p
excess
, depending on the threshold value: for a
lower threshold, the skeleton includes more pixels and
3
http://gamera.sf.net/
TheGradientProductTransformforSymmetryDetectionandBloodVesselExtraction
183

p
missed
is smaller, but p
excess
is greater. To compare
the performances of gradient product transform and
vesselness filter, we therefore tried a range of thresh-
olds and computed the receiver operating character-
istics (ROC), which is shown in Figure 10. For the
gradient product transform, we have chosen r
max
= 3
and α = 0.5. For the vesselness filter, we have tried
all values σ ∈ {0.1,0.2,...,3.0} and selected for each
pixel the largest vesselness score.
From Figure 10, we conclude that the gradient im-
age transform performs better than the vesselness fil-
ter for blood vessel extraction, because it yields more
correctly detected vessels for the same rate of false
positives. Note that the ROC curve for the vesselness
filter is shorter, because the threshold cannot become
less than zero. The same excess rate as with the ves-
selness filter for threshold zero was obtained with the
gradient product transform for a threshold set to half
the mean positive symmetry score.
4 CONCLUSIONS
The symmetry score normalisation for the gradient
product transform, as suggested in this article, clearly
improves the detection of the size of the symme-
try region and removes the necessity of an approx-
imate a priori guess of the maximum circumradius
r
max
. For the power α in the normalisation, we rec-
ommend α = 0.5. The generalisation to rectangular
regions makes the gradient product transform more
robust with respect to light skew.
Moreover, we have demonstrated that the gradi-
ent product transform can be useful as an image filter
beyond the narrow problem of symmetry detection.
An additional factor in the symmetry transform that
suppresses symmetry responses from light (or dark)
regions makes the gradient product transform well
suited for blood vessel extraction from medical im-
ages. To this end, it performs better than the ves-
selness filter, and can thus be a replacement for this
standard algorithm for blood vessel extraction. As a
global threshold for the symmetry score of blood ves-
sels, 0.5 times the mean positive score worked well in
our examples.
To enable others to easily build upon our results,
we make the source code of our new generalised sym-
metry transform and for the blood vessel extraction
freely available on our website
4
.
4
smallhttp://informatik.hsnr.de/∼dalitz/data/visapp13/
REFERENCES
Dalitz, C., Pohle-Fr
¨
ohlich, R., and Bolten, T. (2013). De-
tection of symmetry points in images. In International
Conference on Computer Vision Theory and Applica-
tions (VISAPP), pages 577–585.
Drechsler, K. and Laura, C. (2010). Comparison of vessel-
ness functions for multiscale analysis of the liver vas-
culature. In Information Technology and Applications
in Biomedicine (ITAB), 2010 10th IEEE International
Conference on, pages 1–5.
Erdt, M., Raspe, M., and S
¨
uhling, M. (2008). Automatic
hepatic vessel segmentation using graphics hardware.
In Medical Imaging and Augmented Reality, 4th Inter-
national Workshop, MIAR 2008, pages 403–412.
Frangi, A., Niessen, W., Vincken, K., and Viergever, M.
(1998). Multiscale vessel enhancement filtering. In
Medical Image Computing and Computer-Assisted In-
terventation MICCAI98, pages 130–137.
Haralick, R. M. and Shapiro, L. G. (1992). Computer and
Robot Vision, volume 1. Addison-Wesley, Reading,
MA.
Liu, J., Slota, G., Zheng, G., Wu, Z., Park, M., Lee, S.,
Rauschert, I., and Liu, Y. (2013). Symmetry detection
from real world images competition 2013: Summary
and results. In IEEE Conference on Computer Vision
and Pattern Recognition (CVPR).
Liu, Y., Hel-Or, H., Kaplan, C., and Gool, L. V. (2010).
Computational symmetry in computer vision and
computer graphics. Foundations and Trends in Com-
puter Graphics and Vision, 5:1–195.
Loy, G. and Eklundh, J. (2006). Detecting symmetry and
symmetric constellations of features. In European
Conference on Computer Vision (ECCV), pages 508–
521.
Park, M., Lee, S., Chen, P., Kashyap, S., Butt, A., and Liu,
Y. (2008). Performance evaluation of state-of-the-art
discrete symmetry detection algorithms. In IEEE Con-
ference on Computer Vision and Pattern Recognition
(CVPR), pages 1–8.
Pohle-Fr
¨
ohlich, R. and Stalder, D. (2014). 3D-
Symmetrietransformation zur Gef
¨
aßsegmentierung in
MRT-TOF-Daten. In Bildverarbeitung fr die Medizin
2014, pages 144–149.
Rauschert, I., Brockelhurst, K., Liu, J., Kashyap, S., and
Liu, Y. (2011). Workshop on symmetry detection from
real world images - a summary. In IEEE Conference
on Computer Vision and Pattern Recognition (CVPR).
Sato, Y., Nakajima, S., Shiraga, N., Atsumi, H., Yoshida, S.,
Koller, T., Gerig, G., and Kikinis, R. (1998). Three-
dimensional multi-scale line filter for segmentation
and visualization of curvilinear structures in medical
images. Medical Image Analysis, 2:143168.
Shahbeig, S. (2013). Automatic and quick blood vessels ex-
traction algorithm in retinal images. Image Process-
ing, IET, 7:392–400.
Staal, J., Abramoff, M., Niemeijer, M., Viergever, M., and
van Ginneken, B. (2004). Ridge-based vessel segmen-
tation in color images of the retina. Medical Imaging,
IEEE Transactions on, 23:501–509.
VISAPP2015-InternationalConferenceonComputerVisionTheoryandApplications
184
