
Towards Feature-driven Goal Fulfillment Analysis
A Feasibility Study
Avjot Garcha Singh
1
, Aida Omerovic
2
, Franck Chauvel
2
and Nicolas Ferry
2
1
University of Oslo, Oslo, Norway
2
SINTEF, Trondheim, Norway
Keywords:
Model-based Analysis, Functional Analysis, Functional Fulfillment, Functional Overlap, Decision Support.
Abstract:
Design of a system architecture normally refers to a pre-defined goal. We consider the goal as the desired
(functional or non-functional) aspect that is achieved by providing functionalities or mechanisms that support
it. For example, a security goal is supported by a set of security mechanisms. However, there are often several
ways towards (partially or completely) achieving a goal, which we refer to as design alternatives. Each design
alternative is composed of a subset of the mechanisms needed. Some mechanisms are more important than
others, and it is not obvious to what degree the different design alternatives fulfill the goal. It can moreover
often be difficult to see what combinations of the design alternatives would result in maximum coverage of
the goal. We propose an approach to modeling and analysis of the goals of a system. The approach supports
specification of the goal, specification of the design alternatives, a quantification of the degree of fulfillment, as
well as a quantification of the degree of overlap with respect to the goal fulfillment across design alternatives.
We also propose a visual representation of the degrees of fulfillment and the degrees of overlap. We have
evaluated the approach on a case study, and the initial results indicate its feasibility. This paper presents the
approach and the evaluation results. It also summarizes experiences and suggestions for further improvements.
1 INTRODUCTION
Everyone encounters decision making problems on a
daily basis. The common denominator for all decision
making problems is that the decisions are often made
based on satisfaction for where the decision criterion
is maximized or minimized.
In a perfect decision making scenario a decision
alternative stands out by satisfying all decision crite-
ria. However, it is quite rare that a decision alternative
satisfies all decision criteria. In most of the cases, the
decision maker selects a decision alternative based on
preferences and priorities of the decision criteria. In
that manner, it is often necessary to perform a thor-
ough analysis of a complex decision making scenario.
”Decision analysis can thus be defined as the process
and methodology of identifying, modeling, assessing,
and determining an appropriate course of action for a
given decision problem. This process often involves
a wide array of tools and the basic approach is gener-
ally to break the problem down into manageable and
understandable parts that the decision maker can com-
prehend and handle. It is then necessary to take these
smaller elements and reconstitute them into proper
solution for the larger original problem” (Ravindran,
2007).
When planning design of a system, security goals
need to be taken into account as early as possible. For
some design decisions, the alternatives and their im-
pacts need to be considered long before the imple-
mentation. The current state of the art provides sev-
eral security threat and risk oriented approaches such
as for example cause-consequence analysis (Nielsen,
1971), attack trees (Schneier, 1999), CRAMM (Bar-
ber and Davey, 1992), OCTAVE (Alberts and Davey,
2004), and CORAS (Lund et al., 2011). These ap-
proaches focus to a high degree on protecting assets
or goals of systems being analyzed, from their known
threats and risks. The threats and the risks are how-
ever not necessarily known at the early stages. There
is lack of approaches which facilitate security anal-
ysis by explicitly modeling which features and mea-
sures can generally contribute to the security goal of a
system being planned, without a priori knowledge of
the risks.
Imagine an enterprise wanting to make changes to
their information system architecture in order to im-
prove the security. The enterprise has for instance al-
193
Garcha Singh A., Omerovic A., Chauvel F. and Ferry N..
Towards Feature-driven Goal Fulfillment Analysis - A Feasibility Study.
DOI: 10.5220/0005229401930204
In Proceedings of the 3rd International Conference on Model-Driven Engineering and Software Development (MODELSWARD-2015), pages 193-204
ISBN: 978-989-758-083-3
Copyright
c
2015 SCITEPRESS (Science and Technology Publications, Lda.)

located five possible decision alternatives that might
be beneficial regarding security of their information
system. How do they know which security features
and mechanisms (or measures) would be appropriate
for achieving the goal? Are these mechanisms practi-
cally feasible in combination? Provided the decision
alternatives are described at a high level, can we re-
fine them and thus identify which of the mechanisms
(that ideally are desired as specified by the goal) they
cover? If the mechanisms are of different importance,
can we quantify to what degree they fulfill the goal?
If several decision alternatives can be combined, can
we provide decision support choosing the preferred
combination, such that the goal is fulfilled to highest
possible degree?
In this paper, we tackle these needs by propos-
ing an approach to functional fulfillment analysis. By
functional fulfillment analysis we mean the analysis
of 1) degree of fulfillment of a predefined (functional
and non-functional) goal, and 2) degree of overlap
between the decision alternatives with respect to the
goal. The degree of fulfillment reflects the coverage
of features and mechanisms related to the various de-
cision alternatives with respect to the goal. By func-
tionalities or features we mean the partial goals or
properties of the target of analysis. By mechanisms
we mean the implementable measures that support
the achievement of the partial goals. By overlap we
mean the association, interplay, and relationship be-
tween the various decision alternatives. The approach
to modeling offers notation, terminology, and guid-
ance for expressing the degree of fulfillment and the
degree of overlap. The focus on the functional aspects
of the approach is due to the need of making the func-
tionalities and features first class citizens, and decom-
posing the goal via the functionalities to the mecha-
nisms for achieving them. A functional analysis thus
allows a broader perspective on a goal, as compared
to a pure quality (non-functional) analysis.
The approach has been evaluated in a case study
targeting a system called SensApp (Mosser et al.,
2012). The input to the case study were comprehen-
sive architecture design models of SensApp, as well
as a high-level specification of five design alternatives
aiming at improvement of SensApp security. In addi-
tion to two analysts, two domain experts with thor-
ough knowledge of SensApp, were present through-
out the case study, and were actively involved in the
development of the models for functional fulfillment
analysis. The evaluation indicates that the functional
fulfillment analysis provides useful information re-
garding the performance of the decision alternatives.
We were able to model functional capabilities of the
goal, and the decision alternatives, as well as to fully
Problem analysis
Innovation
Evaluation
What is the potential need?
How to make an artifact that
satisfies the need?
How to show that the artifact
satisfies the need?
Figure 1: Method for technology research (adopted from
Solheim and Stølen (Solheim and Stølen, 2007)).
analyze both the degree of fulfillment and the degree
of overlap. The comprehensibility and the expressive-
ness of the models seemed to be satisfactory in the
context of the case study, while correctness and cer-
tainty of the models need further enhancements of the
approach. More evaluation is furthermore needed in
order to address the threats to validity and reliability,
but we believe that the approach could be useful in
the context of decision making where multiple deci-
sion alternativescan be selected and combined. Based
on our initial experiences, we suggest further work on
uncertainty handling, process guidance, tool support
development, and more empirical evaluation.
The paper is structured as follows: Section 2 sum-
marizes our objective, success criteria, and the re-
search method. In Section 3 we briefly present the
background state of the art, and explain main con-
structs of feature modeling. Section 4 briefly presents
our approach in general terms. Section 5 presents how
the approach was applied on a case study. In Section
6, we elaborate on the degree to which the success
criteria have been achieved, and discuss the threats to
validity and reliability. In Section 7, main conclusions
and directions for future work are summarized.
2 RESEARCH METHOD
Our objective has been to provide a practically useful
decision support for model-based and goal-oriented
design. To this end, we model goals in such a man-
ner that the mechanisms needed for achieving them
are explicit. A part of the objective is moreover to be
able to analyze the degree to which the functionali-
ties and the mechanisms contribute to fulfillment of
a goal. Additionally, we needed support for compar-
ing the design alternativesand expressing their mutual
similarity or overlap in terms of the functionalities
and mechanisms supporting the goal under analysis.
Considering the need of the users to correctly develop
and use the models, our initial success criteria for the
MODELSWARD2015-3rdInternationalConferenceonModel-DrivenEngineeringandSoftwareDevelopment
194

approach have included:
• correctness of the models,
• expressiveness of the models, and
• comprehensibility of the approach to the users.
The correctness implies that the set of models are un-
biased as well as sufficiently certain for the purpose
intended, and should substantiate and support the de-
cisions made by the decision maker. In that manner,
uncertainties must be taken into account. The un-
certainties involved must be reported and managed
properly. The expressiveness implies that the mod-
els can include all the aspects that are relevant for the
selection of the decision alternatives. The compre-
hensibility implies that the models are easy to under-
stand by the users. The models should moreover fa-
cilitate a common understanding considering the de-
cision making problem in question. The approach
assumes that the modelers have the relevant domain
knowledge on the system under analysis. Normally,
an analyst and several domain experts would collab-
orate on development of the models. Indicators for
comprehensibility by the domain experts or the deci-
sion makers include involvement of the stakeholders,
agreement upon the models, ability to use the models
correctly, correct interpretation, and consistent esti-
mates.
Our research was based on an iterative process
consisting of problem analysis, innovation, and eval-
uation, as illustrated by Figure 1 (Solheim and Stølen,
2007). During the problem analysis phase, SensApp,
i.e. the target of the analysis was modeled in terms of
its architecture, risks, costs of the various decision al-
ternatives, and the system quality. The need for com-
paring the functional coverage and overlap between
the five different decision alternatives, was identified
and the above presented success criteria were charac-
terized.
The innovation phase consisted of designing a so-
lution based on the identified needs. In our case,
the approach to modeling functional and technical as-
pects, analyzing them with respect to coverage of the
goal, and visualizing the goal fulfillment, was pro-
posed.
Our evaluation was conducted by collaborating
with two domain experts in SensApp, and perform-
ing the modeling and analysis of the security-relevant
functionalities of SensApp. Based on the initial tar-
get system description and the UML (Alhir, 1998)
system models of SensApp (which were input to our
analysis), the analysts were to a certain degree able to
propose an initial model decomposing the goal. Dur-
ing the rest of the evaluation, the approach was fur-
ther developed in close collaboration with the domain
experts during two workshops with duration of four
hours in total. The domain experts were also involved
in reviewing the needs and requirements related to the
approach. Thus, the approach has, to a certain degree,
been developed and evaluated in parallel. Finally, the
approach to modeling in the decision making method
was evaluated with respect to a pre-defined set of suc-
cess criteria.
3 BACKGROUND
This section places our work in the context of the state
of the art. We summarize the modeling approacheswe
have relied on, before presenting feature modeling in
more detail.
3.1 The Context
This work has been motivated by the need to dis-
tinguish between decision alternatives based on their
goal achievement through functionalities and mea-
sures. Often, decision support considers aspects such
as quality, risks, and cost. The functional properties
are however not analyzed as a first class citizen. Es-
tablishing a mindset which focuses on functionalities
supporting a goal, provides a perspectivewhich is ori-
ented towards external properties of a system and the
mechanisms for achieving them. Importantly, we do
not omit the non-functional aspects, but include them
in the modeling when needed. Our approach relies
on Dependency Views (DVs) (Omerovic, 2012) and
the feature models (Th¨um et al., 2014) in modeling
the functional coverage and similarity of the deci-
sion alternatives, with respect to a pre-defined goal.
The adopted modelingtechniques are well-knownand
chosen with objective to be familiar and comprehen-
sible to non-technical users.
We make use of feature modeling to decompose
the goal into subgoals, features and mechanisms.
We moreover use the propagation models from DVs
within the PREDIQT method (Omerovic, 2012) to
model degree of fulfillment. Feature diagrams have
a hierarchical tree structure containing features, char-
acteristics, and aspects associated with the object in
question (Th¨um et al., 2014). Feature diagrams are
useful in the sense that they provide insight into the
various features and functionalities implemented by
the decision alternatives. Similarly to the DVs, this
approach quantifies the degree of fulfillment. It how-
ever distinguishes from the DVs by focusing mainly
on the functional properties of a goal.
With respect to the feature models, our models are
enriched by the annotated weights and a propagation
TowardsFeature-drivenGoalFulfillmentAnalysis-AFeasibilityStudy
195

%/# 245#1% ). 6&#-%)2. 789: ;#$%&'# ()$*'$+- /$<# $ /)#'$'1/)1$= %'## -%'&1%&'# 12.%$).).*
#)%/#' +$.($%2'> 2' 2,%)2.$= "#$%&'#- 789: ?/# <$')2&- -&4@"#$%&'#- $'# 2"%#.
()-%).*&)-/#( 3)%/ 2'@0 $.(@0 2' $=%#'.$%)<#@'#=$%)2.-/),- 789:
;)*&'# A:B )==&-%'$%#- %/# ->.%$C 2" "#$%&'# ()$*'$+-: D$.($%2'> $.( 2,%)2.$= "#$%&'#-
Mandatory
Optional
Or
Alternative
Figure 2: Syntax of feature diagrams.
model. With respect to the DVs, our models are not
concerned with degree of fulfillment of each subgoal
or mechanism (assuming that it is fully fulfilled), but
only its importance which is normalized and propa-
gated as in a DV. The operators (AND, OR and XOR,
mandatory, optional) from the feature models are ap-
plied and the propagation model extended to handle
them as well. We moreover quantify the degree of
overlap between the decision alternatives, and pro-
pose how both the degree of fulfillment and the degree
of overlap can be visualized.
3.2 Feature Modeling
A feature diagram represents the features, character-
istics, and aspects associated with the target of anal-
ysis (Th¨um et al., 2014). Feature diagrams have a
hierarchical tree structure containing either manda-
tory or optional features. The various sub-features
are often distinguished with or-, and-, or alternative-
relationships. Feature diagrams are useful in the sense
that they provide insight into the features and func-
tionalities implemented by the various decision alter-
natives. A design alternative is depicted by a selected
set of features which are decomposed with respect to
a goal.
Figure 2 illustrates the syntax of feature diagrams.
Mandatory and optional features are explicitly dis-
tinguished and represent an and-relationship. All
mandatory sub-features must be selected in an and-
relationship. The or-relationship describes features
that are required by the parent-feature. In that manner,
the sub-features of an or-relationship are indifferent
and at least one sub-feature must be selected (Th¨um
et al., 2014). The alternative-relationship describes
alternativefeatures that are not required by the parent-
feature, and exactly one sub-feature has to be selected
(Th¨um et al., 2014). A feature that is not described
in a feature diagram and specified by an alternative-
relationship can still be selected as long it fulfills the
purpose given by the parent-feature. In summary, the
relationships include:
• Alternative: Not required features and exactly one
feature must be selected
• And: Mandatory and optional features
• Or: Required features and at least one feature
must be selected
4 OUR SOLUTION
The functional fulfillment analysis expresses the de-
gree of fulfillment of a goal, and the degree of overlap
between the decision alternatives with respect to the
coverage of the goal. While the degree of fulfillment
quantifies the coverage of the features and mecha-
nisms supporting achievement of the goal, the over-
lap expresses the similarity of two possible decision
alternatives with respect to the features and mecha-
nisms supporting the goal. In this section, we briefly
present the approach in general; first the overall pro-
cess, second the modeling and finally the analysis part
of it.
4.1 Process of the Approach
The six stage process of the approach is depicted by
Figure 3. The input to the process are the design mod-
els of the target of the analysis, and a description of
the goal. In Phase 1, the ideal solution (objective) is
modeled resulting in a feature model. In Phase 2, a
feature model is deduced for each decision alterna-
tive (DA) from the model representing the objective.
Next, the arcs on the objective model are annotated
with weights expressing their importance. The deci-
sion alternative specific feature diagrams thus inherit
the weights from the relevant parts of the objective
diagram. Next, the degrees of fulfillment and the de-
grees of overlap are calculated for all decision alter-
natives. Finally, we visualize the results in a unified
view and preform selection by searching for the set of
decision alternatives having maximum fulfillment and
minimal overlap. Phases 1, 2 and 3 need to be done in
collaboration between an analyst and domain experts.
Phases 4 and 5 are based on algorithms which can be
automated. The final phase is use of the models, and
left to a decision maker.
4.2 Modeling
The approach to modeling offers notation, terminol-
ogy, and guidance for expressing the degree of fulfill-
ment and the degree of overlap. Our approach makes
use of feature diagrams to represent the objective and
the various decision alternatives. A feature diagram
representing the objective reflects the ideal function-
ality of the target system under analysis. In that man-
ner, the feature diagrams representing the various de-
cision alternatives will be sub-graphs of the feature
diagram representing the overall objective. This is the
case because only the relevant elements (i.e, those al-
ready expressed through the objective model) need to
MODELSWARD2015-3rdInternationalConferenceonModel-DrivenEngineeringandSoftwareDevelopment
196

1. Model the objective
2. Instantiate the
objective model w.r.t.
target as is, and w.r.t.
each DA
4.1 Calculate the
degree of
fulfillment of each
model developed
in Phase 2
4.2 Calculate the
degree of
overlap accross all
DA models developed
in Phase 2
5. Visualize in a uniform view the degree of
fulfillment w.r.t. objective of all DAs,
and degree of overlap accross all DAs
6. Select a set of DAs by maximizing
fulfillment and minimizing overlap
3. Assign weights to the objective
Figure 3: The process to be undergone.
be included in the instantiation with respect to the de-
cision alternatives.
The feature diagrams are expected to be developed
by the analyst in close collaboration with the domain
experts. First of all, a feature diagram representing
the ideal functionality of the target system should be
developed. The feature diagram should contain sub-
goals, features and finally mechanisms (in the form
of leaf nodes) that fulfill the overall objective. Fur-
thermore, feature diagrams representing the various
decision alternatives should be developed. The fea-
ture diagrams are then annotated with weights which
enable the calculation of the degree of fulfillment and
the degree of overlapachievedby the decision alterna-
tives. In the following, we explain in detail the calcu-
lation behind the degree of fulfillment and the degree
of overlap.
4.3 The Degree of Fulfillment
In this section, we present a formalization of the cal-
culation behind the degree of fulfillment. The calcu-
lation of the degree of fulfillment of a feature diagram
is considered by comparing the nodes with an initial
feature diagram representing the overall objective. A
feature diagram is a set of nodes N, where each node
n is assigned a weight w. A node denotes a relevant
feature related to the decision alternative in question.
If n is a part of an and-relationship, then the assigned
weight w of n should be taken into account by divid-
ing w by the sum of weights assigned to all sibling
nodes in the initial feature diagram. A node is a sib-
ling to another node if they both share the same im-
mediate parent node. In that manner, all sibling nodes
are part of the same sub-graph.
Furthermore, we need to take into account the
constraints provided by the alternative- and or-
relationship. If the node in question is a part of an
alternative- or or-relationship in the initial feature di-
agram, then we do not divide w by the sum of weights
assigned to all sibling nodes. In that case, we only
consider the node in question and divide the weight
w by itself. Finally, we do not distinguish between
mandatory and optional nodes, since the difference
between mandatory and optional features is already
ensured and maintained through the assigned weights.
As an example, we let the initial feature diagram
FD (corresponding to feature diagram representing
the overall objective) contain the following nodes;
FD = n
i
, ..., n
j
where i, j ∈ N (1)
Similarly, we let the feature diagram in question
FD’ (corresponding to feature diagram representing a
decision alternative) contain the following nodes;
FD = n
k
, ..., n
z
(2)
In the following we summarize the general rules
for calculating the degree of fulfillment:
• If n
i
is a part of an and-relationship, then the cal-
culated degree of fulfillment of the node in ques-
tion will be
w
i
w
sum
, where w
sum
denotes the total
weight of all sibling nodes.
• If n
i
is a part of an alternative- or or-relationship,
then the calculated degree of fulfillment of the
node in question will be
w
i
w
i
. In that manner, the
degree of fulfillment achieved by a specific node
in an alternative- or or-relationship will corre-
spond to one.
For aggregating the total degree of fulfillment for
the whole feature diagram, we provide the following
pseudo code for tree traversal:
1.
Let n be the leftmost node in a
feature diagram
2.
If n is a part of an and-relationship:
w
w
sum
where w denotes the weight of n
and
w
sum
denotes the total weight of
all sibling nodes
3.
If n is a part of an alternative- or
or-relationship:
w
w
where w denotes
the weight of n
TowardsFeature-drivenGoalFulfillmentAnalysis-AFeasibilityStudy
197

4.
Apply the above steps for every child
node of n
5.
The degree of fulfillment of n will
be multiplied with the degree of
fulfillment achieved by each child
6.
The degree of fulfillment achieved
by the leaf-nodes taking part in an
and-relationship will be summed
4.4 The Degree of Overlap
The degree of fulfillment tells nothing about the over-
lap between the decision alternatives. The intuition of
the degree of overlap is to identify decision alterna-
tives with similar features and functionality. By con-
sidering the degree of overlap, we can exclude a deci-
sion alternative that might provide the same features
and mechanisms as another decision alternative. The
degree of overlap quantifies the extent to which two
decision alternatives provide the same features and
supporting mechanisms. The degree of overlap fol-
lows the same calculation as the degree of fulfillment
presented in the previous section. While the degree
of fulfillment is calculated with the objective as ref-
erence model, the degree of overlap is obtained by
having the various decision alternatives as reference
models.
5 EVALUATION BASED ON A
CASE STUDY
This section first presents a brief description of the
target of analysis. Secondly, we provide an account
of the instantiation of the approach on the case. The
input to the case were architecture models of the tar-
get of analysis (Singh, 2014), as well as a characteri-
zation of the five decision alternatives.
5.1 Case Description
The case study was conducted on a small system
called SensApp (Mosser et al., 2012). SensApp is an
open-source service-based application used to store
and exploit data collected by the Internet of Things
(IoT). SensApp can register sensors, store the data
collected by the sensors and notify registered clients
with relevant data and information (Mosser et al.,
2012). The main stakeholders involved in the context
of SensApp are: sensor architect, service provider,
data miner, and third party application. The sensor
architect is responsible for registering sensors. The
sensors push data to the application, which indirectly
trigger the sending of a notification when relevant
data is pushed. The service provider is responsible for
the operations and maintenance of the sensors. The
data miner can query stored data, while a third party
application in addition has the ability to register for
notifications when relevant data is pushed.
The case study was conducted in an information
security context with the objective of improving the
security of SensApp. Two analysts and two domain
experts participated in the entire case study. The fol-
lowing above mentioned decision alternatives (DAs)
were analyzed:
• DA A: Change in infrastructure
• DA B: Change of topology
• DA C: Change of licenses
• DA D: Change of location
• DA E: Update software
All decision alternatives were specified in more
detail and considered as realistic alternatives for se-
curity improvement. Change in infrastructure means
change in the technical architecture needed for the
functioning of the service provided by SensApp.
Change of topology means change in the configura-
tion of the technical base needed for the function-
ing of the service provided by SensApp. Change
of licenses involves upgrading or purchasing enter-
prise and commercial software licenses for informa-
tion security purposes. By change of location we
mean geographical relocation of the infrastructure,
the platform, and the environment that SensApp is
based upon. Updating the current software version of
SensApp involves implementation of various security
mechanisms in the already existing solution of Sen-
sApp.
5.2 Modeling Security Subgoals,
Features, and Mechanisms
All developed diagrams focus on security relevant
features. We used FeatureIDE (Th¨um et al., 2014)
to develop our feature diagrams. FeatureIDE is an
Eclipse-based tool for development of feature dia-
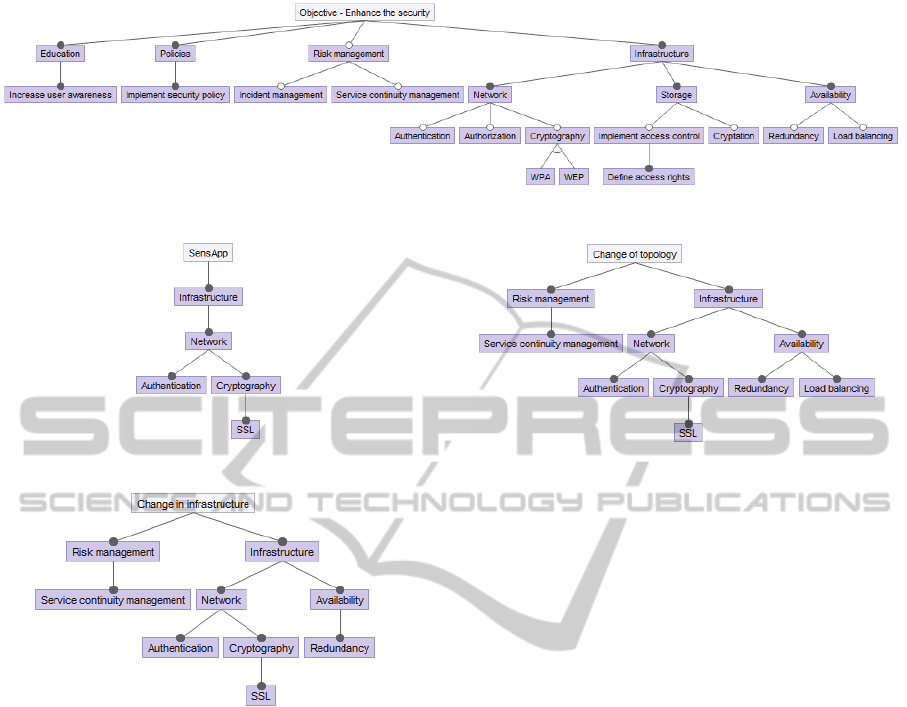
grams. Figure 4 illustrates the security relevant fea-
tures associated with the ideal functionality of Sen-
sApp. The domain experts identified in particular four
security domains that could be improved in terms of
the objective of enhancing the security of SensApp:
(1) education, (2) policies, (3) risk management, and
(4) infrastructure. Furthermore, Figure 4 describes se-
curity mechanisms as leaf-nodes that could be imple-
mented in order to fulfill the overall objective. We
MODELSWARD2015-3rdInternationalConferenceonModel-DrivenEngineeringandSoftwareDevelopment
198
%&3&%&2/& ;45&* 5$%"2# &1-*$-,"42 43 4$% ;&,.45 34% /-*/$*-,"2# ,.& 5&#%&& 43
3$*3"**;&2, "2 ,.& 2&<, +&/,"42(
!"#$%& '(D "**$+,%-,&+ ,.& 3&-,$%& 5"-#%-; -++4/"-,&5 6",. 5&/"+"42 -*,&%2-,"1& 8 -+
+9&/"3"&5 5$%"2# ,.& /-+& +,$50 @+&& 899&25"< IB /.-2#& "2 "23%-+,%$/,$%& 6.&%&
Figure 4: Objective – Enhance the security.
Figure 6.1: Current security of SensApp
!"#$%& '() "**$+,%-,&+ ,.& +&/$%",0 %&*&1-2, 3&-,$%&+ -++4/"-,&
Figure 6.2: Objective - Enhance the security
Figure 5: Current security of SensApp.
7,21%!-/# !-5!&#-5,# &,- *%83#9*%,*+,%:#0,2!7!*&#."-,%&.-!+,#;# !""#!()",(,&-#7,21%!-/<
%,".-,0#(,25.&!7(7#-5.-# !""#!&-%*012,#7,%+!2,#2*&-!&1!-/#(.&.',(,&-3#
#
#
=!'1%,# >3?# !""17-%.-,7# -5,# 6,.-1%,# 0!.'%.(# .77*2!.-,0# !-5# 0,2!7!*&# ."-,%&.-!+,# @# .7#
Figure 6: Security relevant features associated with decision
alternative A.
will use Figure 4 as a reference model during evalu-
ation of our method for calculating the degree of ful-
fillment.
Figure 5 expresses the current security of Sen-
sApp. As shown, the existing version of SensApp has
implemented authentication and cryptography mech-
anisms.
Figure 6 shows the feature diagram expressing the
result of implementation of decision alternative A –
change in infrastructure. Thus, Figure 6 illustrates
the various security relevant features and mechanisms
associated with SensApp after the implementation of
decision alternative A. The implementation of deci-
sion alternative A will bring improvement in avail-
ability and redundancy. Change in infrastructure will
in addition introduce authentication and cryptography
mechanisms that will improve the security within the
network. Moreover, decision alternative A will imple-
ment security-related mechanisms that will introduce
service continuity management.
Figure 7 shows the feature diagram expressing the
!"#$%& '() "**$+,%-,&+ ,.& /&-,$%& 0"-#%-1 -++23"-,&0 4",. 0&3"+"25 -*,&%5-,"6& 7 -+
Figure 7: Security relevant features associated with decision
alternative B.
result of implementation of decision alternative B –
change of topology. In that manner, Figure 7 illus-
trates the various security relevant features associated
with SensApp after the implementation of decision al-
ternative B. Similar to decision alternative A, the de-
cision alternative B will bring improvement in avail-
ability. In addition to redundancy,decision alternative
B will provide load balancing. Decision alternative B
will also provide the implementation of both authen-
tication and cryptography mechanisms.
Figure 8 shows the feature diagram expressing the
result of implementation of decision alternative C –
change of licenses. Figure 8 expresses the various se-
curity relevant features associated with SensApp af-
ter the implementation of decision alternative C. By
upgrading or purchasing enterprise and commercial
software licenses, there will be a need for increasing
user awareness and implementing security policies.
Moreover, decision alternative C will implement vari-
ous security mechanisms for securing the network and
the storage. In addition, it is possible to purchase li-
censes from external information security vendors for
monitoring and management of security-related inci-
dents.
Figure 9 shows the feature diagram expressing the
result of implementation of decision alternative D –
change of location. Relocation of Information Tech-
nology services often introduce legal issues, therefore
there will be a need of increasing user awareness and
implementing security policies. Furthermore, deci-
sion alternative D will bring improvement in network
security by implementing various authentication and
TowardsFeature-drivenGoalFulfillmentAnalysis-AFeasibilityStudy
199
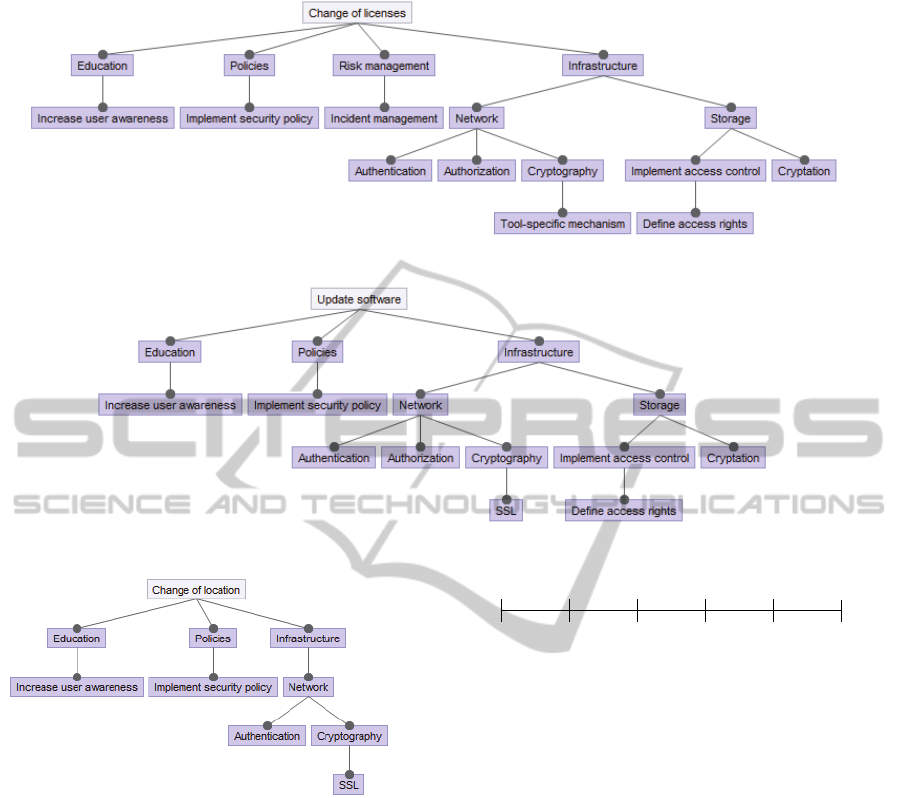
Figure 8: Security relevant features associated with decision alternative C.
$%*%6-5,& /%-,#$%+& -++23!-,%0& 4!,.& ?%5+;88& -/,%$& ,.%& !18*%1%5,-,!25& 2/& 0%3!+!25&
-*,%$5-,!6%&7(&
&
&
Figure 10: Security relevant features associated with decision alternative E.
2%87+1#%,7-8 0&2-,4"*0*( !"#$%& '(' "))$*+%,+&* +-& 5,%"1$* *&2$%"+8 %&)&5,4+ .&,+$%&*
,**12",+&/ 3"+- ?&4*:77 ,.+&% +-& "07)&0&4+,+"14 1. /&2"*"14 ,)+&%4,+"5& 6(
Figure 9: Security relevant features associated with decision
alternative D.
cryptography mechanisms.
Figure 10 shows the feature diagram expressing
the result of implementation of decision alternative
E – update software. The decision alternative E will
implement various security mechanisms for providing
more robust security of the network and the storage.
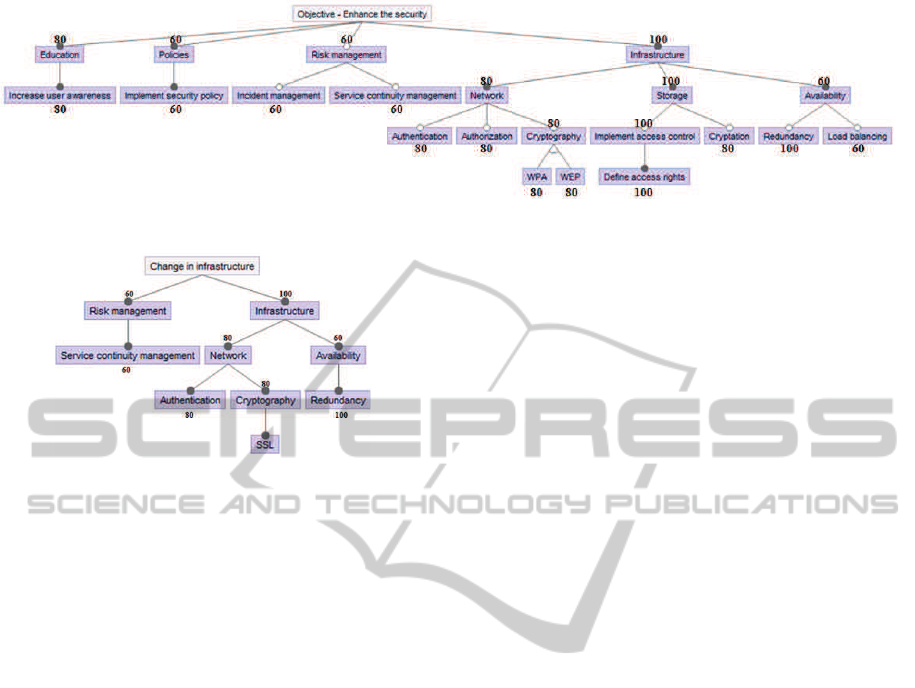
5.3 Modeling the Degree of Fulfillment
The degree of fulfillment reflects the coverage of se-
curity features related to the various decision alterna-
tives. We assigned weights to all arcs on the feature
diagram representing the ideal functionality (the ob-
jective) of SensApp (Figure 12). A weight denotes
the importance of a security feature with respect to the
parent node. In this case, the security features were
assigned weights according to the scale specified in
Irrelevant Nice to have
Useful
Contributing
Important
Critical
0
20
40
60
80 100
Figure 11: Scale for assigning weights.
Figure 11. The scale was agreed upon and defined
by the domain experts. Assigning weights was done
based on a top-down approach, i.e., starting from the
root node, its children nodes are weighted with re-
spect to the root. The weights were then assigned to
the children nodes at the next level until reaching the
leaves and having all arcs of the model (representing
the objective) annotated.
The feature diagrams representing the various de-
cision alternatives inherit the weights assigned to the
objective (Figure 12). This is possible since the fea-
ture diagrams representing the various decision alter-
natives are sub-graphs of the feature diagram repre-
senting the objective of SensApp. Feature diagrams
containing the objective of SensApp and decision al-
ternative A with assigned weights are presented in
Figure 12 and 13, respectively.
The sub-features of infrastructure in Figure 12
represent three mandatory sub-groups namely net-
work, storage, and availability. It is important to point
out that the weight assigned to infrastructure repre-
sents the importance of infrastructure given the over-
all objective, while the weights assigned to the vari-
ous sub-features of infrastructure represent the impor-
MODELSWARD2015-3rdInternationalConferenceonModel-DrivenEngineeringandSoftwareDevelopment
200
)7;"1'%0"#)3#4"5(6--#/5,#,"1%(%)5#/+'".5/'%0"#6#$%'!#/((%&5",#$"%&!'(#/."#-."("5'",#%5#
=%&*."#>8?#/5,#>8ABC#."(-"1'%0"+28#
#
Figure 12: Objective with assigned weights.
#
Figure 13: Decision alternative A with assigned weights.
tance given the parent-feature. Network is therefore
important while storage is critical given the infras-
tructure of the information system in question. The
sub-features of an alternative-relationship should be
assigned the same weight, since they all are equally
representative for the parent-feature. In that manner,
both WEP and WPA are important security relevant
features given the feature of cryptography. The dif-
ference between mandatory and optional features is
ensured and maintained through the assigned weights.
For each decision alternative, the weights on the
corresponding diagram propagate to the resulting
overall security of SensApp. We perform aggregation
of the degree of fulfillment by normalizing all contri-
butions in such a manner that the objective achieves
the degree of fulfillment equal to one, while the deci-
sion alternativesscore in terms of a fraction relative to
the objective. Thus, the degree of fulfillment achieved
by decision alternative A was obtained as shown in
Equation 3.
The calculation is based on a top-down approach,
where the weight of each node is aggregated by the
principle of normalization. In that manner, decision
alternative A has achieved 0.226 degree of fulfillment
in the following manner. The first term in the cal-
culation represents the node of education, where the
denominator represents the sum of the weights in the
first level in Figure 12. The numerator is zero since
the node of education is not represented by decision
alternative A. Similar reason yields for the second
term in the calculation. The third term represents
the node of risk management, where the numerator
represents the assigned weight and the denominator
represents the sum of the weights in the first level of
the feature diagram in Figure 12. Further, the node
of risk management involves implementation of in-
cident management and service continuity manage-
ment. Decision alternative A does not provide in-
cident management, and we therefore only take into
account service continuity management in the calcu-
lation. The numerator in the aggregated term repre-
sents the assigned weight of service continuity man-
agement, while the denominator represents the sum of
the assigned weight of both incident management and
service continuity management.
The calculation is similar for the node represent-
ing infrastructure. However, it is important to notice
that only one of the sub-features in an alternative-
relationship has been taken into account in the calcu-
lation. In that manner, the calculation is only based
on one of the assigned weights to the alternative-
relationship consisting of WPA and WEP. Since the
sub-features of an alternative-relationship should be
assigned the same weight, the denominator should
represent the assigned weight of the parent-feature.
This approach was similarly undergone to calcu-
late the degree of fulfillment achieved by decision al-
ternatives B-E. The corresponding calculation for the
overall decision alternatives (DAs) results in the fol-
lowing fulfillment values (where value of 1 implies a
perfect fulfillment, a value of 0 implies no fulfillment,
while the values between o and 1 imply percentages
of the fulfillment of the objective):
• DA B: 0,257
• DA C: 0,917
• DA D: 0,541
• DA E: 0,717
5.4 The Degree of Overlap
The degree of fulfillment tells nothing about the over-
lap between the decision alternatives. We use the
approach for calculating the degree of fulfillment to
TowardsFeature-drivenGoalFulfillmentAnalysis-AFeasibilityStudy
201
0
300
+
0
300
+
60
300
60
120
+
100
300
80
240
80
240
+
0
240
+
80
240
80
80
+
0
240
+
60
240
100
160
+
0
160
≈ 0.226
(3)
Propagation of the degree of fulfillment regarding decision alternative A
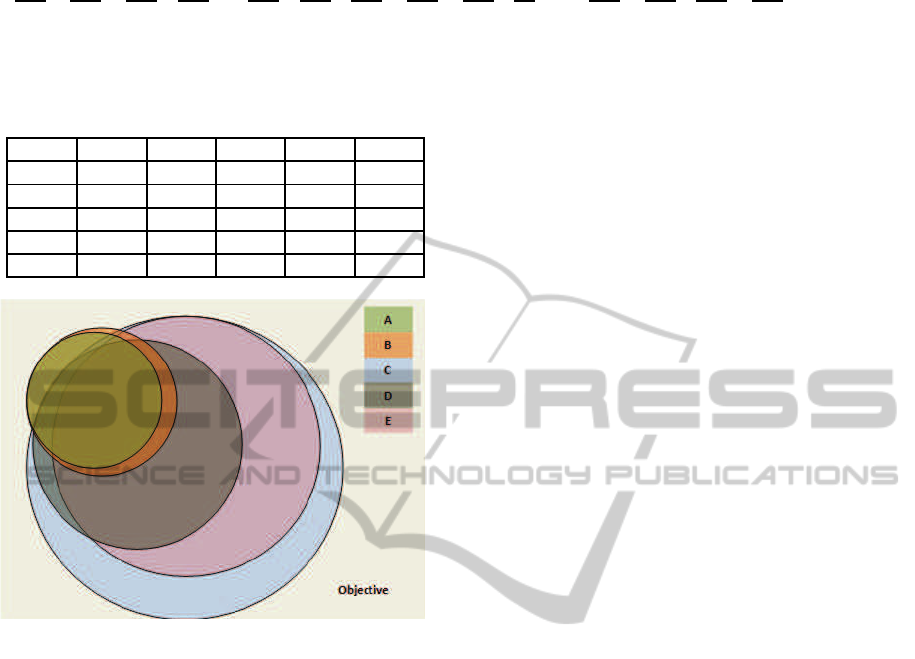
Table 1: Degree of overlap between the decision alterna-
tives.
DA A DA B DA C DA D DA E
DA A 0.9 0.099 0.417 0.123
DA B 1 0.099 0.417 0.123
DA C 0.357 0.357 1 1
DA D 0.357 0.357 0.565 0.707
DA E 0.357 0.357 0.80 1
/.&",%/&$-"1#H#/%*#I#/,"#3(-","*#82#*"3$1$(%#/.&",%/&$-"#J6# !$1#3/%#/.1(#8"#(81",-"*#82#
/8."#96:6#
#
#
Figure 14: Visual representation of the degree of fulfillment
and the degree of overlap.
obtain the degree of overlap between the various de-
cision alternatives. Namely, we calculate the de-
gree of overlap between decision alternatives X and
Y by having X (rather than the objective) as refer-
ence model for calculation of degree of fulfillment of
Y. The degree of overlap expresses to which extent
two decision alternatives X and Y provide the same
security-related mechanisms. Table 1 presents the re-
sulting degree of overlap between our decision alter-
natives A through E. The top row in Table 1 indicates
the reference models.
The intuition of the degree of overlap is to identify
decision alternatives with similar subgoals, features,
and mechanisms. According to Table 1, the security-
related mechanisms provided by decision alternative
A are also provided by decision alternative B. How-
ever, decision alternative B provides load balancing
as well (see Figure 7). In that manner, it would be
reasonable to exclude decision alternative A.
Figure 14 visualizes the degree of fulfillment and
the degree of overlap obtained by the decision alterna-
tives from the SensApp case. The size of the elements
in Figure 14 depicts the degree of fulfillment, while
the placement of the elements depicts to what extent
the various decision alternatives overlap with respect
to security features and functionality. According to
Figure 14, the security-related mechanisms provided
by decision alternatives D and E are covered by de-
cision alternative C. This can also be observed from
Table 1.
6 DISCUSSION
According to Runeson and H¨ost (Runeson and H¨ost,
2009): ”The validity of a study denotes the trust-
worthiness of the results, to what extent the results
are true and not biased by the researchers’ subjective
point of view”. There was a large number of contex-
tual factors influencing our research, such as: the case
study setting, the research method, the target system
under analysis, and the participants involved. Our re-
search was highly dependent on subjective judgments
provided by the domain experts. As major threat we
consider the uncertainty of the models. The domain
experts provided estimates based on their experience.
In that manner, the validity of the models relies on the
confidence to the expert judgments. There exists state
of the art that we could adopt for uncertainty han-
dling. Uncertainty handling has, for example, been
reviewed in (Omerovic et al., 2012). In DVs, uncer-
tainty is handled based on intervals (Omerovic and
Stølen, 2011).
The in-depth technological background of the do-
main experts has to some degree limited the threats
to validity. We achieved some triangulation by us-
ing multiple sources of evidence in order to strengthen
our results. The sources of evidence during the model
development have included: target system descrip-
tions, UML system models, and presentation slides.
During the workshops, the domain experts were ac-
tively involved in characterization of the weight scale
and the model development. This indicates a common
understanding of the target and the approach.
It is important to emphasize that our case study
was based on a small information system with lim-
ited complexity. In that manner, it may be argued
that SensApp was not a representative case for our
research. However, the size and the complexity of
SensApp were suitable for evaluation of the feasibil-
ity of the approach. Moreover, our evaluation was
conducted with respect to security only, which in turn
MODELSWARD2015-3rdInternationalConferenceonModel-DrivenEngineeringandSoftwareDevelopment
202

is a restriction considering our definition of the func-
tional fulfillment analysis. A broader trade-off anal-
ysis considering several goals simultaneously, would
have been even more realistic. Another important fact
is that the case study mainly aimed at testing feasibil-
ity of the approach. The models developed have not
been verified; their main role was 1) to provide an
example which demonstrates application of the ap-
proach and 2) to facilitate further improvement and
evaluation of the approach. Therefore, the models
should not be considered as correct, nor should the
case study results be regarded as a security analysis
of SensApp.
One missing part we experienced (which a risk
analysis would have included) is the notion of the ac-
ceptance level regarding the degree of fulfillment. We
could namely not tell whether our best decision alter-
native (or combination of thereof) was good enough,
since it did not fully reach the objective. Another
missing feature of the method was explicit optimiza-
tion with respect to degree of fulfillment and overlap.
Yet another assumption we have made when propos-
ing the degree of overlap, is that several decision alter-
natives can be combined. Decision alternatives may
however not always be compatible, in which case it
will not make sense to consider degree of overlap.
The approach has been proposed and evaluated in
the context of security. Rather than applying the exist-
ing security threat and risk oriented approaches (e.g.,
attack trees (Schneier, 1999), CRAMM (Barber and
Davey, 1992), OCTAVE (Alberts and Davey, 2004),
and CORAS (Lund et al., 2011)) we aimed at ex-
plicitly modeling how security features and measures
contribute to the overall security goal. As such, our
approach is more oriented towards early design of a
system, rather than protection of an existing one. A
challenge of the early design is however lack of em-
pirical data for modeling, particularly estimation of
the weights.
Our success criteria are concerned about correct-
ness, expressiveness, and comprehensibility. As ar-
gued above, correctness needs further evaluation and
explicit uncertainty handling. We were able to model
the objective and all decision alternatives, express all
subgoals, functions and mechanisms in the models,
as well as to analyze both degree of fulfillment and
the degree of overlap. The scale proposed seemed to
provide sufficient intuition to assign estimates to the
objective. Hence, there are indications of expressibil-
ity of the models. Moreover, the active participation
of the domain experts and the fact that they were able
to agree upon the final models, indicates comprehen-
sibility of the approach. Main challenge in develop-
ing of the approach was the balancing of the success
criteria. Practical usefulness requires that the models
are sufficiently informative and correct, at the same
time as being easy to understand for a non-expertuser.
Therefore, we have for the sake of simplicity put some
restrictions on the granularity of the models, and the
amount of the information being visualized in the last
step of the approach. Although our results indicate
practical feasibility of the approach, further evalua-
tion is needed in order to assess validity and reliability
of the approach.
7 CONCLUSIONS AND FUTURE
WORK
We have put forward an approach to functional fulfill-
ment analysis. By functional fulfillment analysis we
mean the analysis of 1) degree of fulfillment of a goal,
and 2) degree of overlap between the decision alter-
natives with respect to the goal. The degree of fulfill-
ment expresses the coverage of the measures support-
ing the goal, while overlap expresses the similarity
between the various decision alternatives with respect
to the measures involved. By considering the degree
of fulfillment and the degree of overlap in a uniform
view, we can select a combination of decision alter-
natives which includes most influential security mea-
sures, at the same time as overlaps are avoided. Over-
lapping measures are particularly relevant to avoid
when repetition imposes additional costs.
The approach has been evaluated in a case study
targeting a system called SensApp. The evaluation in-
dicates feasibility in the sense that the approach could
be applied on a case study and provide useful infor-
mation regarding the performance of the decision al-
ternatives. We were able to model functional capabil-
ities of the goal, and the decision alternatives, as well
as to fully analyze both the degree of fulfillment and
the degree of overlap. Additionally, we were able to
visualize the overall performance of the decision al-
ternatives by employing our approach to visualizing
the decision alternatives.
The comprehensibility and the exspressivness of
the models seemed to be satisfactory in the context of
the case study, while correctness of the models need
further enhancements of the approach. The largest
concern is the lack of confidence in the estimates.
The main threat to our findings is that they are de-
pendent and based on subjective matters. More eval-
uation is furthermore needed in order to address the
threats to validity and reliability, but we believe that
the approach could be useful in the context of deci-
sion making where multiple decision alternatives can
be selected and combined.
TowardsFeature-drivenGoalFulfillmentAnalysis-AFeasibilityStudy
203

Based on our initial experiences, we propose fur-
ther work on extending the method with acceptance
levels and compatibility of decision alternatives, un-
certainty handling, process guidance, tool support,
and more empirical evaluation (involving systems
with larger complexity and from other domains). Fu-
ture work should also address the robustness of the
calculations involved in our approach. By robustness
we mean the extent to which the degree of fulfillment
of the decision alternatives would change if the input
estimates change. Related to this, we also intend to
address sensitivity of the approach in general and im-
pact of the decision alternatives in particular.
ACKNOWLEDGMENTS
This work has been partially supported by the
MODAClouds project (Grant Agreement FP7-
318484) and the NESSoS network of excellence –
both funded by European Commission within the 7th
Framework Programme. It has also been partially
supported by the DIAMONDS project funded by the
Research Council of Norway.
REFERENCES
Alberts, C. J. and Davey, J. (2004). OCTAVE criteria ver-
sion 2.0. Technical report CMU/SEI-2001-TR-016,
Carnegie Mellon University.
Alhir, S. S. (1998). UML in a Nutshell – A Desktop Quick
Reference. OReilly & Associates, Inc., Sebastopol,
first edition edition.
Barber, B. and Davey, J. (1992). The use of the ccta
risk analysis and management methodology cramm in
health information systems. In In 7th International
Congress on Medical Informatics, MEDINFO92.
Lund, M. S., Solhaug, B., and Stølen, K. (2011).
Model-Driven Risk Analysis – The CORAS Approach.
Springer.
Mosser, S., Fleurey, F., Morin, B., Chauvel, F., Solberg, A.,
and Goutier, I. (2012). Sensapp as a reference plat-
form to support cloud experiments: From the internet
of things to the internet of services. In Management
of resources and services in Cloud and Sky computing
workshop, Timisoara. IEEE.
Nielsen, D. S. (1971). The cause/consequence diagram
method as basis for quantitative accident analysis.
Technical report RISO-M-1374, Danish Atomic En-
ergy Commission.
Omerovic, A. (2012). PREDIQT: A Method for Model-
based Prediction of Impacts of Architectural Design
Changes on System Quality. Doctoral Dissertation,
Faculty of Mathematics and Natural Sciences, Univer-
sity of Oslo, Oslo.
Omerovic, A., Karahasanovic, A., and Stølen, K. (2012).
Uncertainty handling in weighted dependency trees:
A systematic literature review. In Dependability
and Computer Engineering: Concepts for Software-
Intensive Systems. IGI Global.
Omerovic, A. and Stølen, K. (2011). A practical spproach
to uncertainty handling and estimate acquisition in
model-based prediction of system quality. Interna-
tional Journal on Advances in Systems and Measure-
ments, 4(1-2):55–70.
Ravindran, A. R. (2007). Operations Research and Man-
agement Science Handbook. CRC Press,, Boca Raton.
Runeson, P. and H¨ost, M. (2009). Guidelines for conduct-
ing and reporting case study research in software en-
gineering. Department Computer Science, Lund Uni-
versity.
Schneier, B. (1999). Attack Trees: Modeling Security
Threats. Dr. Dobbs Journal.
Singh, A. G. (2014). Towards a Decision Support Method
for Trade-off Analysis Considering Cost, Risk, and
Quality. MSc Dissertation, Faculty of Mathematics
and Natural Sciences, University of Oslo, Oslo.
Solheim, I. and Stølen, K. (2007). Technology Research
Explained. SINTEF. Technical Report A313, Oslo.
Th¨um, T., K¨astner, C., Benduhn, F., Meinicke, J., Saake,
G., and Leich, T. (2014). FeatureIDE: An Extensi-
ble Framework for Feature-Oriented Software Devel-
opment. Science of Computer Programming.
MODELSWARD2015-3rdInternationalConferenceonModel-DrivenEngineeringandSoftwareDevelopment
204
