
User-centred Design of the User Interface of a Collaborative
Information System for Inter-municipal Dementia Team
Berglind Smaradottir, Elisabeth Holen-Rabbersvik, Elin Thygesen,
Rune Fensli and Santiago Martinez
Centre for eHealth and Healthcare Technology, University of Agder, Jon Lilletuns vei 9, N-4879 Grimstad, Norway
Keywords: Dementia Assessment, Health Information System, Inter-municipal Coordination, User-centred Design.
Abstract: In the Norwegian Health sector there are currently undergoing changes at local, regional and national level
triggered by recent health reforms. Municipalities are facing for first time the duty of implementing new
primary health services. Inter-municipal coordination (IMC) health care teams have been created to operate
across borders to share costs, extend geographical range of operation and optimise resources. This study
focuses on the development and evaluation of the user interface (UI) functional prototype of a collaborative
information system for IMC dementia team in Norway. Employing a user-centred design approach, the
interface prototype was built based on the information gathered on two workshops where the end-users
described their current clinical workflow of dementia assessment and how the UI would best fit into their
daily work. The outcome of the workshops creatively informed the design of a working prototype that was
qualitatively usability tested. Results showed that the UI effectively and efficiently supported the work of
the IMC dementia team, with a sufficient level of satisfaction among the end-users. The resulting prototype
established the foundation for the system implemented in the FP7 EU project United4Health.
1 INTRODUCTION
In Norway, the Coordination reform urged
municipalities to implement new specialised health
care services (Norwegian Ministry of Health and
Care Services, 2008-2009). One key consequence is
the need for an effective coordination and
collaboration between professionals, organisations
and end-users of the Norwegian Health National
system. This could be achieved by a balanced
combination of medical expertise, technology
innovation and interdisciplinary research where new
technological solutions can satisfactorily attend the
demands of the health sector. In this context, the
research project eHealth-extended Care
Coordination evaluated the existing clinical
workflow in an inter-municipal coordination (IMC)
for dementia assessment. The ultimate goal of the
project was to develop a Collaborative Information
System
(CIS) for assessment of dementia for
patients from different municipalities. To
accomplish acceptable levels of effectiveness,
efficiency, and satisfaction, the creation of the final
CIS was preceded by the essential phase of
designing, evaluating and refining the
implementation of a functional prototype. This paper
presents the user-centred design (UCD) (De Vito
Dabbs et al., 2009; Rogers et al., 2011; Nielsen,
1994) and evaluation of the user interface (UI) of a
CIS for IMC dementia team. The prototype was
designed with the active involvement of the end-
users and led by a research team with the essential
participation of an interaction designer. The
prototype was conclusively validated from
operational and a qualitative usability perspective.
The research questions (RQ) of this study were:
RQ1: How can a functional prototype be
developed for the collaborative evaluation and
assessment of dementia taking into account the
needs and the requirements of an IMC dementia
team?
RQ2: What lessons from this study are
transferable to real-world scenario and what
methodological procedures are applicable to the
development of technological solutions for other
clinical workflows?
446
Smaradottir B., Holen-Rabbersvik E., Thygesen E., Fensli R. and Martinez S..
User-centred Design of the User Interface of a Collaborative Information System for Inter-municipal Dementia Team .
DOI: 10.5220/0005222704460453
In Proceedings of the International Conference on Health Informatics (HEALTHINF-2015), pages 446-453
ISBN: 978-989-758-068-0
Copyright
c
2015 SCITEPRESS (Science and Technology Publications, Lda.)
2 RESEARCH BACKGROUND
Research evidence shows that early assessment of
dementia increases case findings (Borson et al.,
2006; Harvan et al., 2006; Boustani et al., 2005;
Callahan et al., 1995). However, negative attitudes
towards assessment and diagnose represent barriers
to efficiently diagnose cognitive deteriorations
(Connolly et al., 2011; Boise et al., 1999; Borson et
al., 2007). Due to the Coordination Reform
(Norwegian Ministry of Health and Care Services,
2008-2009), municipalities are encouraged to
establish IMC in order to carry out new specialised
health tasks. For instance, IMC dementia teams have
been established (Directorate of Health, 2011) for
the assessment of dementia in neighbour
municipalities. IMCs generally face the challenge of
information flow across the different Information
Systems. A CIS for IMCs can be a contributing
factor to improve the information flow in the
medical detection of dementia. The development of
such system requires involvement of end-users to
adapt system to the clinical workflow, taking into
account that a qualitative usability evaluation can
increase user satisfaction and improve operational
procedures (Jaspers, 2009; Bastien, 2010; Kushniruk
and Patel 2004).
This research study focuses on one IMC for
collaborative dementia assessment formed by six
especially trained health care professionals.
3 MATERIALS AND METHODS
The UCD process for the CIS was divided into four
phases: user workshops, development of prototype,
usability evaluation and graphic user interface
evaluation.
3.1 User Workshops
Two workshops with end-users were set up in April
and May 2013. The participants were two members
of an IMC dementia team (mean age of 40.5 years)
with an experience of two years from IMC dementia
team and 11 years of clinical systems’ use. An
interaction designer responsible for the prototype
development participated in the workshops
moderated by two research team members.
The workshops had the aim to analyse the
current workflow of the IMC dementia team,
provide understanding of the context of use and
establish user requirements. The workshops were
arranged as interactive sessions and had an average
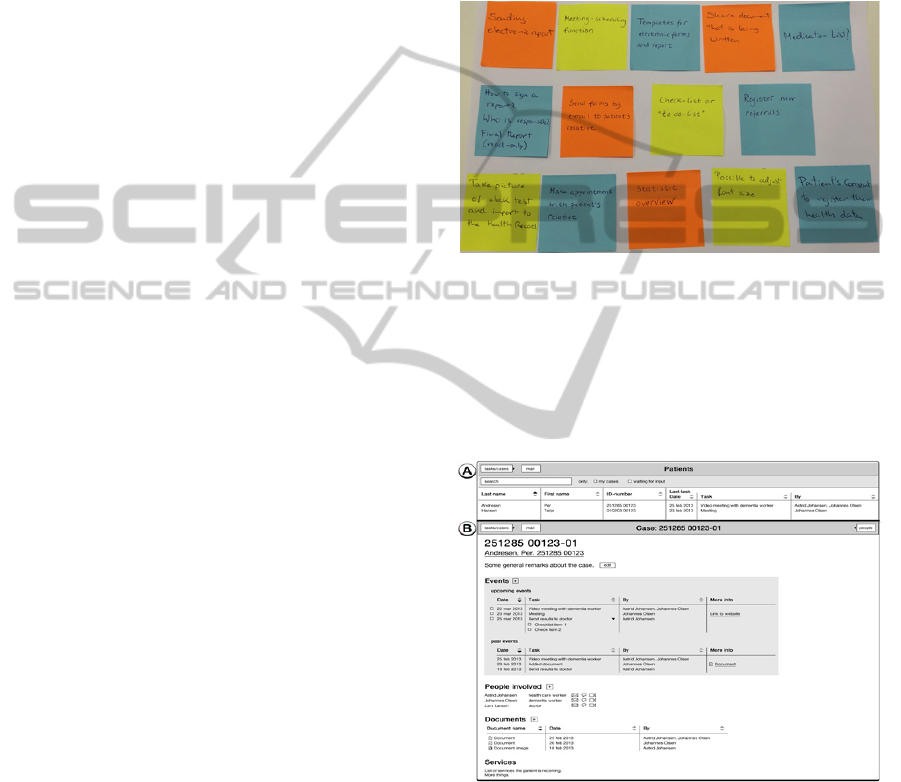
duration of 2.5 hours. In first part of workshop 1, a
patient scenario was created to map the workflow in
the IMC dementia team. The participants described
how they would like to interact with the CIS,
making suggestions about the User Interface Design
(UID). Colourful post-it notes (see Figure 1)
and
hand-made sketches were used to describe ideas for
the functionalities and design of the CIS.
Figure 1: Post-it notes sample from user workshop.
In second part of workshop 1, the interaction
designer presented wireframe sketches (see Figure
2) for the CIS, based on previous research in the
project eHealth-extended Care Coordination. The
participants gave feedback on sketches and made
suggestions about the graphic user interface (GUI).
Figure 2: Wire frame sketches from user workshops. (A)
Overview of patients’ list. (B) Patient’s information data.
In workshop 2, the interaction designer presented a
graphical UI for the CIS, based on the patient
scenario and the user suggestion from workshop 1 to
demonstrate the proposed functionalities and
interface design. The participants’ evaluated and
gave feedback on the proposed GUI.
User-centredDesignoftheUserInterfaceofaCollaborativeInformationSystemforInter-municipalDementiaTeam
447
3.2 Development of Prototype
Based on the user workshops, the interaction
designer developed a prototype for the CIS. The
prototype was developed as an interactive web
application, implementing several of the proposed
functionalities.
3.3 Usability Evaluation
As a part of the UCD process, usability evaluation
was made with end-users performing representative
tasks related to work in IMC dementia team.
The usability evaluation was carried out in the
Usability Laboratory (Gerdes et al., 2014) at the
Centre for eHealth and Healthcare Technology of
the University of Agder in June 2013. The Usability
Laboratory had a test room and observation room
connected through an one-way mirror. The test room
had a laptop and two video cameras and the
observation room had monitors where the research
team could follow in real time the evaluation being
performed. The test participants were 5 IMC
dementia team members, two male and three female,
aged from 25 to 56 years (average of 45) and with an
average of 13.6 years of experience using clinical
systems. They evaluated their computer skills as
‘medium’.
The evaluation team had four members
with health background and ICT background.
The test plan was based on the workflow
description from the user workshops and followed a
concurrent think aloud protocol (TA) (Jaspers, 2009;
Kushniruk and Patel 2004; Nielsen et al., 2002;
Fonteyn et al., 1993; Ericson and Simon, 1980). The
evaluation was run in five individual test sessions
that started with informed consent and a pre-test
interview. The test session were guided by a
moderator and had the duration of 22 to 38 minutes
(average of 27 minutes).
A post-test questionnaire, Scale of Usability
Satisfaction (SUS), (Brooke, 1996) was filled in
individually and two post-evaluation group
interviews (n=3, n=2) were conducted to
qualitatively analyse the output of the test, with an
average duration of 25 minutes.
3.4 Graphic User Interface Evaluation
A graphic user interface evaluation was made in
December 2013 by teachers with graphic design
expertise. There were 3 male participants, with
average age of 45 years and average experience of
14 years in teaching web and interface design. They
did not have previous experience with clinical
systems. The evaluation was run in the Usability
Laboratory as individual test sessions using a TA
protocol with tasks related to graphic design and
understanding of the user interface. The sessions had
a length of 24 to 29 minutes (average of 26 minutes).
3.5 Data Collection
The user workshops, usability evaluation and
graphic user interface evaluation were audio-visually
recorded and transcribed verbatim and categorised
based on qualitative content analysis (Lazar et al.,
2010). In addition, the usability and graphic user
interface evaluations used a screen capture tool.
This study was approved by Norwegian Social
Science Data Services (project number 28027)
4 RESULTS
The results of each phase in the UCD process are
separately presented.
4.1 User Workshops
The results of the user workshops are categorized
into three groups.
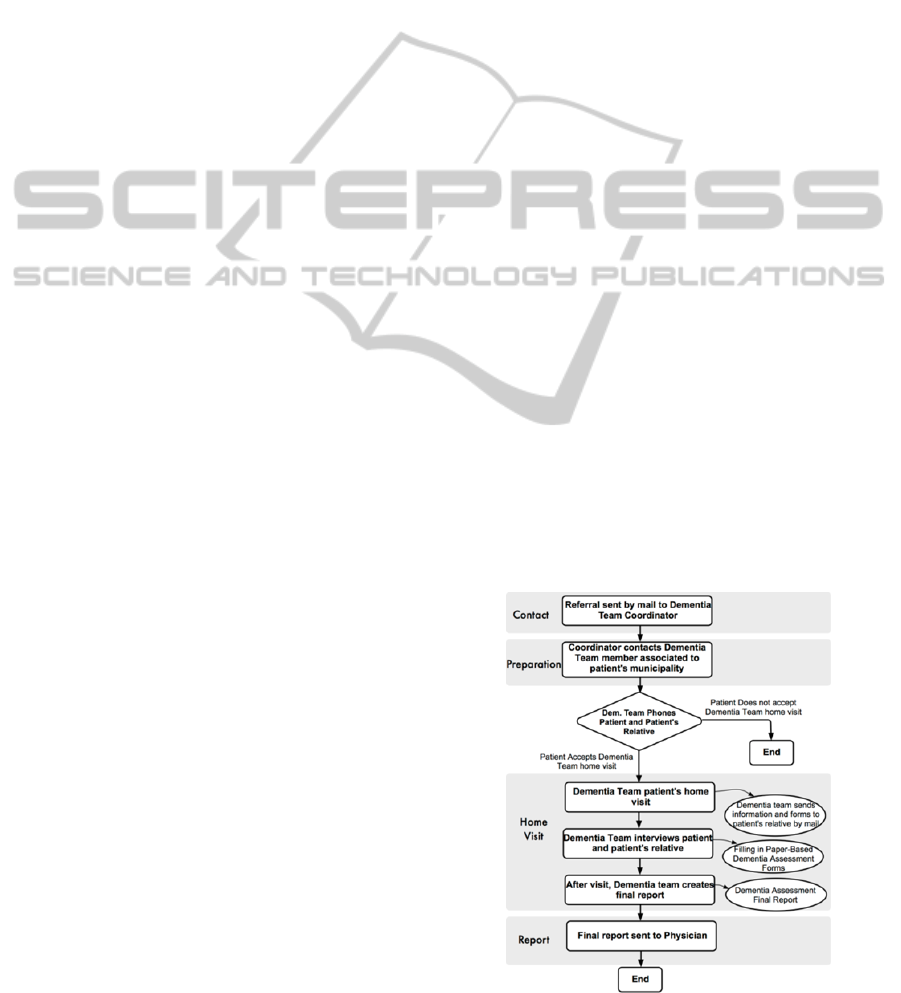
4.1.1 Workflow of Dementia Assessment
The participants described the workflow (see Figure
3) for dementia assessment in an IMC dementia
team as consisting of three main parts: preparation
of dementia assessment, visit to patient’s home and
creation and sending of assessment final report.
Figure 3: Inter-municipal dementia assessment workflow.
HEALTHINF2015-InternationalConferenceonHealthInformatics
448
The information flow was mainly supported by
phone and paper mail communication. The process
started with a paper-based referral to dementia team
coordinator, who established a dementia team for the
individual patient by contacting dementia team
member in patient’s municipality and made an
arrangement for visit to patient’s home. In the home
visit, paper-based dementia assessment forms were
employed and afterwards the dementia assessment
report was created by the dementia team and sent by
paper mail to physician.
4.1.2 User Suggestions for Interaction with
the System
The participants were asked in the workshops how
the CIS could facilitate and improve work processes
within the IMC dementia team. The main idea
suggested was to provide a collaborative access to
the system and improve the electronic information
flow between the municipalities and ideally reduce
phone and post mail communication.
4.1.3 User Suggestions for Interface Design
In terms of UID, users’ suggestions referred to the
visual organisation of the information on the screen.
For instance, a typical “Log in” page with user name
and password was mentioned as a mechanism to
access the system. After entering the system, a
“Home page” would allow to create a new patient
record or find an existing one. When selecting an
existing patient, a new page would show the health
and administrative information related to the
selected patient. In the same page, the patient’s
name should be clearly visible at the top: There
should be no doubt what patient record you are
dealing with. About the graphical layout, it was
more important to have a good contrast than a wide
range of colours: Good contrast instead of too
strong colours. The users suggested having a design
adaptable for both PC and tablet devices, since both
would be used in the described scenario.
Users suggested electronic referral into system,
with automatic transfer of name, birthday and
address into CIS and also who referred the patient.
In addition, a meeting scheduling function, check-
list for tasks to do and video-conference and chat
functionalities. They proposed SMS reminder or
email before home visit to the dementia team
members. Regarding dementia assessment forms,
they proposed a digital version with pre-filled name
from the system and the possibility of taking picture
of relevant documents and information, e.g., clock
test, paper referral and import them to CIS. They
asked for remote access e.g., in patient’s home, and
also screen sharing for simultaneous report writing
in two municipalities. A document had to be un-
editable after finalised and signed by liable person.
Finally, statistics with a selection function was
proposed.
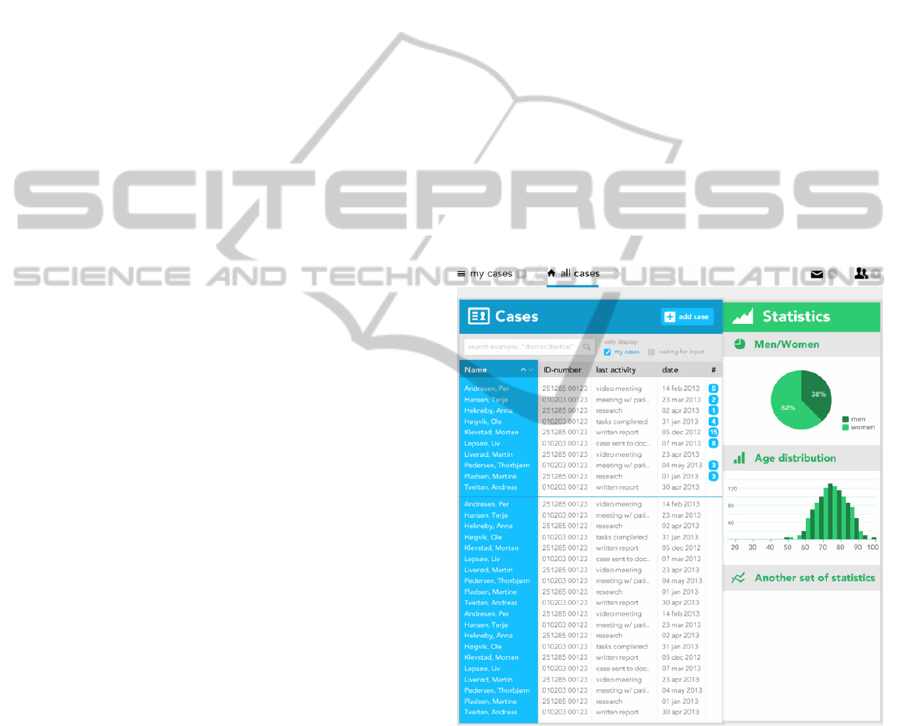
4.2 Development
Based on the user workshops, the interface design of
the prototype for CIS for IMC dementia team was
developed. Figure 4 shows the home page divided in
two sections. The section on the left side (blue
colour), shows the “Overview of patients’ list”
presented after users logged in. The patients under
dementia assessment were placed at the top of the
list. The patients earlier assessed were placed below
the line. The right side (green colour) includes the
statistical data. It contained information
visualisation of data, such as age and gender.
Figure 4: Overview of patients’ list.
By selecting one patient’s name on the patients’
list, the individual patient’s data was presented as
seen in Figure 5. Four sections were differentiated
by colours: Tasks (purple), People involved
(turquoise), Documents (red) and Patient’s personal
information (yellow). The goal was to satisfy user
requirements by maximising the amount and
usefulness of information showed at one glance that
could be easily distinguishable and understandable
without overloading the interface.
User-centredDesignoftheUserInterfaceofaCollaborativeInformationSystemforInter-municipalDementiaTeam
449
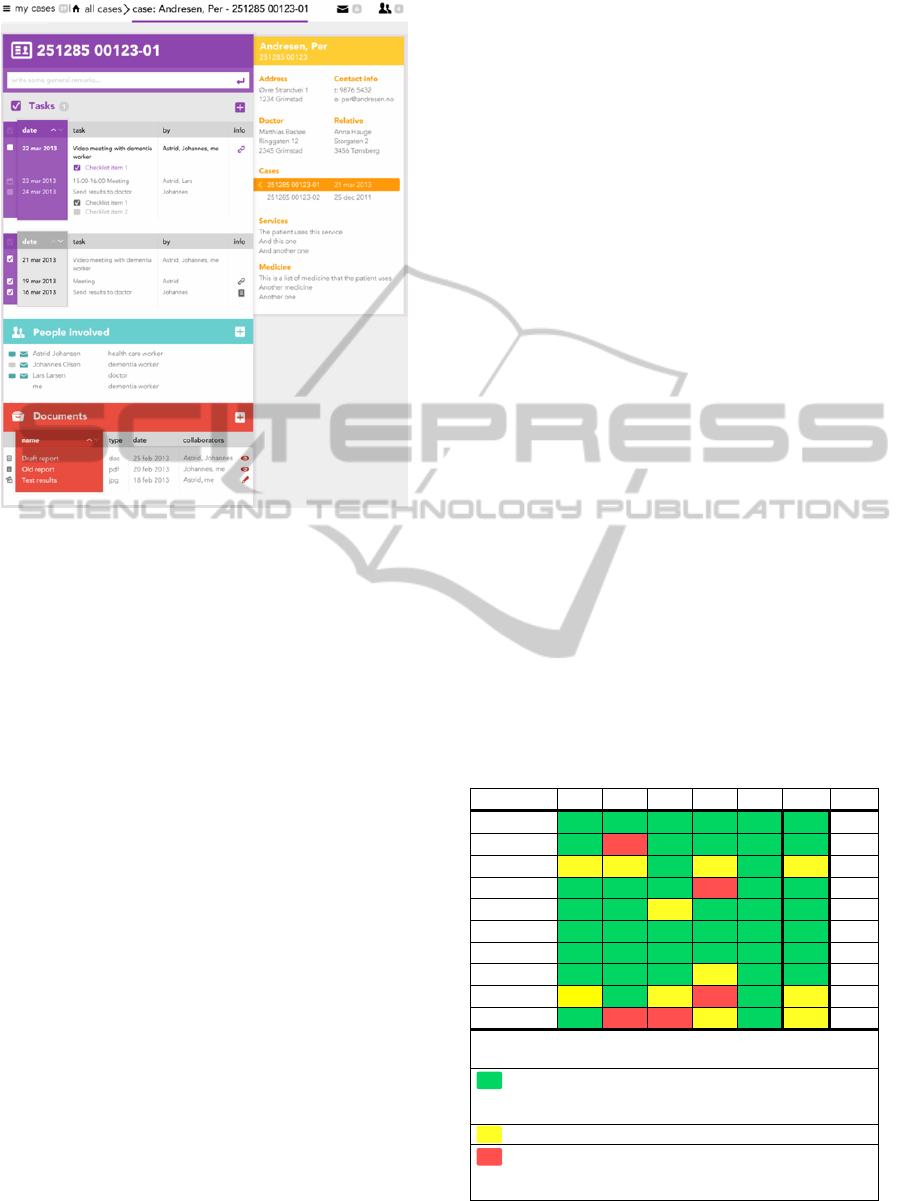
Figure 5: Patient’s information data.
4.3 Usability Evaluation
The overall evaluation was positive, although not all
the aspects of the system were optimally developed.
Some of the issues were caused by the fact that the
assessment was made of a prototype instead of a
fully implemented system. The usability evaluation
entailed 3 tasks, with a total of 15 subtasks and the
analysis revealed 9 usability problems that were
categorised into 3 groups. In addition, the scores of
the Satisfaction Usability Score (SUS) questionnaire
and post-test group interviews are presented.
4.3.1 Graphic Design
7 problems were identified. There were problems
related to understanding of the meaning of icons,
especially the external message icon and its size.
The UI should have to entirely fill the screen in
order to minimize user scrolling. For the task-list, it
was not obvious whether tasks were done or had to
be done, and that the meeting scheduling function
and some numbers beside patient name in overview
of patient list could be misunderstood. In addition,
there was poor visibility of written text in overview
of patients’ list which needed for better colour or
contrast. One stated: The colours are very good
because each theme has its own colour. So you can
know, just by the colour, what you are choosing.
4.3.2 Interaction with the System
In general the interaction during task solving was
successful, but 2 problems were identified. For the
interaction it was not clear how to switch view on
the screen (threes stripes in the left up corner) and
not all participants understood how to add
information to system (“+” symbol on each
heading).
4.3.3 Functionality of System Related to
Work Processes
The possibility to communicate between municipal-
lities through the CIS, instead of via phone or post
mail as it is currently done, was greatly appreciated
by participants. They were unanimously satisfied
about the statistics function and stated that the
video-chat function would provide the opportunity
to collaboratively write a final dementia report at
distance. Some added features were suggested, such
as displaying patient distribution by municipality
and the capacity of reporting different diagnoses to
the government. The visualisation of the patient’s
information data was rated as useful and important,
providing a good overview of key information
visually separated by colours and where the patient’s
name was clearly visible and indicating which
patient’s record was opened. One participant of the
usability evaluation stated: I got a lot of important
information at one glance: patient’s general and
contact information and about his relatives.
Table 1: Satisfaction Usability Scale (SUS).
Question P1 P2 P3 P4 P5 M SD
Q1 4 5 4 5 5 4.6 0.5
Q2 2 4 1 2 1 2.0 1.2
Q3 3 3 4 3 5 3.6 0.9
Q4 1 1 2 4 1 1.8 1.3
Q5 4 4 3 4 5 4.0 0.7
Q6 1 1 2 1 1 1.2 0.4
Q7 4 4 5 4 4 4.2 0.4
Q8 1 1 2 3 1 1.6 0.9
Q9 3 4 3 2 4 3.2 0.8
Q10 2 4 5 3 1 3.0 1.6
Pi = participant i; M = mean; SD = Standard
Deviation
Positive Response: Agree or Strongly Agree for
positive questions; Disagree or Strongly Disagree
for negative questions
Neutral: neither Agree nor Disagree
Negative Response: Agree or Strongly Agree for
negative questions; Disagree or Strongly Disagree
for positive questions
HEALTHINF2015-InternationalConferenceonHealthInformatics
450

4.3.4 Scores of Satisfaction Usability Scale
The scores of the SUS questionnaire are presented in
Table 1 (modified version of MacLellan et. al., 2012
and Bangor et. al., 2009). Overall, the mean of the
satisfaction ratings were on the range of “Agree” or
“Strongly Agree” for the majority of answers to the
positive questions (except one mean rating with
neutral value), and in the range of “Disagree” or
“Strongly Disagree” for the majority of answers for
the negative questions (except two mean ratings with
neutral values).
4.3.5 Post-test Group Interviews
Participants’ comments gathered during the
interviews expressed a need for user-training and
self-exploration of the interface in order to learn
more about how to use the system. One participant
stated: The system realistically fits in our current
workflow; however I would need some user training.
For evaluation of the final version of the system
they suggested a test plan that followed the task
scenario associated with a real patient case. In
addition, performing an individual evaluation
followed by a group one to analyse the system from
a multi-personal perspective was proposed. For the
UID, it was suggested that when placing the mouse
cursor over an icon, its name should be displayed on
the screen, which was also pointed out by the
graphical specialists’ evaluation. Readability and
notification of new messages were relevant for the
participants.
For the functionality of the system,
interoperability with other existing systems was
highlighted, which could ideally eliminate the need
for transferring information between them.
Participants also assumed that the chat function was
a time efficient way to effectively communicate
between colleagues (e.g., asking questions and
getting the answers in a quick way).
4.4 Graphic User Interface Evaluation
The overall evaluation of graphic user interface of
the prototype was positive, but there were some
recommendations for design changes. The
evaluation entailed 2 tasks, with a total of 13
subtasks and revealed 7 usability problems.
4.4.1 Graphic Design
4 problems were identified. The text in overview
patients’ list had poor visibility, were the contrast
between the background colour and text white font
could be improved by including a visible cell border
between the rows. The icon for external messages
and the ‘x’ for closing up patient information were
confusing and could be replaced with more intuitive
ones. Using lines instead of bars in the statistical
charts improved the visual clarity and distinguished
finished tasks from undone ones in the task list.
4.4.2 Interaction with the System
The interaction with the CIS during the task solving
was generally successful, but 3 problems were
identified: when mouse hovers over icon text should
be shown related to the associated action; a
mechanism to navigate backwards should be
inserted for avoidance of using browser back-
oriented arrow; a confirmation notification window
was lacking when adding a new team member
4.4.3 Overall Evaluation
The test participants positively agreed that the
system was designed using validated methods for
designing interfaces. One of them stated that: The
system is clear, easy to read and understand.
The abundance of colours was justified because
they visually informed users about the section’s
functionality in which they were currently working
on. It helped to distinguish different sections at one
glance. Monochromatic or black and white set of
colours would have probably blurred the different
section functionality. This was expressed during the
evaluation: From the design point of view, the
colours are used to separate elements, which works
well to get the overview of the screen. This would
diminish user training. However, it was reported an
insufficient system structure overview because the
different sections of the system could be only
accessed by scrolling down. Instead, providing
redundant access through a menu with the same
colours at the top would probably be more effective
giving a direct access to the sections eliminating
scrolling action. On the “Home page”, the
information load was rated as “too high” but the
overall rating was balanced by the correctly
structured sections, placing the most relevant at the
top.
5 DISCUSSION
The elaboration of a CIS to be used by IMC
dementia teams was developed following a UCD
process. The aim was to support and ease the
User-centredDesignoftheUserInterfaceofaCollaborativeInformationSystemforInter-municipalDementiaTeam
451

existing workflow with a technological solution that
allowed electronic access, storage of patient data and
served as a communication tool. For the RQ1 that
enquired about the prototype development for IMC
dementia team, it was found that a UCD approach
effectively took on board users’ needs regarding the
current workflow of operation. In addition, a test of
such workflow incorporating the prototype in
simulated clinical settings together with a qualitative
usability evaluation was decisive in the development
and refinement of the prototype. For the RQ2 about
the lessons applicable in real-world scenarios, the
study has shown that a fully-implemented system
based on the prototype presented, potentially avoids
the risks associated to paper-based procedures.
Lessons learned throughout this study are three.
Firstly, the workshops with representative users
became essential to gathering the system
requirements. Secondly, through the same
workshops it was possible to acquire the
understanding of the current workflow of operation
of an IMC dementia team. Thirdly, the evaluation of
the prototype tested was performed from a usability
and graphical expert perspectives.
The end-users’ and graphic professional’s
evaluations of the system were generally positive.
The workshops provided a key insight in the
dementia assessment workflow and how the
interaction with the CIS functionality would best fit
the existing work processes. The suggestions about
the UID were made in line with the need to visualise
useful information at one glance at the same time
that the functionalities of the system were clearly
differentiated, for instance, by colours.
In the qualitative usability evaluation the graphic
design and colour scheme used was generally
approved and some features were pointed out as
potentially confusing, such as icons and heading
wording. This is consistent with the development of
prototypes in early stages of UID (Snyder, 2003;
Nielsen, 1993). The iteration process expected in
future work precisely refines these types of
potentially problematic findings. One of the most
acclaimed features was the possibility of
communication through the system by messages and
chat. The statistical summary offered by the system
was unanimously satisfactory because of its
contribution to the workflow.
Finally, the graphic interface evaluation was
made by professionals in the field (Acevedo et al.,
2008; Tory et al., 2005) and valuable
recommendations were incorporated into the design
of the next iteration of the prototype.
There were some limitations associated to this
research study. Firstly, although the laboratory
facilities realistically represented the work
environment, the study was performed in a
simulated environment. Therefore, caution is
required in the direct transferability of the results to
a real-world scenario. Instead, this study might be
seen as a necessary step for the validation of the
controlled conditions that should be carried out
before the use of the system in real clinical settings.
Secondly, the reduced number of participants in the
UCD process might be seen as an impediment of the
applicability of the findings in a larger scale.
However, in qualitative usability studies a small
number of participants can be sufficient for having
valid results (Nielsen and Landauer, 1993). Thirdly,
the prototype was not completely operative
compared to a fully implemented system.
Nevertheless, the prototype provided a satisfactory
simulation of how users could hypothetically
interact with the system in a real scenario.
6 CONCLUSIONS
This work was framed inside the project eHealth-
extended Care Coordination, which revealed a need
for improving communication processes with
efficient technology within IMCs. In this study, a
UCD process was employed in the development of a
working prototype. The CIS would ideally be the
core for a fully-implemented system potentially
adaptable for any health IMC’s team. The end-users’
participation in workshops allowed gathering key
information to build the prototype based on user
needs and requirements. The usability evaluation
together with graphical assessment of the prototype
led to the positive refinement of the functionality,
effectiveness and look and feel of the solution. In
addition, the resulting UI established the foundation
for the technological solution implemented in the
FP7 EU project United4Health (United4Health,
2014), currently being successfully used in IMC in
Norway.
Future research will include a full
implementation of the system, with its
corresponding evaluation in the field from a
usability and operational perspective.
ACKNOWLEDGEMENTS
The authors thank all participants for their
contribution and Joris-Jan van den Boom for the
HEALTHINF2015-InternationalConferenceonHealthInformatics
452

graphic and interaction design. Financial support
was provided by the Regional Research Fund,
Agder, Norway (Grant number 204119-2011).
REFERENCES
Acevedo, D., Jackson, C. D., Drury, F., Laidlaw, D. H.
2008. Using visual design experts in critique-based
evaluation of 2D vector visualization methods. IEEE
Transactions on Visualization and Computer
Graphics, 14(4), 877-884.
Bangor, A., Kortum, P., Miller, J. 2009. Determining
What Individual SUS Scores Mean: Adding an
Adjective Rating Scale. Journal of Usability Studies,
Vol. 4, Issue 3, pp. 114-123.
Bastien, J. M. 2010. Usability testing: a review of some
methodological and technical aspects of the method.
International Journal of Medical Informatics, 79(4),
e18-e23.
Borson, S., Scanlan, J., Hummel, J., Gibbs, K., Lessig, M.,
Zuhr, E. 2007. Implementing routine cognitive
screening of older adults in primary care: process and
impact on physician behavior. Journal of General
Internal Medicine, 22(6), 811-817.
Borson, S., Scanlan, J. M., Watanabe, J., Tu, S. P., Lessig,
M. 2006. Improving identification of cognitive
impairment in primary care. International Journal of
Geriatric Psychiatry, 21(4), 349-355.
Boustani, M., Callahan, C. M., Unverzagt, F. W., Austrom
M. G., Perkins, A. J., Fultz, B. A., Hui, S. L., Hendrie,
H. C. 2005. Implementing a screening and diagnosis
program for dementia in primary care. Journal of
General Internal Medicine, 20(7), 572-577.
Brooke, J. 1996. SUS: a quick and dirty usability scale. In
P. W. Jordan, B. Thomas, B. A. Weerdmeester & I. L.
McLelland, Eds. Usability Evaluation in Industry, pp.
189-194. London: Taylor & Francis.
Callahan, C. M., Hendrie, H. C., Tierney, W. M. 1995.
Documentation and evaluation of cognitive
impairment in elderly primary care patients. Annals of
Internal Medicine, 122(6), 422-429.
Connolly, A., Gaehl, E., Martin, H., Morris, J., Purandare,
N. 2011. Underdiagnosis of dementia in primary care:
variations in the observed prevalence and comparisons
to the expected prevalence. Aging & Mental Health,
15(8), 978-984.
De Vito Dabbs, A., Myers, B.A., Mc Curry, K. R.,
Dunbar-Jacob, J., Hawkins, R. P., Begey, A., Dew, M.
A. 2009. User-centered design and interactive health
technologies for patients. Computers Informatics
Nursing; 27(3): 175–83. doi:
10.1097/NCN.0b013e31819f7c7c.
Directorate of Health and National Expertise Service for
Ageing and Health 2011. Etablering og drift av.
Demensteam, Demensutredning i rimærhelsetjenesten.
[cited 2014 Sept 1]. Available from:
http://www.aldringoghelse.no/ViewFile.aspx?ItemID=282
4.
Ericsson, K. A., Simon, H. A. 1980. Verbal reports as
data. Psychological Review, 87(3), 215.
Fonteyn, M. E., Kuipers, B., Grobe, S. J. 1993. A
Description of Think Aloud Method and Protocol
Analysis. Qualitative Health Research, 3: 430.
Gerdes, M., Smaradottir, B., Fensli R. 2014. End-to-End
Infrastructure for Usability Evaluation of eHealth
Applications and Services,
Scandinavian Conference
on Health Informatics; pp. 53-59, ISSN(print): 1650-
3686, ISSN(online): 1650-3740.
Harvan, J. R., Cotter, V. T. 2006. An evaluation of
dementia screening in the primary care setting.
Journal of the American Academy of Nurse
Practitioners, 18(8), 351-360.
Jaspers, M. W. 2009. A comparison of usability methods
for testing interactive health technologies:
methodological aspects and empirical evidence.
International Journal of Medical Informatics, 78(5),
340-353.
Kushniruk, A. W., Patel, V. L. 2004. Cognitive and
usability engineering methods for the evaluation of
clinical information systems. Journal of Biomedical
Informatics, 37(1), 56-76.
Lazar, J., Feng, J. H., Hochheiser, H. 2010. Research
methods in human-computer interaction. John Wiley
& Sons.
MacLellan, S., Muddimer, A., Peres S. C. 2012. The
Effect of Experience on System Usability Scale
Ratings. Journal of Usability Studies , Vol. 7, Issue 2,
56-67.
Nielsen, J. 1993. Paper Prototyping: Getting User Data
Before You code. NN/g Nielsen Norman Group
http://www.nngroup.com/articles/paper-prototyping/
Nielsen, J., Landauer, T. K. 1993. A mathematical model
of the finding of usability problems. Proceedings of
ACM INTERCHI'93 Conference. Amsterdam, The
Netherlands, 24-29 April, 206-213.
Nielsen, J. 1994. Usability engineering. Elsevier.
Nielsen, J., Clemmersen, T., Yssing, C. 2002. Getting
access to what goes on in people’s heads?- Reflections
on the think-aloud technique. NordiCHI, October 19-
23, p101-110.
Norwegian Ministry of Health and Care Services. 2008-
2009. Report No. 47. The Coordination Reform,
Proper treatment – at the right place and right time.
[cited 2014 Sept 1]. Available from:
http://www.regjeringen.no/upload/HOD/Dokumenter
%20INFO/Samhandling%20engelsk_PDFS.pdf.
Rogers, Y., Sharp, H., Preece, J. 2011. Interaction Design:
Beyond Human Computer Interaction, Wiley. ISBN :
978-0-470-66576-3.
Snyder, C. 2003. Paper prototyping: The fast and easy
way to design and refine user interfaces. Newnes.
Tory, M., Moller, T. 2005. Evaluating Visualizations: Do
Expert Reviews Work?. IEEE Computer Graphics and
Applications, 25(5), 8-11.
United4Health. European funded project United4Health
2014. Available from: http://www.united4health.eu/.
User-centredDesignoftheUserInterfaceofaCollaborativeInformationSystemforInter-municipalDementiaTeam
453
