
De-Novo Assembly of Short Reads in Minimal Overlap Model
Shashank Sharma and Ankit Singhal
Amar Nath and Shashi Khosla School of Information Technology, Indian Institute of Technology Delhi, India
Keywords:
Sequence Assembly, NGS reads, Overlap Graph.
Abstract:
Next Generation Sequencing (NGS) technologies produce millions of short reads that provide high coverage
of genome at much lower cost than Sanger Sequencing based technologies. The advent of NGS technologies
has led to various developments in assembling techniques. Our focus is on adapting overlap graph based
algorithms to work with millions of NGS reads. Due to the high coverage of the genome by NGS reads,
we show that it is feasible to perform assembly while working with small overlaps. This strategy gives us a
significant computational and space advantage over the existing approaches. Our method finds alternate paths
in an overlap graph to construct an assembly. We compare the performance of our tool, MOBS, with some of
the widely used assemblers on ideal datasets (error free reads, distributed uniformly over genome), for which
finished genomes are available. We show that MOBS results are most of the time better than other assemblers
with respect to quality of assemblies, running time and genome coverage.
1 INTRODUCTION
First Generation Sequencing (FGS) technologies, also
known as Sanger Sequencing produce reads of length
exceeding 800 base pairs (bp). The high cost and the
time required to sequence an organism’s genome us-
ing FGS reads led to the development of Next Gen-
eration Sequencing (NGS) technologies. NGS tech-
nologies produce millions of short reads at a cost an
order of magnitude lower than Sanger Sequencing.
Assembling NGS reads poses the following chal-
lenges that are quite different from Sanger reads:
• Short read length, typically 35 bp - 200 bp.
• Higher error rate, about 2%.
• High throughput producing millions of reads.
Despite the challenges posed by NGS reads, a
study by (Whiteford et al., 2005) shows that sequenc-
ing a majority of bacterial genomes is feasible with
read lengths of 20-30 bp. They were also able to as-
semble 80% of chromosome 1 of the human genome,
with contigs of length more than 1000 bp and read
lengths of about 50 bp. Although different assem-
bly methods have been proposed over the years, all
of them can be categorized into the following two
classes:
Overlap-Layout-Consensus (OLC) based: The
OLC based paradigm was first introduced in (Staden,
1980) and subsequently extended in many sequence
assembly algorithms such as Celera (Myers et al.,
2000), CAP3 (Huang and Madan, 1999), PCAP
(Huang et al., 2003), Phusion (Mullikin and Ning,
2003). All pairs suffix-prefix overlaps between reads
are computed and organized in an overlap graph. This
phase consists of expensive string comparisons be-
tween all-pairs of reads. An OLC based algorithm
then constructs a layout and the corresponding con-
sensus sequence of the layout is an assembly. The
OLC paradigm is a very natural way of thinking about
assembly and was used for assembling Sanger reads.
De-Bruijn Graph (DBG) based: The approach was
originally introduced in (Idury and Waterman, 1995),
and the first DBG assembler EULER was published in
(Pevzner et al., 2001). In this model, a node instead of
representing a complete read, represents a k-character
substring of the given reads. Two nodes share an edge
if they overlap with (k − 1) characters. Since DBG
nodes represents fixed length overlaps, efficient meth-
ods for computing these overlaps can be developed.
Several short-read assembly tools based on DBG have
been developed, such as Euler-USR (Chaisson et al.,
2008), Velvet (Zerbino and Birney, 2008), ABySS
(Simpson et al., 2009), AllPath-LG (Gnerre et al.,
2011) and SOAPdenovo (Li et al., 2010) are some of
these. The DBG based assemblers have been success-
ful on small genomes such as bacteria and attempts
are on to extend them to larger genomes.
With the completion of the Cucumber (Huang
44
Sharma S. and Singhal A..
De-Novo Assembly of Short Reads in Minimal Overlap Model.
DOI: 10.5220/0005214100440054
In Proceedings of the International Conference on Bioinformatics Models, Methods and Algorithms (BIOINFORMATICS-2015), pages 44-54
ISBN: 978-989-758-070-3
Copyright
c
2015 SCITEPRESS (Science and Technology Publications, Lda.)

et al., 2009) and Panda (Li et al., 2009) genome
projects using Illumina sequencing, short read based
sequencing is seen as a new cost-effective approach
to generating the draft sequence of large genomes.
OLC based assemblers suffer from two draw-
backs. Consider l reads covering a base of genome,
these reads will have O(l
2
) overlaps. The expected
value of l is the coverage of genome. In case of NGS
methods coverage is very high. Also, a genome gen-
erally consists of repeated regions. For reads covering
these regions, the number of overlaps can be quadratic
in the product of coverage and the number of times a
region is repeated. These factors increase both the
time taken to compute overlaps and the size of over-
lap graph. On the other hand, DBG reduces the size
of the graph by working with k-mers instead of com-
plete reads. How well a DBG models the genome is
highly dependent on the value of k. Small values of
k lead to a reduction in the size of DBG. But DBG
then doesn’t bear any relationship with the genome
length. Since k-mer shares overlaps of exactly (k −1)
characters, with large values of k the overlap informa-
tion between reads may not be captured completely,
as reads may not share any k-mer.
In order to reduce the size of the overlap graph
(Myers, 2005) proposed a new formulation known as
string graph. Consider nodes u, v, w and edges u → v,
v → w, u → w in an overlap graph. The edge u → w
is said to be transitive if the string corresponding to
the path u → w is same as the string corresponding
to the path u → v → w. Reads that are contained
within some other reads and transitive edges are re-
moved from an overlap graph using a linear expected
time method. Although the size of a string graph is
small, it still involves the expensive construction of an
overlap graph. An O(N) method, where N is the total
number of characters in all reads, based on FM-index
to directly construct string graph has been proposed
in (Simpson and Durbin, 2010). The SGA assembler
based on the above, has been described in (Simpson
and Durbin, 2012). Other string graph based assem-
blers are Readjoiner (Gonnella and Kurtz, 2012) and
EDENA (Hernandez et al., 2008). Since N is much
larger than the genome length (by a factor of cover-
age), it would be interesting to see if it is feasible to
avoid processing all N characters of reads and carry
out the reconstruction of a genome.
Minimal Overlap Bushy Structure (MOBS): Our
research is focused on extending the OLC based ap-
proach to assemble NGS reads. Due to the high cov-
erage of the genome by NGS reads, we show that it
is feasible to perform assembly while working with
small overlaps in limited range (under certain as-
sumptions). This strategy gives us a significant com-
putational and space advantage over the existing ap-
proaches. Working with small overlaps paves the way
for developing efficient solutions for computing over-
laps between reads and organizing them in an overlap
graph.
A path in an overlap graph represents one possi-
ble layout of reads. However, experiments indicate
that out of all the overlaps in the range of 10-18 bp
less than 20% are true overlaps (Table 1). The high
percentage of false overlaps is due to small length
overlaps we are working with. There is a high chance
of picking a false overlap edge in a path resulting in
a mis-assembly. In order to increase our confidence
in an assembly, alternate paths starting from a single
node are taken. If all these paths end at the same node,
and the length of strings corresponding to every path
are same, then it is likely that the assembly gener-
ated by all these paths is same. If the assembly gen-
erated by each path is the same, then it is treated as a
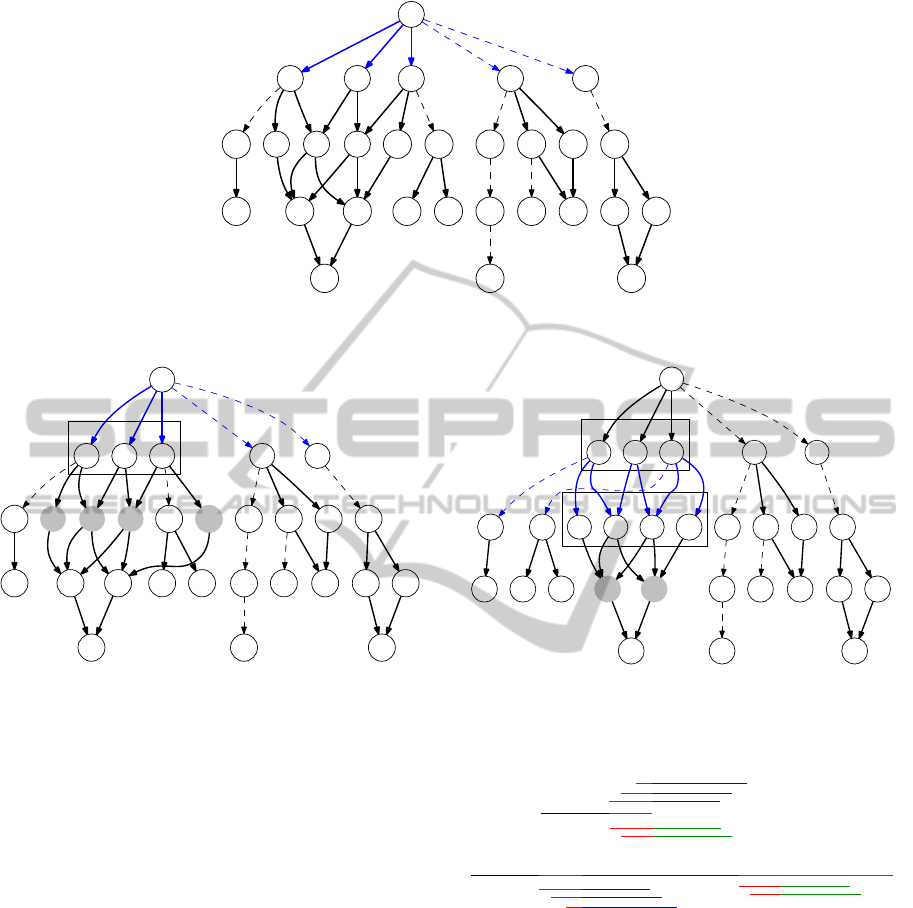
valid assembly. We define a bushy structure as a set
of paths from a source node u to a destination node
v in which the strings corresponding to all paths are
of same length. A bushy structure is said to be cor-
rect if every path in it represents the same assembly
(Figure 1).
1
2
16
3
14
4
10
5
10
6
8
7
14
8
13
22
10 15
9
12 16
10
14
21
10
11
8
23
16
24
10
12
8
13
9 10
14
9
27
16 13 12 14
25
14
26
13
15
10
28
16
29
8 10
16
16
17
15
18
9 10
19
10
20
15 16
Figure 1: Bushy structure in an overlap graph between node
1 and 18. Dotted edges are random overlaps and Bold edges
are true overlaps. Assuming all the reads are of length 50
bp, all paths between node 1 and 18 corresponds to assem-
blies of length 202 bp.
Our experiments show that it is feasible to con-
struct assemblies with almost no errors using the tech-
nique based on small overlaps described in this paper.
We tested the approach reported here on simulated
error-free reads and found that it is both time efficient
and better in terms of quality of results in compari-
son to the existing genome assemblers. Rest of the
paper is organized as follows. Section 2 starts with
the description of an efficient method for constructing
overlap graph containing small overlaps, followed by
the method for extracting bushy structures from over-
De-NovoAssemblyofShortReadsinMinimalOverlapModel
45

Table 1: Percentage of true overlaps in an overlap graph constructed for various genomes at coverage 35.
Genome H. Acinonychis A. Tumefaciens A. Haemolyticum B. Licheniformis
Genome Size 1,553,927 2,841,580 1,986,154 4,222,597
Reads 782,534 1,430,333 1,000,067 2,125,971
Overlaps 49,980,351 112,777,563 35,514,432 186,462,693
True Overlaps(%) 7.1 5.7 13.0 5.2
lap graph and organizing them in a clustered graph.
It ends with an algorithm to generate assemblies from
clustered graphs. In Section 3 we compare the per-
formance of our assembler, MOBS, with some of the
widely used assemblers on ideal datasets (error free
reads, distributed uniformly over genome), for which
finished genomes are available. We show that MOBS
results are most of the time better than other assem-
blers with respect to quality of assemblies, running
time and genome coverage.
2 METHODS
2.1 Overlap Graph Construction
The naive approach to find all overlaps between a
given set of reads is to compare every pair of reads.
This approach has its obvious drawbacks in requir-
ing O(n
2
) string comparisons, where n is the number
of reads. As NGS technologies generates millions of
reads, such an approach is not tractable.
Although the all pairs suffix-prefix algorithm
(Gusfield et al., 1992) computes all overlaps and is
optimal for general strings of arbitrary lengths, it re-
quires construction of a generalized suffix tree of the
input reads. With the high throughput of the NGS
technologies, the size of the suffix tree could be ex-
tremely large, which renders this approach impracti-
cal. This solution could be used in general for finding
overlaps between all pairs of strings when no assump-
tion can be made about the strings. Since our problem
deals with the reads over the fixed characters A, T, G
and C and we are only looking for small overlaps in
a limited range (typically 10 to 18), we do not need
to use a general solution. We have implemented the
following algorithm to construct an overlap graph.
2.2 Sorting based Overlap Graph
Construction Method
We have implemented a solution that is based on the
idea that the alphabet we are working with is fixed
and its size is small (4, in this case). So we can use
a linear sorting method such as radix sort, to order
the reads as per the suffix corresponding to minimum
overlap length, min. Let us call this ordered list be
l
su f f ix
. Similarly, we sort the reads as per their pre-
fixes of length min characters using prefix sort. Let
us call this ordered list be l
pre fix
. Once the reads are
sorted as per their min length suffix and prefix, we
can, in a single pass over two ordered lists l
su f f ix
and
l
pre fix
, find which reads make a suffix-prefix overlap
and add edges in the overlap graph. Now in order to
find overlaps of length min + 1 characters, we con-
tinue the sorting process on l
su f f ix
and l
pre fix
as per
min + 1 length suffixes and prefixes. We scan the two
ordered lists of reads and add edges in the graph. We
continue this process till the edges corresponding to
maximal overlap (max) are added to the graph. The
advantage of our method is that it is linear in space
and avoids the construction of generalized suffix tree
of millions of NGS reads.
2.3 Finding Bushy Structures
We traverse the overlap graph in a breadth first
(BFS) manner to extract bushy structures. Consider
a node u in the overlap graph G. Let children
u
and
grandchildren
u
be the list of children and grandchil-
dren of node u respectively. A child of u either
make a true overlap or false overlap with u. Since
we are working under the assumption that there are
no sequencing errors in the reads, each of the reads
corresponding to the children
u
nodes can be exactly
mapped to the genome that we are trying to assem-
ble. Some of the reads map to the same region of
genome and others map to different region of genome
as shown in Figure 5. The reads that map to the same
region of genome form a group. The problem is to
partition children
u
in groups, without any knowledge
of the genome in question. Since we are working
with the assumption of high-coverage, there are high
chances that the reads belonging to one group share
child nodes. We group two nodes of children
u
if they
have common child. Consider Figure 5, two groups
will be formed corresponding to the two regions of
the genome. Our BFS traversal will explore these two
groups in the next iteration. The traversal terminates
when all the nodes of overlap graph are part of some
group. This process is shown in Figure 2, Figure 3
and Figure 4. All the groups formed by BFS traver-
sal are organized as the nodes of another graph called
BIOINFORMATICS2015-InternationalConferenceonBioinformaticsModels,MethodsandAlgorithms
46
1
2
16
3
14
4
10
5
10
6
8
7
14
8
13
22
10 15
9
12 16
10
14
21
10
11
8
23
16
24
10
12
8
13
9 10
14
9
27
16 13 12 14
25
14
26
13
15
10
28
16
29
8 10
16
16
17
15
18
9 10
19
10
20
15 16
Figure 2: First level of BFS exploration. Note that a true overlap of size 10 exists between nodes 2 and 9. For the purpose of
illustration of algorithm, few edges are omitted.
cluster1
7
13
9
8
10
14
9
9
13 12
10
14
1
2
16
3
14
4
10
5
10
6
8
14 13
22
10 15 12 16 14
21
10
11
8
23
16
24
10
12
8
27
16
25
14
26
13
15
10
28
16
29
8 10
16
16
17
15
18
9 10
19
10
20
1516
Figure 3: Grey nodes 7, 8, 9 and 10 are common children
of nodes 2,3,4. So nodes 2,3 and 4 are clustered.
clustered graph. A Clustered graph is a compact rep-
resentation of all the bushy structures that are formed
during BFS traversal of overlap graph.
2.4 Clustered Graph
Intuitively, a clustered graph brings together or clus-
ters the reads in overlap graph that we believe came
from same region of the genome we are trying to re-
construct. A clustered graph is a refined version of
overlap graph, since the reads that are clustered to-
gether removes the random overlaps of each other. In
some sense, we are trying to add structure to the raw
overlap graph by removing random overlaps (Table
2). Bushy structures are represented by a clustered
graph in which:
• Each node is a collection of reads, which have
high probability of belonging to the same region
of the genome.
• Reads of a node are arranged in the decreasing or-
der of the size of their overlap with the first read in
cluster1
cluster2
13
18
9
14
10
1
2
16
3
14
4
10
5
10
6
8
7
14
8
13
22
10 15
9
12 16
10
14
21
10
11
8
23
16
24
10
12
8
9 10 9
27
16 13 12 14
25
14
26
13
15
10
28
16
29
8 10
16
16
17
15
19
10
20
15 16
Figure 4: Similarly 7, 8, 9 and 10 are clustered on the basis
of common children 13 and 14. In the next iteration, 13
and 14 will be clustered and we will have a clustered graph
(Figure 6).
Genome
Parent read u
Figure 5: Children reads of node u are mapped to genome.
Three of them map to same region and other two map to
different region. Red colored portion represents repeat.
the parent node. A read can make a negative over-
lap (defined later) with the first read of its parent
node.
• A directed edge from node n
1
to node n
2
, has a
weight equal to the size of the overlap between
the last read of n
1
and the first read of n
2
.
A group (clustered graph node) is said to be valid
if all its member reads match exactly at their posi-
tion in the alignment used for making the consensus
De-NovoAssemblyofShortReadsinMinimalOverlapModel
47
1
cluster1
cluster2
cluster3
18
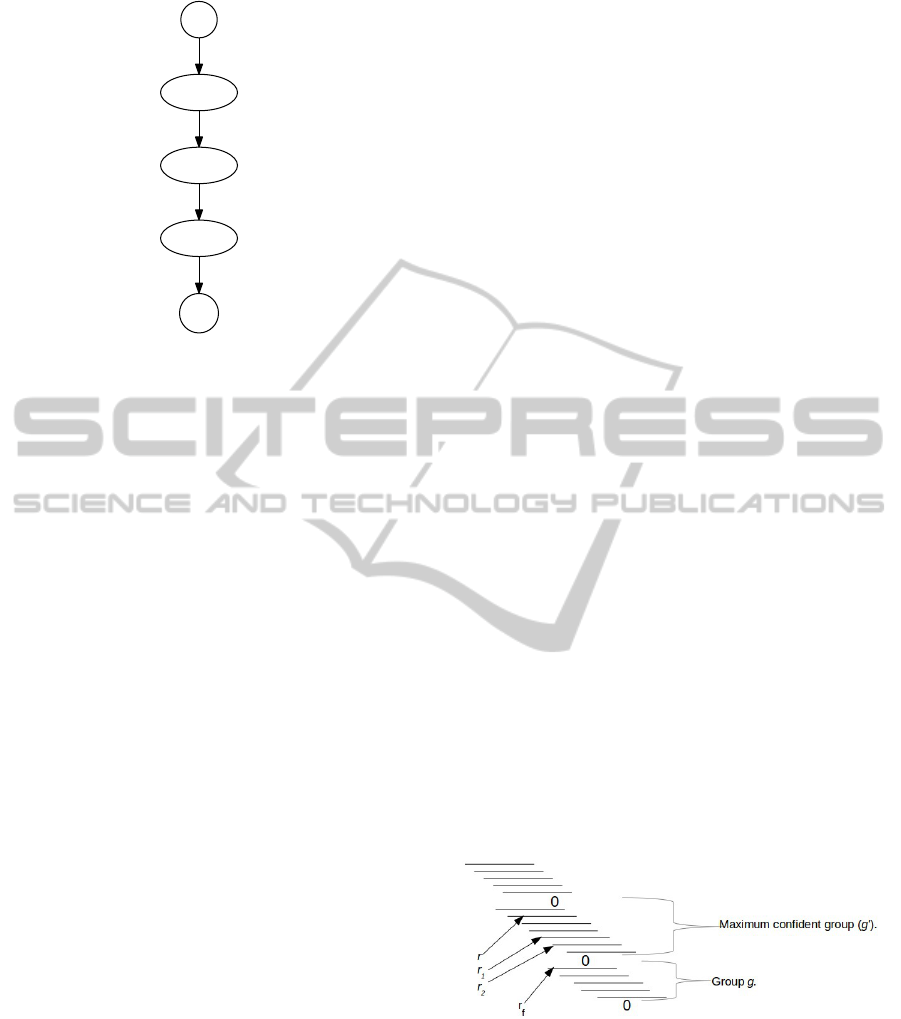
Figure 6: Clustered graph.
sequence. This is illustrated in Figure 7. The con-
sensus sequence of the alignment is called Group Se-
quence. The group sequence corresponding to an in-
valid group is undefined.
GATTAGAGATGAGATAGAAT
ATTAGAGATGAGATAGAATT
TAGAGATGAGATAGAATTAG
GAGATGAAAAAGAATTAGCC
GATGAAAAAGAATTAGCCTG
Figure 7: Invalid Group: The last two reads are not making
consensus. Sixth and eighth base of the last read do not
make consensus with first three reads of the group.
Table 3 shows the number of invalid nodes in
clustered graphs built while assembling different
genomes. The percentage of invalid groups is very
small. Each node of the clustered graph is a level of
the bushy structure that passed through it. If a group
is invalid, then all the bushy structures that passes
through it are invalid. So we can say that percent-
age of the bushy structures that are invalid is also
small. Hence our confidence in bushy structure in-
creases or equivalently our confidence in clustered
graph increases.
A path in a clustered graph represents the assem-
bly constructed by joining the overlapping group se-
quences. Consider a parent node u and its child v in a
clustered graph and let S be an assembly constructed
using nodes u and v. A negative overlap of size l be-
tween first read r
p
of u and a read r
c
of v means that
starting position of read r
c
in S is l characters away
from ending positon of read r
p
in S.
In order to generate longer assemblies, it is de-
sirable that each node of the clustered graph has ex-
actly one parent and one child. However while con-
structing a clustered graph, a node can have more than
one groups as candidate children. To resolve which
of them is a random child and need not be added to
the clustered graph, we resort to heuristics given be-
low. It is observed that groups containing few reads
are formed due to random overlaps. Our first heuristic
removes such groups. Second heuristic adds, if pos-
sible, reads from a larger group to a smaller group g.
Note that these heuristics are strictly based on our ob-
servations and the assumptions that we are working
under.
The following heuristics are used to identify and
remove random children groups from a set of candi-
date children groups for parent group G:
1. If a group has at most two reads and overlap of
the first read in the group is negative with the first
read in parent group, then that group is removed.
2. A group g
max
with largest number of reads in it is
marked as group of maximum confidence and is
added to the clustered graph. Confidence of other
groups is checked with respect to g
max
using fol-
lowing process. Let r
f
and r
G
be the first reads
of groups g and G respectively and O be the size
of the overlap between r
f
and r
G
. Consider two
adjacent reads r
1
and r
2
in g
max
such that overlap
between r
1
with r
G
is greater than O and over-
lap between r
2
and r
G
is at most O. As all the
reads in g
max
are arranged in decreasing order of
their overlaps with r
G
, reads that precedes r
1
in
g
max
make an overlap of size at least O. From all
the reads that precedes r
1
, we look for a read r
which is nearest to r
1
in g
max
such that r is con-
sistent with r
f
(consistency means both r and r
f
have common child reads). Figure 8 shows the
various reads. If such an r exists then all the reads
of group g
max
that precedes r and including r are
prepended to g and g is added to clustered graph
else we don’t add group g to clustered graph.
Figure 8: Checking confidence of g.
2.5 Generating Assemblies
The process of assembly generation works in two
phases:
1. Selecting the clustered graph nodes from which
an assembly is to be constructed.
2. Assembly construction from the selected nodes.
BIOINFORMATICS2015-InternationalConferenceonBioinformaticsModels,MethodsandAlgorithms
48
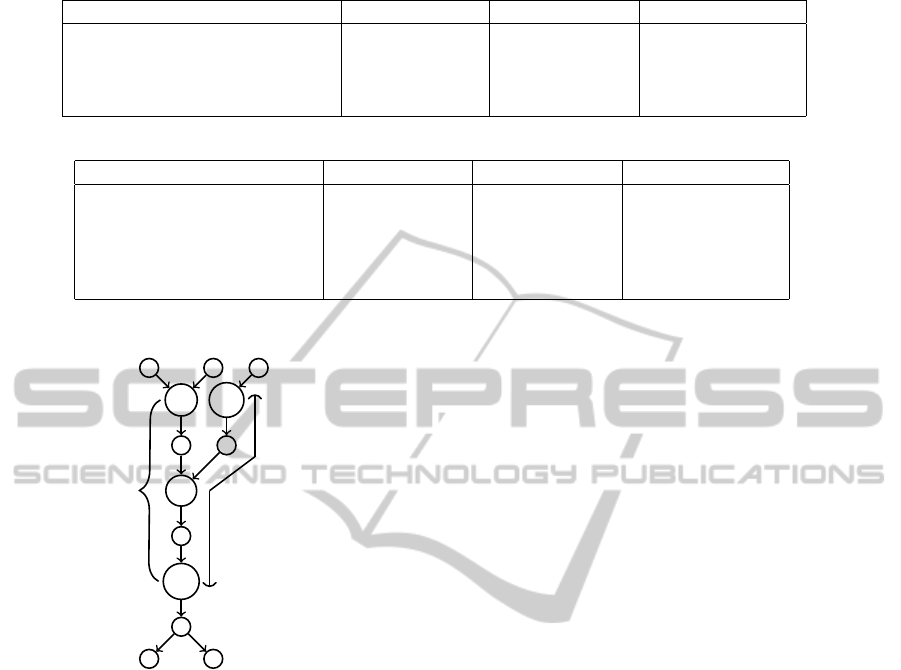
Table 2: Percentage of random overlaps removed from overlap graph.
Genome H. Acinonychis A. Tumefaciens A. Haemolyticum
Reads 1,229,240 2,226,228 1,567,457
Overlaps 123,134,584 282,849,130 87,213,150
Edges after refining 9,094,769 16,774,038 11,845,657
Random Overlaps Removed(%) 92.62 94.07 86.42
Table 3: Percentage of invalid nodes of a clustered graph constructed for various genomes.
Genome H. Acinonychis A. Tumefaciens A. Haemolyticum
Nodes in overlap graph 1,229,240 2,226,228 1,567,457
Nodes in clustered graph 76,081 127,922 89,056
Valid Nodes 75,598 126,537 87,977
Invalid Nodes 483 1,385 1,079
Percentage of Invalid Nodes 0.63% 1.08% 1.20%
a
c
d
b
B
invalid
i
A
Figure 9: Assembly Generation.
We extended the obvious approach of generating as-
semblies by linear chains in the graph created. We
do so because repeats and random overlaps induce
branches in the clustered graph. A linear chain sug-
gests an unambiguous way of generating assemblies
from the graph. But we can observe something more
from the graph.
Consider Figure 9, in which a node has more than
one parent but only one child. The assembly can un-
ambiguously include that node. As mentioned ear-
lier, we will be using group and node interchangeably.
The process of generating assemblies from a clustered
graph is as follows:
1. Pick a node n.
2. If all parents of node n are valid(explained in next
section), do nothing. Assemblies coming from
parent will cover this node.
3. Else start traversing a linear chain starting at node
n.
(a) If a node, w, which has more than one parent
but exactly one child comes in the path, then
do not stop there and include w in the assembly
and go ahead.
(b) Stop one node before a node, whose number of
children is not exactly one.
For example, consider the clustered graph shown
in Figure 9. Node a and b have one parent marked
as invalid. So, we start assembly once from node a
and once from node b. Node c has more than one par-
ent, but exactly one child, so the assembly generation
process does not end there. Also all parents of c are
valid, so no new assembly is started from node c. At
last, assemblies A and B stop at node d, which is one
node above a node having number of child not equal
to one.
3 EXPERIMENTS AND RESULTS
In this section we present comparison of our tool with
contemporary assemblers. EDENA (Hernandez et al.,
2008), Velvet (Zerbino and Birney, 2008), SSAKE
(Warren et al., 2007), CAP3 (Huang and Madan,
1999), SPAdes (Bankevich et al., 2012), SGA (Simp-
son and Durbin, 2012), SOAPdenovo (Li et al., 2010)
and PASQUAL (Xing Liu, 2012) were used for com-
parison. Velvet was executed with k-mer length 29. In
case of SOAPdenovo, k-mer value 31 was used and
option R was enabled as all the reads are from for-
ward strand. CAP3 was executed with option k set to
0 in order to disable end clipping of reads, minimum
suffix-prefix overlap used is 16. Option r was set to 0
to specify that all the reads are from forward strand.
Option n was set to -5 and s was set to 251. In case
of SGA and SPAdes, error correction in reads was not
performed. MOBS was run with the overlaps in the
range of 10-18 bp to perform assembly. Latest ver-
sions of all the assemblers were used for comparison.
We generated ideal dataset (error free reads, dis-
De-NovoAssemblyofShortReadsinMinimalOverlapModel
49
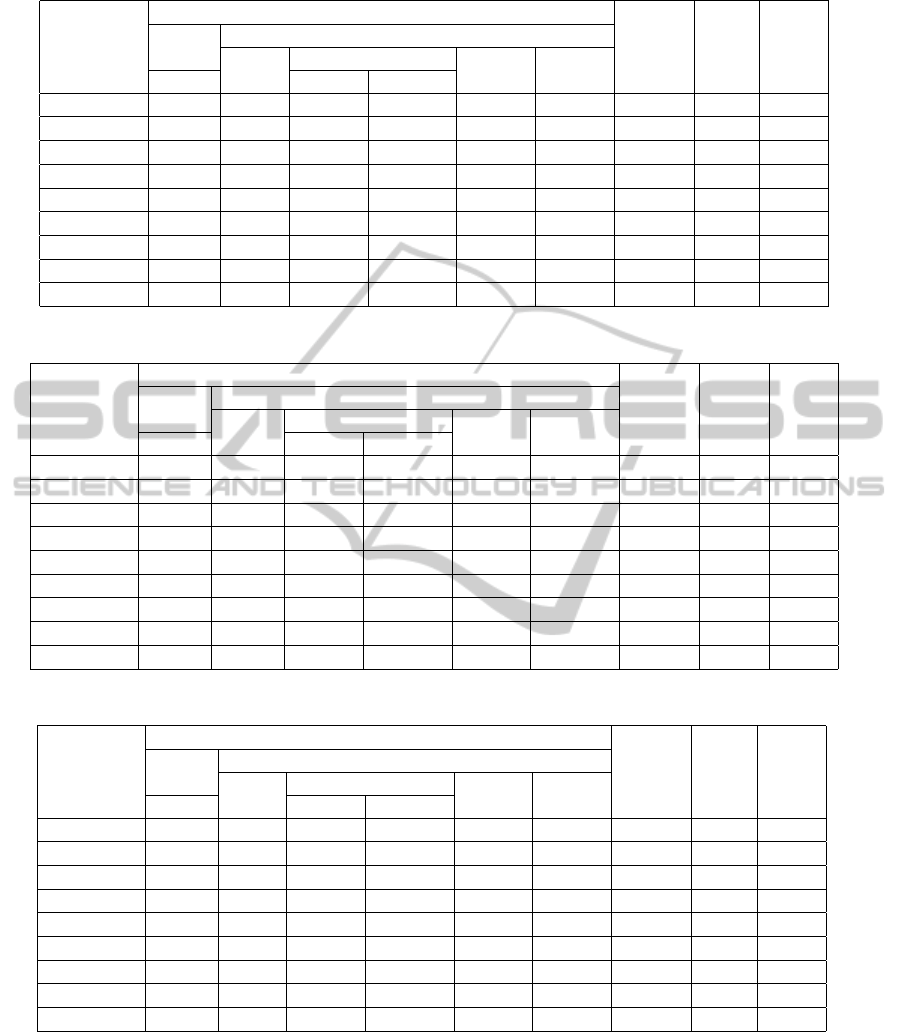
Table 4: Statistics for assemblies on Helico. Aciconychis generated by MOBS and other tools.
Assemblies %Gen-
Incor- Correct -ome Time
-rect Length cove- Min: RAM
Tools Num. Num. Avg. Max. N50 NG50 -red Sec (MB)
MOBS 0 671 8,759 116,650 30,291 88,791 99.63 0:25 773
EDENA 0 221 6,936 68,991 29,764 29,764 99.22 0:41 619
Velvet 9 191 7,969 68,966 23,914 23,486 98.56 0:19 771
SSAKE 13 148 9,241 116,786 39,021 30,294 87.80 1:24 2000
CAP3 12 6732 247 48,467 341 398 94.65 7:07 2989
SPAdes 5 128 11,597 116,696 39,182 39,052 96.30 0:20 334
SGA 5 506 2,988 24,098 5,565 5,522 97.05 1:28 314
SOAP 1 220 6,952 86,956 33,817 33,099 99.36 0:06 2310
PASQUAL 3 152 9,993 68,947 28,340 28,109 98.61 0:07 298
Table 5: Statistics for assemblies on Agro. Tumefaciens generated by MOBS and other tools.
Assemblies %Gen-
Incor- Correct -ome Time
-rect Length cove- Min: RAM
Tools Num. Num. Avg. Max. N50 NG50 -red Sec (MB)
MOBS 0 820 19,318 368,670 61,189 287,241 99.84 0:50 1535
EDENA 0 169 16,795 317,218 46,507 46,507 99.76 1:18 1143
Velvet 1 227 12,489 156,117 31,127 31,127 99.66 0:35 1421
SSAKE 27 152 15,414 367,752 56,347 37,887 82.26 2:38 3655
CAP3 13 17545 161 259,250 160 159 85.55 10:22 5120
SPAdes 8 116 19,971 322,542 76,537 62,025 81.67 0:34 2165
SGA 2 851 3,359 23,354 6,370 6,374 99.36 2:50 575
SOAP 1 368 7,722 321,251 49,905 49,905 99.92 0:11 2706
PASQUAL 4 147 19,067 185,118 32,110 32,110 98.63 0:13 559
Table 6: Statistics for assemblies on Arcano. Haemolyticum generated by MOBS and other tools.
Assemblies %Gen-
Incor- Correct -ome Time
-rect Length cove- Min: RAM
Tools Num. Num. Avg. Max. N50 NG50 -red Sec (MB)
MOBS 2 744 11,449 125,617 41,792 77,495 99.65 0:28 743
EDENA 0 334 5,875 113,667 51,699 51,699 98.92 0:50 790
Velvet 16 354 5,500 105,787 31,700 31,631 97.97 0:24 983
SSAKE 24 238 6,866 113,698 51,640 43,506 82.29 1:49 2648
CAP3 14 9744 201 85,755 253 247 86.65 8:23 3682
SPAdes 23 144 10,158 126,383 57,958 39,294 73.63 0:25 2154
SGA 6 746 2,636 23,587 5,568 5,329 97.96 1:52 399
SOAP 3 463 4,234 134,034 42,665 42,665 98.93 0:08 2710
PASQUAL 5 176 10,983 126,362 45,653 43,105 97.64 0:09 372
tributed uniformly over genome) for the following
genomes:
1. Helicobacter Aciconychis (1.55 Mbp),
2. Agrobacterium Tumefaciens (2.84 Mbp),
3. Arcanobacterium Haemolyticum (1.98 Mbp),
4. Bacillus Licheniformis (4.22 Mbp).
Single ended reads of length 50 bp were generated
and duplicate reads were removed from the dataset.
Resulting dataset provided an average coverage of
40x and maximum coverage of 50x. The assemblers
were executed on an Intel i7 CPU(8 logical cores of
3.4 GHz each) with 8GB RAM with Ubuntu 14.04 as
operating system.
When working with simulated data, the quality of
BIOINFORMATICS2015-InternationalConferenceonBioinformaticsModels,MethodsandAlgorithms
50

Table 7: Statistics for assemblies on Bacillus Licheniformis generated by MOBS and other tools.
Assemblies %Gen-
Incor- Correct -ome Time
-rect Length cove- Min: RAM
Tools Num. Num. Avg. Max. N50 NG50 -red Sec (MB)
MOBS 4 761 24,231 434,227 105,722 410,753 99.59 1:14 2248
EDENA 0 292 14,341 262,859 110,070 110,070 99.71 2:2 1686
Velvet 9 266 15,682 262,783 89,249 89,249 98.87 0:53 2097
SSAKE 41 233 13,520 262,886 129,457 103,005 74.63 3:57 5420
CAP3 11 24005 139 262,940 124 98 68.30 13:04 6346
SPAdes 20 234 14,545 262,868 121,317 95,083 80.78 0:55 2200
SGA 7 1418 2,978 24,007 5,894 5,894 98.82 4:16 847
SOAP 3 495 8,458 262,831 104,524 102,970 99.31 0:16 2875
PASQUAL 7 135 28,180 262,799 103,902 95,044 90.73 0:20 801
Table 8: Analysis of correct assemblies, on Helico. Aciconychis, after removing contained assemblies.
Suffix-Prefix
Number Avg Genome Overlaps len>=20
Tools Length N50 NG50 Covered Total Correct
MOBS 212 9,245 24,296 36,325 99.62 200 198
EDENA 221 6,936 29,764 29,764 99.22 242 191
Velvet 191 7,969 23,914 23,486 98.56 142 105
SSAKE 147 9,303 39,021 30,294 87.80 142 96
CAP3 6732 247 341 398 94.65 5234 5229
SPAdes 127 11,687 39,182 39,052 96.30 182 142
SGA 506 2,998 5,565 5,522 97.05 615 510
SOAP 220 6,952 33,817 33,099 99.36 530 374
PASQUAL 152 9,993 28,340 28,109 98.61 27 25
Table 9: Analysis of correct assemblies, on Agro. Tumefaciens, after removing contained assemblies.
Suffix-Prefix
Number Avg Genome Overlaps len>=20
Tools Length N50 NG50 Covered Total Correct
MOBS 175 18,998 44,581 60,888 99.84 110 110
EDENA 169 16,795 46,507 46,507 99.76 530 140
Velvet 227 12,489 31,127 31,127 99.66 320 97
SSAKE 152 15,414 56,347 37,887 82.26 391 156
CAP3 17,544 161 160 159 85.55 10273 10223
SPAdes 105 22,059 76,537 62,025 81.66 482 147
SGA 851 3,359 6,370 6,374 99.36 1659 1142
SOAP 367 7,743 49,905 49,905 99.92 3370 2479
PASQUAL 147 19,067 32,110 32,110 98.63 16 2
assemblies can be assessed by aligning them against
the reference genome. We call assemblies having
an exact match in the reference genome as correct
assemblies. Only the correct assemblies were used
to compute the genome covered. As we had reads
from only forward strand of the genome, thus the
assemblies produced were aligned against forward
strand of the genome to assess the quality of the as-
semblies. Only half of the assemblies produced by
SPAdes and SOAP had an exact alignment with for-
ward strand of the genome. When these assemblies
were matched against both forward and reverse com-
plemented strand, then almost all of the assemblies
had an exact alignment. Thus the results specify-
ing the quality of assemblies for SPAdes and SOAP
were generated by aligning the assemblies against
both forward and reverse complemented strand of the
genome. For rest of the assemblers, quality of assem-
De-NovoAssemblyofShortReadsinMinimalOverlapModel
51
Table 10: Analysis of correct assemblies, on Arcano. Haemolyticum, after removing contained assemblies .
Suffix-Prefix
Number Avg Genome Overlaps len>=20
Tools Length N50 NG50 Covered Total Correct
MOBS 280 8,850 46,549 50,765 99.65 352 348
EDENA 334 5,875 51,699 51,699 98.92 379 271
Velvet 354 5,500 31,700 31,631 97.97 4422 216
SSAKE 238 6,866 51,640 43,506 82.29 268 166
CAP3 9,742 201 253 247 86.65 6,344 6,338
SPAdes 138 10,597 57,958 39,294 73.63 158 117
SGA 746 2,636 5,568 5,329 97.96 990 858
SOAP 454 4,317 42,665 42,665 98.92 6550 1218
PASQUAL 176 10,983 45,653 43,105 97.64 16 14
Table 11: Analysis of correct assemblies, on Bacillus Licheniformis, after removing contained assemblies .
Suffix-Prefix
Number Avg Genome Overlaps len>=20
Tools Length N50 NG50 Covered Total Correct
MOBS 227 20,820 90,459 105,726 99.59 218 217
EDENA 292 14,341 110,070 110,070 99.71 316 220
Velvet 266 15,682 89,249 89,249 98.87 199 143
SSAKE 226 13,937 129,457 103,005 74.63 243 138
CAP3 24003 139 124 98 68.30 12304 12289
SPAdes 218 15,609 121,317 95,083 80.78 390 277
SGA 1418 2,978 5,894 5,894 98.82 2133 1820
SOAP 490 8,544 104,524 102,970 99.31 1606 1392
PASQUAL 135 28,180 103,902 95,044 90.73 15 14
blies is accessed by aligning the assemblies against
only forward strand of the genome. Tables 4, 5, 6
and 7 show the number of correct/incorrect assem-
blies, average and maximum length, percentage of
genome covered, time, RAM used and percentage of
CPU used for each of the assemblers run on the four
respective genomes. Some of the observations that
can be inferred from the tables are given below.
The maximum assembly length, in case of MOBS
is 116650, 368670, 125617, 434227 for H. Aci-
conychis, A. Tumefaciens, A. Haemolyticum and
B. Licheniformis respectively. The maximum as-
sembly length as produced by the other assemblers
is 116786(SSAKE), 367752(SSAKE), 134034(SOAP)
and 262940(CAP3) for these genomes.
Interestingly, in case of B. Licheniformis, all other
assemblers (except SGA) produced maximum assem-
bly length 262kbp.
The percentage of genome covered by assem-
blies in case of MOBS is 99.63%, 99.84%, 99.65%
and 99.59% for H. Aciconychis, A. Tumefaciens,
A. Haemolyticum and B. Licheniformis respectively.
The maximum percent of genome covered among
other assemblers is 99.36%(SOAP), 99.92%(SOAP),
98.93%(SOAP) and 99.71%(EDENA).
We also observed that some assemblies were sub-
strings of some bigger assemblies. We call such as-
semblies as contained assemblies. The quality of cor-
rect assemblies is reported again after removing con-
tained assemblies from the set of correct assemblies
generated by the assemblers. Table 8, 9, 10 and 11
show the number of correct assemblies after remov-
ing contained assemblies among correct assemblies.
These tables also show the average length of the re-
maining assemblies, their N50 and NG50 values, per-
centage of genome covered and total/correct num-
ber of suffix-prefix overlaps among remaining assem-
blies.
Note that the performance of MOBS is mostly
among the top 3, if not the best.
The percentage of genome covered by assem-
blies in case of MOBS is 99.62%, 99.84%, 99.65%
and 99.59% for H. Aciconychis, A. Tumefaciens,
A. Haemolyticum and B. Licheniformis respectively.
The maximum percent of genome covered among
other assemblers is 99.36%(SOAP), 99.92%(SOAP),
98.92%(SOAP, EDENA) and 99.71%(EDENA).
Thus, we can observe that MOBS produce highest
genome covered in case of H. Aciconychis and A.
Tumefaciens.
BIOINFORMATICS2015-InternationalConferenceonBioinformaticsModels,MethodsandAlgorithms
52

We also observe that, in case of MOBS almost all
of the suffix-prefix overlaps among remaining assem-
blies are true overlaps. By true overlap we mean that
these overlaps are present among assemblies, when
the assemblies are aligned against genome. Thus
even if MOBS may not report the best performance
on based on length of the assemblies, the suffix-prefix
overlaps among assemblies can be used to generate
bigger assemblies.
While MOBS runs reasonably fast, time compari-
son is not very meaningful as all the other assemblers
that report faster times seem to be multi-threaded.
MOBS at present has a single threaded implementa-
tion.
4 FUTURE WORK AND
CONCLUSIONS
In this paper, we presented a method to generate as-
semblies from short reads using only short length
overlaps. This approach produces comparable results
while reducing the computational effort. There are
many possibilities for further improvement of results
using this approach. Generating assemblies that are
not contained in others is one. Developing algorithms
that generate larger assemblies is another and how do
we need to modify our algorithm to handle challenges
in real data such as error in reads and reads from both
strands of genome.
Comparisons given here are only indicative of the
promise of the approach and should not be taken as
the final word as some of the assemblers, used in the
comparison, do not give an option to set the error
model. We are working to extend this technique and
a full and final version will have its results on the real
data.
ACKNOWLEDGEMENT
This work is a part of the ongoing research program
on de novo genome assembly of Prof. S.N. Mahesh-
wari at IIT Delhi.We thank Prof. Maheshwari for his
guidance and support. We are also grateful to Prof.
Sanjiva Prasad for useful discussions. This work
has been partly supported from his project “Founda-
tions of Trusted and Scalable ’Last-Mile’ Healthcare”
funded by DeitY, Government of India.
REFERENCES
Bankevich, A., Nurk, S., Antipov, D., Gurevich, A. A.,
Dvorkin, M., Kulikov, A. S., Lesin, V. M., Nikolenko,
S. I., Pham, S., Prjibelski, A. D., et al. (2012). Spades:
a new genome assembly algorithm and its applications
to single-cell sequencing. Journal of Computational
Biology, 19(5):455–477.
Chaisson, M. J. P., Brinza, D., and Pevzner, P. A. (2008).
De novo fragment assembly with short mate-paired
reads: Does the read length matter? Genome Re-
search, 19(2):336–346.
Gnerre, S., Maccallum, I., Przybylski, D., Ribeiro, F. J.,
Burton, J. N., Walker, B. J., Sharpe, T., Hall, G., Shea,
T. P., Sykes, S., Berlin, A. M., Aird, D., Costello, M.,
Daza, R., Williams, L., Nicol, R., Gnirke, A., Nus-
baum, C., Lander, E. S., and Jaffe, D. B. (2011). High-
quality draft assemblies of mammalian genomes from
massively parallel sequence data. Proceedings of the
National Academy of Sciences of the United States of
America, 108(4):1513–1518.
Gonnella, G. and Kurtz, S. (2012). Readjoiner: a fast and
memory efficient string graph-based sequence assem-
bler. BMC bioinformatics, 13(1):82.
Gusfield, D., Landau, G. M., and Schieber, B. (1992). An
efficient algorithm for the all pairs suffix-prefix prob-
lem. Information Processing Letters, 41(4):181 – 185.
Hernandez, D., Franc¸ois, P., Farinelli, L., Øster
˚
as, M., and
Schrenzel, J. (2008). De novo bacterial genome se-
quencing: millions of very short reads assembled on a
desktop computer. Genome research, 18(5):802–809.
Huang, S., Li, R., Zhang, Z., Li, L., Gu, X., Fan, W., Lucas,
W. J., Wang, X., Xie, B., Ni, P., et al. (2009). The
genome of the cucumber, cucumis sativus l. Nature
genetics, 41(12):1275–1281.
Huang, X. and Madan, A. (1999). Cap3: A dna sequence
assembly program. Genome research, 9(9):868–877.
Huang, X., Wang, J., Aluru, S., Yang, S.-P., and Hillier,
L. (2003). Pcap: a whole-genome assembly program.
Genome research, 13(9):2164–2170.
Idury, R. M. and Waterman, M. S. (1995). A new algo-
rithm for DNA sequence assembly. Journal of com-
putational biology, 2(2):291–306.
Li, R., Fan, W., Tian, G., Zhu, H., He, L., Cai, J., Huang, Q.,
Cai, Q., Li, B., Bai, Y., et al. (2009). The sequence and
de novo assembly of the giant panda genome. Nature,
463(7279):311–317.
Li, R., Zhu, H., Ruan, J., Qian, W., Fang, X., Shi, Z., Li,
Y., Li, S., Shan, G., Kristiansen, K., Li, S., Yang, H.,
Wang, J., and Wang, J. (2010). De novo assembly
of human genomes with massively parallel short read
sequencing. Genome Research, 20(2):265–272.
Mullikin, J. C. and Ning, Z. (2003). The phusion assembler.
Genome research, 13(1):81–90.
Myers, E. W. (2005). The fragment assembly string graph.
Bioinformatics, 21(suppl 2):ii79–ii85.
Myers, E. W., Sutton, G. G., Delcher, A. L., Dew, I. M., Fa-
sulo, D. P., Flanigan, M. J., Kravitz, S. A., Mobarry,
C. M., Reinert, K. H., Remington, K. A., et al. (2000).
De-NovoAssemblyofShortReadsinMinimalOverlapModel
53

A whole-genome assembly of drosophila. Science,
287(5461):2196–2204.
Pevzner, P. A., Tang, H., and Waterman, M. S. (2001). A
new approach to fragment assembly in DNA sequenc-
ing. In RECOMB ’01: Proceedings of the fifth an-
nual international conference on Computational biol-
ogy, pages 256–267, New York, NY, USA. ACM.
Simpson, J. T. and Durbin, R. (2010). Efficient construc-
tion of an assembly string graph using the fm-index.
Bioinformatics, 26(12):i367–i373.
Simpson, J. T. and Durbin, R. (2012). Efficient de novo as-
sembly of large genomes using compressed data struc-
tures. Genome research, 22(3):549–556.
Simpson, J. T., Wong, K., Jackman, S. D., Schein, J. E.,
Jones, S. J. M., and Birol, I. (2009). ABySS: A par-
allel assembler for short read sequence data. Genome
Research, 19(6):1117–1123.
Staden, R. (1980). A new computer method for the storage
and manipulation of DNA gel reading data. Nucleic
acids research, 8(16):3673–3694.
Warren, R. L., Sutton, G. G., Jones, S. J., and Holt, R. A.
(2007). Assembling millions of short dna sequences
using ssake. Bioinformatics, 23(4):500–501.
Whiteford, N., Haslam, N., Weber, G., Pr
¨
ugel-Bennett, A.,
Essex, J. W., Roach, P. L., Bradley, M., and Neylon, C.
(2005). An analysis of the feasibility of short read se-
quencing. Nucleic acids research, 33(19):e171–e171.
Xing Liu, Pushkar R. Pande, H. M. D. A. B. (2012).
Pasqual: Parallel techniques for next generation
genome sequence assembly.
Zerbino, D. R. and Birney, E. (2008). Velvet: Algo-
rithms for de novo short read assembly using de Bruijn
graphs. Genome Research, 18(5):821–829.
BIOINFORMATICS2015-InternationalConferenceonBioinformaticsModels,MethodsandAlgorithms
54
