
Tracking of Monthly Health Condition Change from Daily
Measurement of Systolic Blood Pressure
Wenxi Chen
1
and Toshiyo Tamura
2
1
Biomedical Information Technology Lab., CAIST, The University of Aizu, Tsuruga, Aizu-wakamatsu 965-8580, Japan
2
Faculty of Biomedical Engineering, Osaka Electro-Communication University, Shijonawate, Osaka 575-0063, Japan
Keywords: Health Condition, Biorhythm, Long-term Monitoring, Monthly Change, Daily Measurement, Systolic Blood
Pressure, Healthcare, Dynamic Time Warping.
Abstract: This paper presents an approach to detect monthly biorhythmic change using daily measurement of systolic
blood pressure (SBP) at home. As a part of health promotion campaign initiated in 1994, more than 600
households in West Aizu village of northern Japan were provided devices for daily measurement of blood
pressure, electrocardiogram, body temperature and body weight. This paper demonstrates an outcome of
data analysis of daily SBP collected in two years from an elder couple at age of seventies. The personal
reference profile is gained by averaging individual monthly profiles over 24 months. Dynamic time warping
algorithm estimates the similarity between personal reference profile and monthly SBP profile. The results
show that an extraordinary deviation from usual biorhythmicity can be found in both the wife and the
husband happened in July and February which respectively indicates individual health condition change
confirmed by personal medical record. The results suggest that even it is difficult to identify any significant
variation from the daily SBP directly, proper analysis of the raw SBP measured over a long-term period
helps tracking functional information of health condition change and serving as an effective evidence for
health management.
1 INTRODUCTION
Flood of information brings a big impact on the way
we live and work. Every day, 2.5 quintillion bytes of
data are being generated, and so much that 90% of
the data in the world today have been created in the
last two years alone (IBM Corp., 2011). These data
come from everywhere such as sensors, posts,
pictures and videos, transaction records and personal
information. Increase in quantity philosophically
will lead to profound change in quality. The vast
amount of data is more than simply a matter of size,
and sometimes is likely a double-edged sword. It
usually has a huge reserve of latent information but
often blurs the focus of the interests.
It is crucially an important challenge in exploring
proper approaches to handle these data and to mine
functional information from daily accumulated such
kind of data, and ultimately to discover structural
knowledge for real world application (Zins, 2007).
Detection of influenza epidemics using only
search engine query data announced the arrival of
the Big Data age and paved the way for finding new
value from multiple disciplines (Ginsberg et al.,
2008).
Diversified devices were developed to acquire
multifarious physiological data under daily life
environment conveniently. Variety of algorithms
were devised to reveal the relationship between data
features and physiological signatures in healthcare
domain.
West Aizu village, located in northern Japan and
about 300 km away from Tokyo, had pioneered the
“Challenge to 100 years of age” project since 1994.
The project had been supported by various financial
resources of total 2.4 billion Japanese Yen, and
established its fundamental goal to promote healthier
life by providing a total care solution package to
villagers (West Aizu, 2003). The village built a
cable television network infrastructure, improved the
soil for the cultivation of crops, enhanced
educational programs on the importance of a
nutritionally balanced diet and good lifestyle
practice, and initiated a health promotion campaign.
Special tailor-made devices were distributed to 687
households among total 2,819 families in the village.
Daily physiological data are measured by
69
Chen W. and Tamura T..
Tracking of Monthly Health Condition Change from Daily Measurement of Systolic Blood Pressure.
DOI: 10.5220/0005203400690074
In Proceedings of the International Conference on Health Informatics (HEALTHINF-2015), pages 69-74
ISBN: 978-989-758-068-0
Copyright
c
2015 SCITEPRESS (Science and Technology Publications, Lda.)
participants at home and transmitted from home to
the healthcare centre via the cable network.
This paper is to explore a feasible way to harvest
such kind of daily data accumulated over a long-
term period, and to find structural and functional
information which can be linked to health condition
change.
2 METHOD AND MATERIAL
2.1 Data Collection
The tailor-made device can measure systolic blood
pressure (SBP), diastolic blood pressure (DBP),
body temperature (BT), body weight (BW), one-
minute electrocardiogram (ECG) and heart rate (HR)
profile, and also collect answers to a daily
questionnaire displaying on a LCD screen after
completion of daily measurement. Measured data are
transmitted to the healthcare centre by home
network connection and accumulated in the database
server of the centre. The time of the daily
measurement is not strictly stipulated: preference of
the morning or the afternoon is at the disposal of the
participants. Seven nurses are in charge of the data
review and respond to inquiries from the
participants. Biochemical markers from blood and
urine samples are also collected in yearly regular
health check-up.
The participants involved in the project were
given the explanation on the study purpose and the
daily tasks, and were asked to sign an agreement
prior to the data collection.
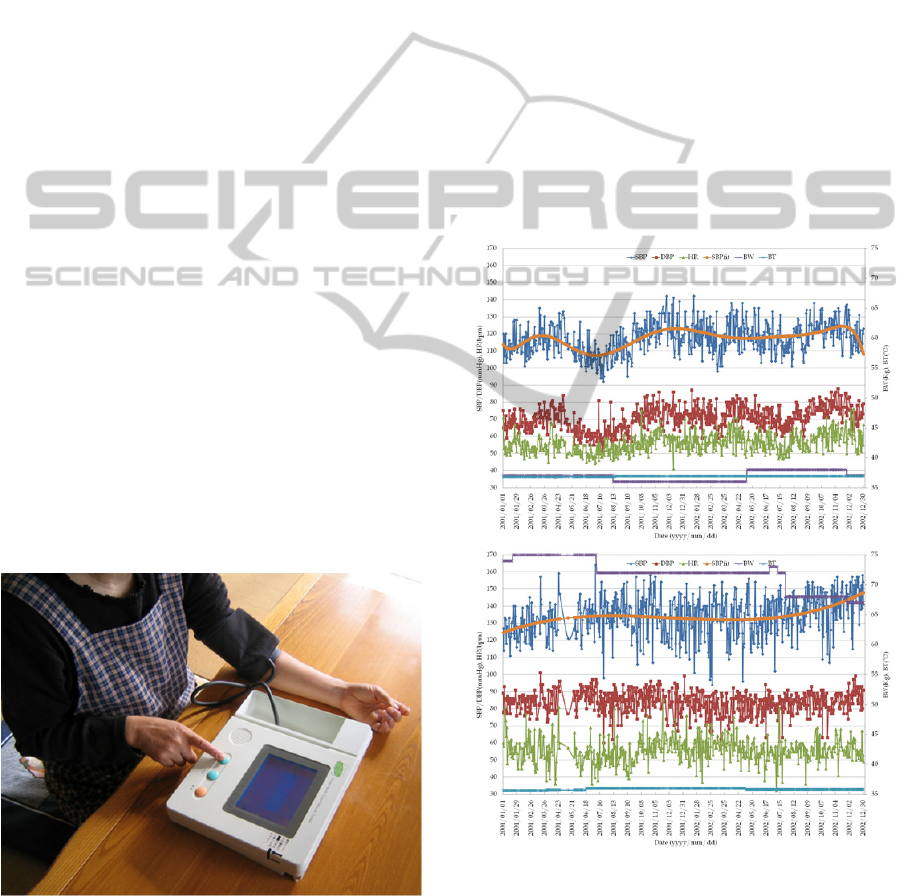
Figure 1: Snapshot in measurement of blood pressure
using the device at home. The measured data were
transmitted to a database server via a village network
connection.
Figure 1 shows a housewife measuring the blood
pressure at home by the device. Three large buttons
“Yes”, “No”, “Return” and a speaker for voice
guidance are designed especially for elders to
manipulate more easily.
Figure 2 shows daily measurements of SBP,
DBP, HR, BT and BW in two years from an elder
couple; upper and lower plots indicate the wife and
husband, respectively. The wife was born in 1925
and suffered from hypertension and had accepted
coronary artery bypass grafting surgery. The
husband was born in 1924 and had no overt
symptoms.
It is observable that the physiological data in the
wife demonstrates the wax and wane corresponding
to the temporal ebb and flow. SBP, DBP and HR
tend to decline in the summer and rise in the winter.
However, the biorhythmicity in the husband shows
an obscure pattern. The polynomial fitted curves
(brown lines) for the SBP show that individual
Figure 2: Profiles of daily HR, SBP, DBP, BT and BW in
two years collected from a couple ([upper] wife and
[lower] husband). Sporadic blanks indicate no
measurement on those days. The brown lines are the
polynomial approximation of SBP (9th order for the wife
and 3rd order for the husband). Most data were measured
in the afternoon of a day.
HEALTHINF2015-InternationalConferenceonHealthInformatics
70

biorhythmicity differs in period and MESOR,
amplitude and phase, zenith and nadir. Therefore,
proper analysis and visualization of these data are
indispensable in connecting daily physiological data
to biorhythmicity and health condition.
2.2 Pre-processing of SBP
This paper uses only the daily SBP data from the
above measurement in data analysis. Raw SBP data
are often contaminated by spike-like noise and other
artefacts due to poor contact and motion. The former
is suppressed by a median filter and the latter is
mitigated by a Savitzky–Golay filter.
2.2.1 Suppression of Spike-like Noise
Occasional spike-like SBP data are considered
outliers and suppressed in the first step.
A median filter is a nonlinear digital filtering
technique, usually used in the image processing field
to remove speckle noise, or salt/pepper noise from
images. The idea is to represent the signal by
replacing an extremely large value with a reasonable
candidate value. This is realized using a window
consisting of an odd number of data. The values
within the window are sorted in numerical order, and
the median value, the sample in the centre of the
window, is selected as the output of the filter.
When the window is moved along the signal, the
output of the median filter y(i) at a moment i is
calculated as the median value of the input values
x(i) corresponding to the moments adjacent to i
ranging from –L/2 to L/2.
2/,12/
,...,,...,12/,2/
LixLix
ixLixLix
medianiy
,
(1)
where L is the length of the window.
2.2.2 Smoothing of Monthly SBP Profile
The Savitzky–Golay filter is used to smooth the data
outputted from the median filter. The Savitzky–
Golay filter segments the data as frames using a
moving window, and approximates the data frames
one by one using a high-order polynomial, typically
quadratic or quartic (Savitzky & Golay, 1964).
For each input point y(i), a digital filter output
z(i) can be expressed by a linear combination of the
nearby input points as
R
L
n
nk
k
kiyciz
,
(2)
where n
L
is the number of points on the left-hand
side of the data point i, and n
R
is the number of
points on the right-hand side of i.
The Savitzky–Golay filter is to find a proper
polynomial to fit all n
L
+n
R
+1 points within each
window frame on the least-squares meaning, and to
produce a filter output z(i) as the value of that
polynomial at position i.
To derive filter coefficients, c
k
, we consider
fitting a polynomial of degree M in i, namely
a
0
+a
1
i+a
2
i
2
+•••+a
M
i
M
to the values y
−nL
,...,y
nR
. Then,
z(0) will be the value of that polynomial at i = 0,
namely a
0
. The design matrix for this problem is
,
j
ij
iA
Mjnni
RL
,...,0,,...,0,...,
,
(3)
The normal equations for the polynomial
coefficients vector, a=[a
0
, a
1
, a
2
,•••, a
M
]’, in terms of
the input data vector, y=[y
−nL
,...,y
nR
]’, can be written
in a matrix notation as below:
yaA
,
(4)
The polynomial coefficients vector, a, becomes
yAAAa
TT
1
,
(5)
We also have the specific forms
R
L
R
L
n
nk
ji
n
nk
kjki
ij
T
kAAAA
,
(6)
and
R
L
R
L
n
nk
k
j
n
nk
kkj
j
T
ykyAyA
,
(7)
Since the filter coefficient, c
k
, is the component
a
0
when y is replaced by the unit vector e
k
, we have
M
m
m
m
T
k
TT
k
k
c
0
0
1
0
1
AA
eAAA
,
(8)
where –n
L
≤ k < n
R
.
When the filter coefficient vector c=[c
-nL
,…,c
nR
]
is obtained using Equation (8), the data can be
smoothed using Equation (2).
2.3 Detection of Biorhythmic Change
Biorhythmic change is detected by the dynamic time
warping (DTW) algorithm (Salvador and Chan,
2007). DTW is an algorithm used to measure the
TrackingofMonthlyHealthConditionChangefromDailyMeasurementofSystolicBloodPressure
71

similarity between two data sequences that may
generally vary in temporal span and rhythmic tempo.
2.3.1 DTW Algorithm
The aim of DTW is to find the optimal alignment
between two given data sequences under given
criteria. The length of two sequences may differs
and varies. The reference sequence R={r
1
,...,r
M
}
with length M, and the test sequence T={t
1
,...,t
N
}
with length N, are shown in Figure 3. The value of
each black dot d
ij
indicates the difference (distance)
between the reference sequence r
i
and the test
sequence t
j
, as described by Equation (9).
22
iiij
trjid
, i=1, 2,…, M;
j=1, 2,…, N,
(9)
Figure 3: Dynamic time warping algorithm showing the
optimal path (red line) between the reference sequence and
the test sequence.
Thus, a two-dimensional NM distance matrix,
D
N×M
, is constructed where the element d
ij
is the
distance between the i
th
data in the reference
sequence and the j
th
data in the test sequence.
As a similarity measure, the shortest path from
the start (the lower left-hand corner of the distance
matrix) to the end (the upper right-hand corner of the
distance matrix) of the data sequence must exist
among multiple possible paths.
The shortest path is determined using the
forward dynamic programming approach with a
monotonicity constraint.
kijk
jk
ij
PdP
,1
min
,
(10)
where P
ij
denotes the distance from the i
th
and the
j
th
data node to the terminating node.
The overall minimum distance, D(T, R), used as
the similarity measure for two sequences (a smaller
distance value indicates a higher similarity) is
determined from
11
, PRTD
,
(11)
2.3.2 Personal Reference Profile
A personal reference profile is created by averaging
individual 24 monthly SBP profiles and used as the
reference sequence in DTW calculation. Because the
number of days in a month differs from month to
month, and data loss unavoidably happens in daily
measurement, the length of the reference profile is
normalized to 30 days by resampling the daily
measured raw data.
Two personal reference profiles for the wife and
the husband are shown in Figure 4.
Figure 4: Personal reference profiles derived by averaging
24 monthly profiles of individual SBP data.
2.3.3 Biorhythmic Change Index
The personal reference profile is used as a reference
sequence to calculate the overall distance D from
monthly SBP profile using the DTW algorithm as
shown in Equation (11). The D value is considered
as a similarity measure describing the discrepancy
between personal reference profile and monthly SBP
profile, and serves as a biorhythmic change index
(BCI) reflecting the monthly biorhythmic change.
The smaller the value of BCI is, the more regular in
biorhythmicity and the less change in health
condition.
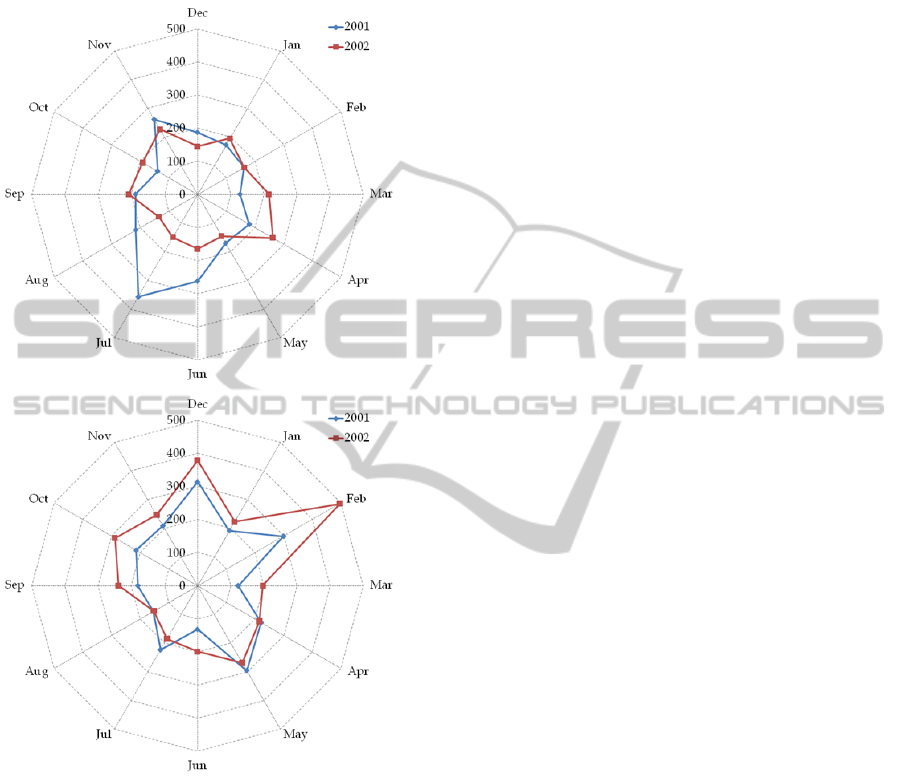
3 RESULTS
The monthly change of BCI, or the overall distance
between personal reference profile and individual
monthly SBP profile in two years is shown in Figure
5. The upper plot presents the outcome of the wife,
the lower plot is for the husband. The BCI value was
calculated by the DTW algorithm using the personal
i
j
Reference sequence
Test sequence
M1
1
N
100
110
120
130
140
150
1 6 11 16 21 26
SBP (mmHg)
Day in a month
Husband Wife
HEALTHINF2015-InternationalConferenceonHealthInformatics
72
reference profile as a reference sequence and the
monthly SBP profile as a test sequence. The smaller
the value of the BCI is, the higher the similarity has
between the personal reference and monthly profile.
Figure 5: Monthly change of the BIC, or the overall
distance between personal reference profile and monthly
SBP profile in the wife (upper plot) and the husband
(lower plot) in two years.
It is obvious that the monthly rhythmic change
can be found in both the wife and the husband.
Nevertheless, the exceptional change in the wife
happened in July, 2001 (blue trace in upper plot),
and husband in February, 2002 (red trace in lower
plot). The onset of the symptoms usually insinuates
certain alterations in physical or mental conditions.
This implies that remarkable change in the health
condition of the wife and the husband probably
occurred in the respective timing point.
The above analytical outcome were confirmed to
be accordant with the couple’s real situation by
referring to their personal medical records, both
were in poor health condition and were accepting
treatment in the corresponding period.
In comparison with the noteworthy biorhythmic
variations in July, 2001 of the wife and in February,
2002 of the husband, indistinctive change in other
corresponding months in two years exhibits a
monthly repetitive pattern of biorhythmicity in good
health condition.
4 DISCUSSION
Many chronic diseases, such as diabetes,
hypertension, arteriosclerosis, malignant neoplasm,
cerebral and cardiovascular conditions, are silent
killers that require a long-term course in disease
development and threaten human beings in a latent
way. Occasional or regular yearly health check-up
are difficult to identify the onset of the symptoms
and incidence of diseases at their early stage.
Various home-based devices provide convenient
approaches for daily measurement of variety of
physiological data in daily life environment.
Nevertheless, a huge volume of data accumulated
over a long-term period usually contain abundant
functional information but require proper approach
in order to assess the significant signature in
different physiological and pathological conditions.
As is well known, physical and mental
conditions are affected by various endogenous and
exogenous factors. They may include emotional,
psychological, behavioural aspects, and as well the
meteorological, environmental, geographical, and
temporal factors. Therefore, it is difficult to identify
the underlying regulatory mechanism which is
responsible for various benign and malignant
stimulants.
Instead of scrutinizing every detail of daily
measurement of SBP, we applied an efficient DTW
algorithm for tracking of biorhythmic alteration to
reflect the health condition change. The results also
suggest that it is possible to track not only
physiological condition change in monthly base but
also various specific events in daily base such as
heavy intake of alcohol, mental depression, and
other unusual incidents in daily life, provided the
vast amount of physiological data is accumulated
through daily measurement over a long-term period,
and proper algorithm is applied to scoop out the
valuable information.
Personal reference profile is currently obtained
by simply averaging all of the monthly data. It is
TrackingofMonthlyHealthConditionChangefromDailyMeasurementofSystolicBloodPressure
73

apparent that the aging process affects the averaged
personal reference profile, and evolution of the
personal reference profile is desirable to adapt on
monthly base gradually to reflect intrinsic
biorhythmic change with aging process in the future
study.
Although this paper presents only the outcome
obtained from two elders in two years, it is
promising to recognize the feasibility for tracking of
monthly change in health condition by daily
measurement of physiological data. More data from
more persons in different age groups, longer period
of measurement, and diversity of physiological and
pathological conditions are preferable in further
validation of the proposed method. More sensitive
and more robust algorithms are also worth to be
explored in depth on different temporal bases such
as daily, weekly, monthly, seasonal and yearly.
5 CONCLUSIONS
In this paper, we applied the DTW algorithm to
analyse the monthly rhythmicity using daily
measurement of SBP from an elder couple in two
years. Minor variation in monthly biorhythmicity
indicates the physiological adaptation to internal and
external factors temporally. The remarkable
deviation out of usual physiological adaptation
reflects the health condition alteration accordingly. It
suggests that the recognisable unusual change
provides an evidence to help making decision in
daily health management and an insight into chronic
disease control, and perception to deal with daily
health problem more smartly.
The results also suggest that even it is difficult to
identify any significant variation from the daily or
the monthly SBP profile directly, proper analysis of
the raw SBP measured over a long-term period is
able to help tracking functional information of health
condition change and serving as an effective
evidence for health management.
ACKNOWLEDGEMENTS
The authors would like to thank the volunteers for
their endurance in daily measurement of
physiological data over a long-term period. This
study is supported in part by the collaborative Grant
of Samsung Institute of Japan, No. A-26-1 and the
University of Aizu Competitive Research Funding,
No. P-27.
REFERENCES
IBM Corp., 2011. IBM big data and information
management http://www-01.ibm.com/software/data/
bigdata/ Accessed Aug. 22, 2014.
Zins, C., 2007. Conceptual Approaches for Defining Data,
Information, and Knowledge. Journal of the American
Society for Information Science and Technology;
58(4):479–493.
Ginsberg, J., Mohebbi, M., Patel, R., Brammer, L.,
Smolinski, M., Brilliant, L., 2008. Detecting influenza
epidemics using search engine query data. Nature;
457:1012-1014.
West Aizu, 2003. Challenge to 100 Years of Age – The
Making of a Healthy Village through a Total Care
Solution, Fukushima: Zaikai21 Publishing House.
Savitzky, A. & Golay, M. J. E. 1964. Smoothing and
Differentiation of Data by Simplified Least Squares
Procedures. Analytical Chemistry; 36(8):1627-1639.
Salvador, S., Chan, P., 2007. Toward Accurate Dynamic
Time Warping in Linear Time and Space. Intelligent
Data Analysis; 11(5):561–580.
HEALTHINF2015-InternationalConferenceonHealthInformatics
74
