
Metric Learning in Dimensionality Reduction
Alexander Schulz and Barbara Hammer
CITEC Centre of Excellence, Bielefeld University, Bielefeld, Germany
Keywords:
Dimensionality Reduction, Metric Learning, Interpretability, Data Visualisation.
Abstract:
The emerging big dimensionality in digital domains causes the need of powerful non-linear dimensionality
reduction techniques for a rapid and intuitive visual data access. While a couple of powerful non-linear
dimensionality reduction tools have been proposed in the last years, their applicability is limited in practice:
since a non-linear projection is no longer characterised by semantically meaningful data dimensions, the visual
display provides only very limited interpretability which goes beyond mere neighbourhood relationships and,
hence, interactive data analysis and further expert insight are hindered. In this contribution, we propose to
enhance non-linear dimensionality reduction techniques by a metric learning framework. This allows us to
quantify the relevance of single data dimensions and their correlation with respect to the given visual display;
on the one side, this explains its most relevant factors; on the other side, it opens the way towards an interactive
data analysis by changing the data representation based on the learned metric from the visual display.
1 INTRODUCTION
Digitally available data sets are ever getting bigger
as concerns its size, complexity, and dimensionality.
Big data has been proclaimed as one of today’s major
challenges in the digital society (Khalil, 2012; Com-
mittee on the Analysis of Massive Data et al., 2013),
and computational intelligence and machine learn-
ing techniques offer a fundamental approach how to
tackle a few of the involved problems (Zhai et al.,
2014; Jin and Hammer, 2014; Hammer et al., 2014).
In almost all settings, however, data analysis is not
fully automated, but the human has to decide on the
suitability of the used techniques, often in an inter-
active way. Hence it is vital to establish an intuitive
access to digital data and the possible outcomes of al-
gorithmic steps for the practitioner. Since decades,
visual data inspection offers one premier interface in
this setting, since it relies on one of human’s most
powerful senses and his astonishing cognitive capa-
bilities of instantaneous visual grouping and feature
detection (Simoff et al., 2008; Ward et al., 2010).
In this contribution, we deal with a popular set-
ting, the availability of a large number of vectorial
data points which characterise some entities (such as
measurement vectors, customer characteristics, pa-
tients, etc.). Scatter plots offer one of the most promi-
nent technique to visually inspect such data: here,
data are displayed such that their neighbourhood re-
lationship can directly be observed, and phenomena
such as clusters, complex grouping, or outliers can
easily be observed. Scatter plots are directly avail-
able for two or three dimensional data; for higher di-
mensionality, scatter matrices or tour methods have
been proposed (Simoff et al., 2008). However, their
applicability is limited for higher data dimensional-
ity, since not all information available in the different
dimensions and their correlation can easily be inte-
grated based on these simple methods.
In this context, dimensionality reduction plays a
major role, referring to the task to map high dimen-
sional vectors to low dimensional counterparts such
that as much information as possible is preserved.
One very common classical dimensionality reduction
method is offered by principal component analysis
(PCA), which constitutes the by far most popular
data visualisation technique in diverse application do-
mains (Biehl et al., 2011). However, being a linear
technique, it is severely restricted as concerns its ca-
pability to capture non-linear structures and cluster-
ing effects. In recent years, a huge variety of non-
linear dimensionality reduction techniques has been
proposed, see e.g. the overviews (Bunte et al., 2012a;
Lee and Verleysen, 2007; van der Maaten and Hin-
ton, 2008; Venna et al., 2010; Gisbrecht and Ham-
mer, 2014). Many techniques can be accompanied by
guarantees that they are capable of extracting the true,
possibly non-linear underlyingdata manifold (Roweis
and Saul, 2000; Tenenbaum et al., 2000; Gisbrecht
and Hammer, 2014); however, these techniques are
232
Schulz A. and Hammer B..
Metric Learning in Dimensionality Reduction.
DOI: 10.5220/0005200802320239
In Proceedings of the International Conference on Pattern Recognition Applications and Methods (ICPRAM-2015), pages 232-239
ISBN: 978-989-758-076-5
Copyright
c
2015 SCITEPRESS (Science and Technology Publications, Lda.)

not well suited to visualise data provided the under-
lying manifold structure cannot be preserved in only
two dimensions due to a higher intrinsic data dimen-
sionality (van der Maaten et al., 2009). A few pow-
erful alternatives rely on the notion of neighbourhood
structures, with the neighbourhoodretrieval visualiser
(NeRV), for example, explicitly realising an infor-
mation retrieval perspective, and allowing a suitable
compromise of the amount of information which is
preserved in the visualization (van der Maaten and
Hinton, 2008; Venna et al., 2010). These techniques
provide excellent results in application scenarios, and
they mirror what is currently accepted as state of the
art as a suitable cost function of non-parametric di-
mensionality reduction techniques (Lee and Verley-
sen, 2010; Venna et al., 2010). In this contribution, we
will mostly be concerned with NeRV as theoretically
well-founded method and one of the most powerful
non-linear data visualisation techniques available to-
day. Quite a few extensions of NeRV, or the very
similar, earlier technique t-SNE proposed in (van der
Maaten and Hinton, 2008) exist to cope with the prob-
lems of efficient implementation, integration of prior
knowledge, an extension of the non-parametric tech-
nique to an explicit mapping prescription, or exten-
sions to alternative cost measures (Yang et al., 2013;
Gisbrecht et al., 2014; Hammer et al., 2013; Lee et al.,
2013).
One severe problem of techniques such as t-SNE
and NeRV lies in the fact that they are non-parametric
non-linear techniques for which the obtained visual
data display, unlike linear counterparts such as PCA,
cannot easily be linked to semantically meaningful
information: the two-dimensional projection coordi-
nates have no direct meaning and they are not linked
to feature dimensions of the data, unlike linear pro-
jections such as PCA, where the projection axes can
be linked to the original data dimensions. For non-
parametric projections the relative location of data
points is the only relevant information preserved in
the mapping. As a consequence, it is not easy to judge
which data dimensions are particularly important for
the visual display, and which correlations of the data
dimensions contribute to the mapping. Since data vi-
sualisation is an unsupervisedand inherently ill-posed
task, this fact leads to a severe risk of interpreting the
visual display in a wrong way, if its interpretation is
possible at all (Vellido et al., 2012; R¨uping, 2006).
Further, an interactive manipulation of the data by
means of the visual display is not easily possible.
Recently, a few approaches have been proposed
which try to overcome this gap and which accompany
visualisation techniques with methods to more easily
interpret the display and manipulate the data repre-
sentation based thereon (Brown et al., 2012; Endert
et al., 2012; Peltonen et al., 2013). These techniques
propose to change the data metrics based on a given
visual display, whereby different techniques are in-
volved, ranging from heuristic model updates up to
Bayesian learning of the data metric. In this contribu-
tion, we will follow these first steps which change the
metric of the data based on a given visual display; by
incorporating recent insights from the fields of met-
ric learning in supervised machine learning, we will
arrive at a very simple and intuitive metric adaptation
scheme which offers insight into the visual display as
well as ways to manipulate the data representation ac-
cordingly.
Metric learning constitutes a very powerful
scheme well-known in machine learning, and a va-
riety of techniques has been proposed in the context
of supervised learning, see e.g. (Bellet et al., 2013;
Bunte et al., 2012b; Goldberger et al., 2004; Mokbel
et al., 2014). Mostly, a global or local Mahalanobis
distance is adapted in these settings such that the
underlying goal (usually classification) is improved
as much as possible. Besides an improved model
accuracy, these techniques provide auxiliary insight
into the task by providing a relevance weighting of
the data dimensions indicating the contribution of the
data dimensions to the task at hand, and, by means
of the linear transformation underlying the quadratic
form, a new data representation which can even di-
rectly be used to inspect the data in some cases.
Here, we will transfer a particularly elegant metric
learning scheme to the field of unsupervised dimen-
sionality reduction (Biehl et al., 2009). This scheme
will allow us to learn a global quadratic form which
mirrors the neighbourhood relationships as provided
by the visual display. The metric allows a direct
interpretation of the relevance of the feature dimen-
sions for the given mapping; further, since it can be
linked to a linear data transformation, it enables a
change of the data representation based on the visual
display, hence it allows us to impose external infor-
mation on the data in a very simple form. We will
demonstrate this latter principle by referring to dis-
criminative dimensionality reduction settings. First
steps along this line have been presented in the recent
publication (Schulz et al., 2014). Unlike this work,
we will deal with a general quadratic form instead of
a simple diagonal scaling only. Further, we focus on a
parametric metric adaptation based on a differentiable
cost function rather than referring to feature selection
techniques based on suitable evaluation schemes for
dimensionality reduction. This focus has the advan-
tage that the relevance and correlations of the given
feature dimensions can be judged simultaneously, and
MetricLearninginDimensionalityReduction
233

that the resulting transformation provides an alterna-
tive, linear data transformation which approximates
the observed display.
Now we will explain the neighbourhood retrieval
visualiser and its relation to a quantitative evalua-
tion of dimensionality reduction techniques. After-
wards, we introduce a simple and powerful metric
learning scheme based on NeRV, which enables the
efficient learning of relevance matrices by a superpo-
sition of a cost optimisation and suitable regularisa-
tion. Thereby, the scheme can be used independently
of the technique which is underlying the visual dis-
play. We demonstrate the suitability and efficiency of
the approach in three benchmarks: an artificial sce-
nario with known ground truth, and two real life med-
ical data set, where we investigate the suitability of
the induced transformation of the given data.
2 NEIGHBORHOOD RETRIEVAL
OPTIMIZER
Given a data set X = [x
1
,...,x
N
], non-parametric di-
mensionality reduction maps data points x
i
∈ R
n
to
projections y
i
∈ R
2
with Y = [y
1
,...,y
N
] such that
as much structure as possible is preserved. Tech-
niques differ in the way how this is formalised, see
e.g. (Bunte et al., 2012a) for a unifying presentation
of popular dimensionality reduction schemes. Lin-
ear methods such as PCA offer an explicit mapping
y
i
= w
t
x
i
while many non-linear dimensionality re-
duction schemes are non-parametric. We will exem-
plarily consider NeRV (Venna et al., 2010) which, as
an objective, can be linked to neighbourhood preser-
vation in an information theoretic sense.
Assume d refers to the distance in the data space
X. We define
p
j|i
=
exp(−d(x
i
,x
j
)
2
/(σ
x
i
)
2
)
∑
k6=i
exp(−d(x
i
,x
k
)
2
/(σ
x
i
)
2
)
(1)
as the probability of two points being neighbour in the
data space, and
q
j|i
=
exp(−ky
i
− y
j
k
2
/(σ
y
i
)
2
)
∑
k6=i
exp(−ky
i
− y
k
k
2
/(σ
y
i
)
2
)
(2)
as the probability of two projections being neighbour
in the projection space. Thereby, the standard devi-
ation σ
x
i
in the data space is chosen such that a fixed
effective numberof neighbours k (with default k = 10)
is reached and then the standard deviation σ
y
i
is set to
the same value. NeRV optimises the costs
Q
NeRV
k
(X,Y) =
γ
∑
i
∑
j6=i
p
j|i
log
p
j|i
q
j|i
+ (1− γ)
∑
i
∑
j6=i
q
j|i
log
q
j|i
p
j|i
(3)
corresponding to the deviation of the two probability
distributions. γ ∈ [0,1] weights the relevance of ob-
taining a good recall, corresponding to the first sum-
mand, and a good precision, corresponding to the sec-
ond summand; per default, a compromise γ = 0.5 is
chosen. Optimisation is commonly done by a stochas-
tic or conjugate gradient descent. There exist very
similar alternative methods such as t-NeRV, which
uses the student-t distribution instead of Gaussians for
the low dimensional embedding, to better prevent the
so-called crowding problem, or (t-)SNE, which op-
timises only one summand of these costs (van der
Maaten et al., 2009).
Interestingly, the NeRV costs can be interpreted
as a smoothed version of the crisp costs which eval-
uate the degree of neighbourhood preservation for a
given DR display, as formalised in the frame of the
co-ranking framework as proposed in (Lee and Ver-
leysen, 2009), see also (Venna et al., 2010). Assume
a fixed neighbourhood range k, the average overlap
of neighbourhoods of size k in the projection space
and the original data space are counted, leading to the
quality
Q
k
(X,Y) =
N
∑
i=1
N
k
(x
i
) ∩N
k
(y
i
)
/(Nk) (4)
where N
k
(x
i
) (resp. N
k
(y
i
)) are the indices of the k
closest points of x
i
in the data space (resp. projection
space). Interestingly, the quality summarises various
popular alternative evaluation measures (Lee and Ver-
leysen, 2009). The neighbourhood degree k is crisp,
while the NeRV costs consider a smooth version in-
duced by the Gaussian, but still emphasising a certain
neighbourhood range by means of a fixed choice of
the bandwidth.
Any reasonable dissimilarity measure d can be
used within this framework. As an example, in dis-
criminative dimensionality reduction, instead of the
standard euclidean metric, the so-called Fisher met-
ric is considered, which only takes into account data
changes as they affect a given labelling scheme, see
e.g. (Gisbrecht et al., 2014). This combination is re-
ferred to as Fisher-t-SNE.
Since NeRV is a non-parametric approach, we ob-
tain projection co-ordinates of the given data only.
The axes of the projection are widely arbitrary, and
no semantic meaning is attached to the visual display.
By incorporating metric learning, we aim at comple-
menting the visual display by a link to the original
data dimensions, such that the display can be accom-
panied by a semantic meaning in terms of the original
(usually interpretable) data dimensions.
ICPRAM2015-InternationalConferenceonPatternRecognitionApplicationsandMethods
234
−2
−1
0
1
2
−1
0
1
2
−1
−0.5
0
0.5
1
Dim 1
Dim 2
Dim 3
C 1
C 2
C 3
−2 −1 0 1 2 3
−3
−2
−1
0
1
2
3
Dim 1
Dim 2
C 1
C 2
C 3
−1.5 −1 −0.5 0 0.5 1 1.5 2
−2
−1.5
−1
−0.5
0
0.5
1
1.5
Dim 1
Dim 2
C 1
C 2
C 3
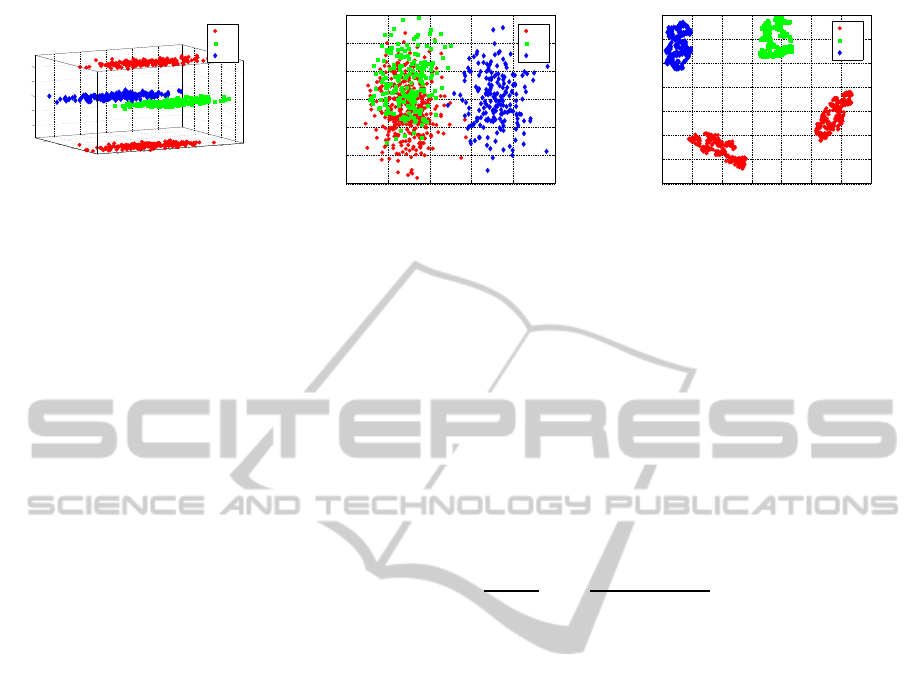
Figure 1: Artificial multimodal data (left), projection by LDA (middle), projection by Fisher t-SNE (right).
3 METRIC LEARNING
Assume a fixed data projection X 7→ Y is given. For
metric learning, the idea is to change the metric of the
data representation in X such that the chosen metric
best resembles the information which is inherent in
this given non-parametric mapping.
We consider a global quadratic form for X
d
Λ
(x
i
,x
j
)
2
= (x
i
− x
j
)
t
Λ(x
i
− x
j
) (5)
with a positive semidefinite matrix
Λ = Ω
t
Ω (6)
The goal is to learn Λ (or equivalently Ω) such that it
best resembles the given visual display. Provided this
metric change captures the relevant information of the
visual display, it enables two things:
• It is possible to judge the relevance of the data
dimensions for the given display by inspecting the
relevance terms
Λ
ii
=
∑
j
Ω
2
ji
(7)
and hence gives a semantic interpretation of the
display by linking it to the most relevant data di-
mensions (the ones with largest Λ
ii
).
• It is possible to transform the data
X 7→ ΩX (8)
to obtain data representations which more closely
resemble the projections of the data in two dimen-
sions; this opens the possibility to imprint infor-
mation on the data based on the visual interface.
How can we obtain a suitable matrix Λ? Mimicking
the successful approach of relevance learning which
has been established in supervised machine learning
(Biehl et al., 2009), we optimise Λ such that the ob-
jective as imposed by NeRV is optimised by an ad-
justment of Λ, together with a suitable regularisation:
E(Ω) = Q
NeRV
k
(ΩX,Y) + δ· trace(Λ) (9)
where δ > 0 constitutes a small positive value which
enforces solutions with a small norm for regularisa-
tion. Since the projection points y
i
are fixed, we set σ
in both spaces such that the fixed neighbourhood size
k is reached. While optimisation with a gradient tech-
nique is possible, we use an adaptive step size similar
to well-known algorithms from neural network opti-
misation (Riedmiller and Braun, 1993). Note that the
derivatives of the costs E(Ω) can be computed based
on the derivative of NeRV itself (Venna et al., 2010)
using the following equality and symmetry of NeRV
with respect to data points and projections
∂E(Ω)
∂Ω
ij
=
∑
l
Q
NeRV
k
(ΩX,Y)
∂(Ωx
l
)
i
· (x
l
)
j
+ 2· δ · Ω
ij
(10)
The transformation matrix Ω is not unique since
the costs are invariant with respect to orthonormal
transformations of the matrix. This does not affect
its trace (and hence the relevance terms which will be
interpreted), however. Further, the result is not neces-
sarily unique due to possible local optima of the costs
which are inherent in NeRV; in practice, we did not
observe problems.
4 EXPERIMENTS
We investigate the possibility to substantiate a given
visual display of data by metric learning, leading to
relevance factors which allow a meaningful insight
into the relevance of the data dimensionalities for the
display, and leading to a more suitable representation
of the data which imprints the informationas provided
by the visual display. While we can evaluate the for-
mer with a reference to the gained semantic insight,
we evaluate the latter by the coranking framework
which compares the neighbourhood structure induced
by the data representation and the visual display, re-
spectively (Lee et al., 2013). We consider the follow-
ing three data sets:
Multimodal: data refers to an artificially generated
data set with known ground truth. Data are three
MetricLearninginDimensionalityReduction
235
dimensional, belonging to 3 classes, whereby one
class is multimodal, see Fig. 1 (left). Dimension 1
is irrelevant for the cluster formation, dimension
2 discriminates the classes, dimension 3 discrimi-
nates the two modes in class 1.
Diabetes: data refers to a data set describing 442 pa-
tients by 10 features (age, sex, BMI, blood pres-
sure, 6 measurements taken from blood serum)
with a labelling according to diabetes progression
after one year. The data set has been used in
(Efron et al., 2004), where a modern feature se-
lection technique has marked three of the criteria
as particularly relevant for the prediction task.
Adrenal: data refers to a data set of 147 pa-
tients characterised by 32 features (various steroid
markers), where labelling is given by two different
types of adrenal cancer, see (Biehl et al., 2012).
Artificial Multimodal Data
We project the given data to two dimensions in two
different ways: on the one hand, a linear discriminant
analysis (LDA) is used, which projects the data lin-
early to the plane, preserving classes as indicated by
the labels as much as possible. Since it relies on a uni-
modal Gaussian for every class, LDA is not capable
of preserving the multi modality of class one, result-
ing in an overlap of classes one and two. In com-
0 100 200 300 400 500 600 700 800
0
0.5
1
1.5
2
2.5
Neighborhood size
λ
NeRV
Dim 1
Dim 2
Dim 3
0 100 200 300 400 500 600 700 800
0
0.5
1
1.5
2
2.5
3
3.5
Neighborhood size
λ
NeRV
Dim 1
Dim 2
Dim 3
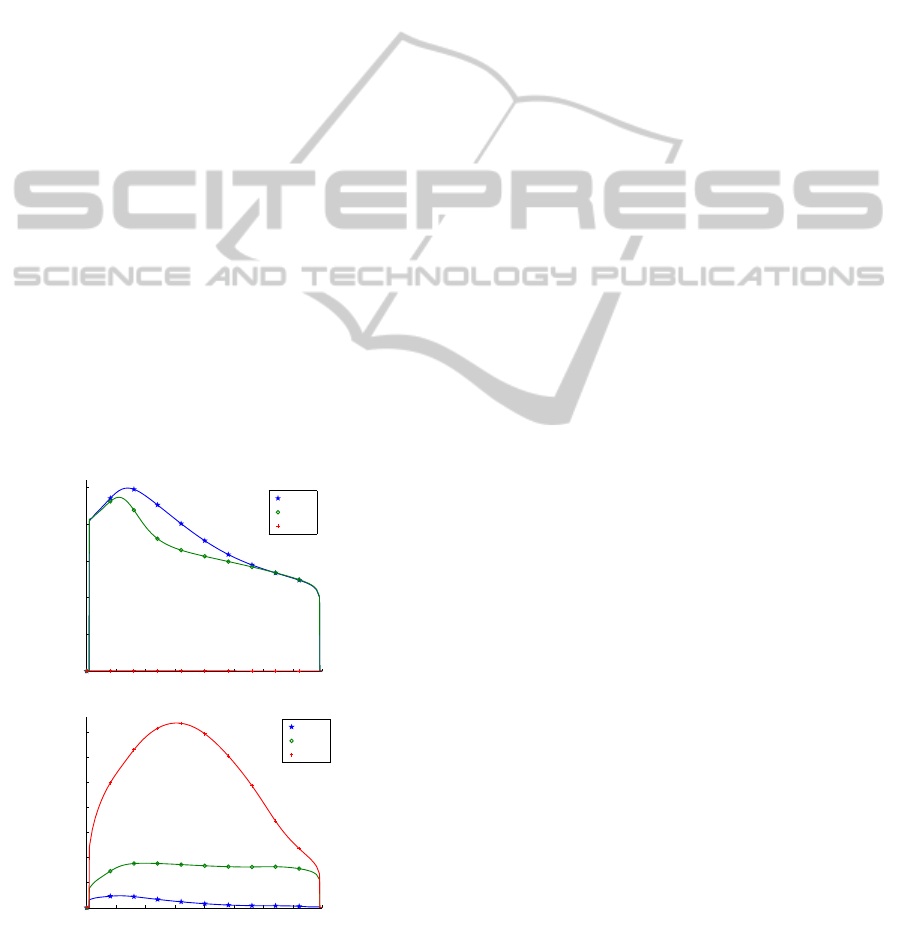
Figure 2: Relevances Ω
ii
obtained by the proposed method
for the LDA projection in dependency of the choice k of the
cost function E(Ω) (left), for the projection by Fisher t-SNE
(right).
parison, we use the non-linear projection technique
t-SNE which is applied to the data as characterised
by the Fisher information metric to take the label in-
formation into account (see (Gisbrecht et al., 2014)).
The Fisher information metric curves the space lo-
cally such that the information most relevant to the
given labelling is emphasised. On top of this curva-
ture, t-SNE emphasises the cluster structure and finds
a corresponding two dimensional projection, display-
ing all four modes present in the data set (see Fig. 1).
We learn a global quadratic form using the tech-
nique as described above, whereby we report the ob-
tained result for different degrees of neighbourhood
k for the costs E(k). The relevance terms Λ
ii
for
i ∈ {1,2,3} and the two different projections are de-
picted in Fig. 2. The relevance terms clearly con-
firm the expectations if one interprets these two pro-
jections: LDA ignores the separation induced by the
third dimension, treating the remaining two dimen-
sions as equally important; this results in the failure
to separate classes one and two. Fisher-t-SNE, in
contrast, neglects the first dimension, which does not
contain structure, but emphasises the other two, such
that all data modes are preserved. The relevanceterms
mirror this interpretation for all but extremal choices
of the neighbourhood degree k.
This example also elucidates the fact that matrix
learning for a given visual display is different from
feature selection: rather than emphasising factors rel-
evant for a given labelling, the proposed framework
identifies factors which best explain the given visual
display. These factors can coincide with the factors
identified by feature selection provided the visual dis-
play emphasises the given class labelling, but in gen-
eral, this is not the case.
Diabetes Data
We project the given data using t-SNE to two dimen-
sions. One can observe a correlation of the output
and one projection axes, which is overlaid by a two
cluster structure orthogonal to the output label (see
Fig. 3 (left)). The t-SNE projection displays a reason-
able quality as evaluated by the co-ranking framework
(see Fig. 3 (middle/right)). In comparison, we trans-
form the data according to the learned quadratic form
for a neighbourhood 10 and 50, respectively. As can
be seen via the coranking framework, the transformed
data, albeit relying on a linear transform only, much
better resembles the information shown in the visual
display. This confirms the possibility of imprinting
information from the visual display to the given data
representation for this medical data set.
ICPRAM2015-InternationalConferenceonPatternRecognitionApplicationsandMethods
236
−4 −2 0 2 4
−2
−1
0
1
2
Dim 1
Dim 2
10 20 30 40 50 60 70 80 90 100
0
0.1
0.2
0.3
0.4
0.5
0.6
0.7
0.8
0.9
1
Neighborhood size
Quality
X
X ⋅ Ω
10 20 30 40 50 60 70 80 90 100
0
0.1
0.2
0.3
0.4
0.5
0.6
0.7
0.8
0.9
1
Neighborhood size
Quality
X
X ⋅ Ω
Figure 3: T-SNE projection of the diabetes data set (left), quality for the t-SNE mapping for the standard euclidean metric
versus the transformed data with relevance matrix for neighbourhood range 10 (middle) and 50 (right).
−4 −2 0 2 4
−2
−1
0
1
2
Dim 1
Dim 2
ACA
ACC
−3 −2 −1 0 1 2
−3
−2
−1
0
1
2
Dim 1
Dim 2
ACA
ACC
0 5 10 15 20 25 30 35
0
0.5
1
1.5
2
2.5
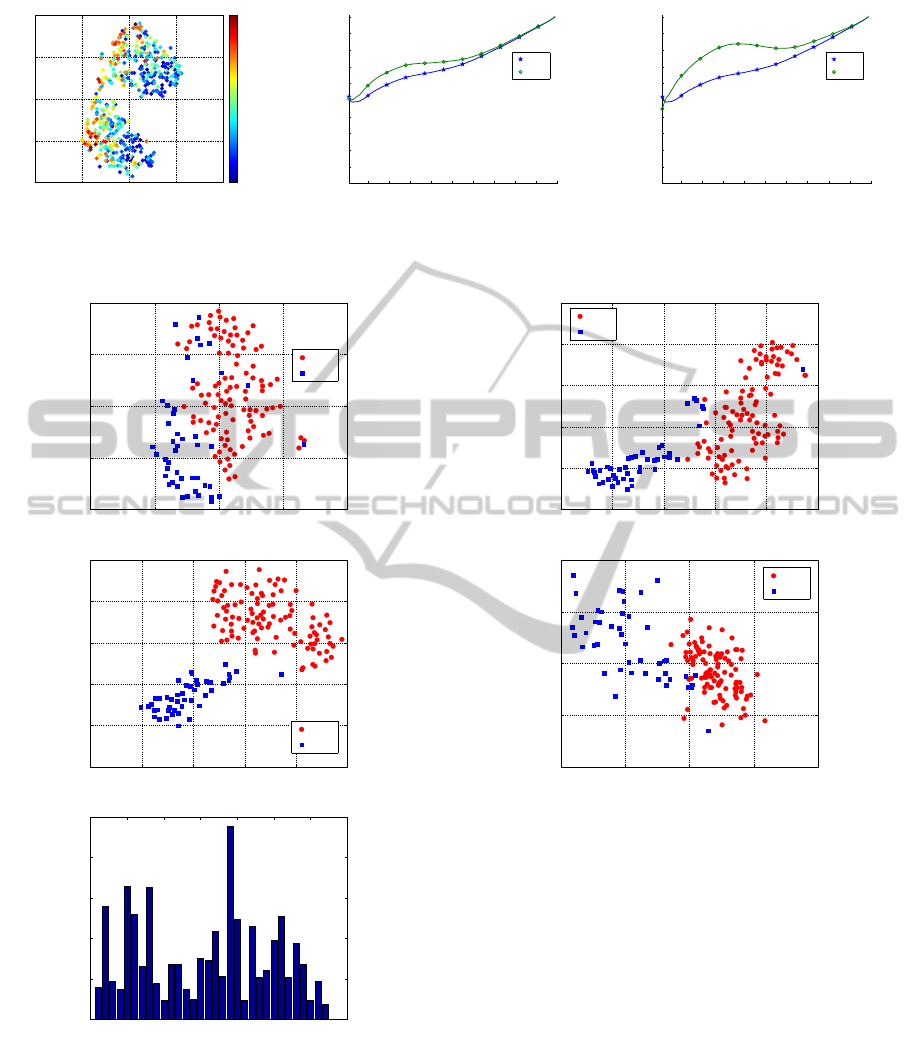
Figure 4: Projection of the adrenal data using t-SNE (top)
and Fisher t-SNE (middle). The latter can be used to learn
the relevant factors for this discriminative visual display
(bottom).
Adrenal Data
For the adrenal data, we consider a projection of the
original data by Fisher t-SNE, compared to a projec-
−15 −10 −5 0 5 10
−10
−5
0
5
10
15
Dim 1
Dim 2
ACA
ACC
−4 −2 0 2 4
−4
−2
0
2
4
Dim 1
Dim 2
ACA
ACC
Figure 5: Projection of the linearly transformed adrenal data
using t-SNE (top) Projection to the two main eigenvectors
of the learned linear transformation (bottom).
tion of the data by standard t-SNE (see Fig. 4). In-
terestingly, the 1-nearest neighbour classification er-
ror of the original data set is 10.9%, as also mir-
rored in the t-SNE projection which displays quite
some overlap of the data, while the error drops down
to only 0.7% for the Fisher t-SNE projection. We
can imprint the information available in this discrim-
inative projection to the data by means of relevance
learning, as before. We learn a quadratic form with
neighbourhood range k = 10 of the costs, resulting
in relevance factors which strongly resemble the find-
ings as described in the publication (Biehl et al.,
2012). This profile is very consistent for different
choices of neighbourhood range k (we tested values
k ∈ {10, 20,40} which lead to qualitatively the same
result). As before, we can imprint this information
MetricLearninginDimensionalityReduction
237

onto the original data by means of an according data
transformation. The t-SNE projection of the linearly
transformed data is depicted in Fig. 5, the 1-nearest
neighbour error reduces to 3.4% (as compared to trice
as much for the original data). Note that, unlike the
Fisher information metric, the data are subject to a
simple linear data transform only as regards its rep-
resentation, followed by the non-parametric t-SNE
mapping. Interestingly, the obtained linear data trans-
formation even suggests a linear data display with al-
most the same quality: Fig. 5 also displays the linear
projection to the first two eigenvalues of the learned
data transformation. The 1-nearest neighbour error is
2.7% only, enabling a very efficient representation of
the data which mirrors the underlying label informa-
tion. For both cases, one point is clearly indicated
as an outlier (possibly corresponding to a mislabeling
of the data point, as also discussed in the publication
(Biehl et al., 2012)). Due to its possibility to follow
strong nonlinearities caused by its non-parametric na-
ture, the Fisher information metric itself tends to over-
fit in this region, such that this outlier is much less
pronounced in the Fisher t-SNE mapping (Fig. 4).
Resumee
We have investigated three data sets as concerns the
possibility to link its visual display to explicit rele-
vance terms which link the displayed points to a se-
mantic meaning, and which open an interface towards
imposing this information to the data representation
by means of a linear transform. The tasks at hand be-
ing unsupervised, the evaluation of these possibilities
it not straightforward. In our experiments, we demon-
strated the claims in the following way:
• We evaluated the matrix learning framework for
an artificial data set with known relevances for the
given visual displays. The found relevances con-
firm the expectation in these settings.
• We evaluated the possibility to imprint the infor-
mation shown in the visual display to the data by
means of a linear data transformation by using the
co-ranking framework for data visualisation for
one real life data set.
• We evaluated the possibility to imprint the in-
formation as shown in the visual display by a
reference to the nearest neighbour error in the
case of an initial supervised dimensionality reduc-
tion. Here, the transformed data clearly allow to
achieve a better nearest neighbour error, i.e. a data
transformation as learned from the initial discrim-
inative visual display of the data enables us to ob-
tain an alternative data representation which bet-
ter resembles this important aspect. Thereby, due
to the linearity of the transformation, a semantic
interpretation of the axes is still possible.
So far, by restricting to a global quadratic form, the in-
duced data transformation is linear. Note that, similar
to proposals in supervised metric learning, a generali-
sation of the approach to locally quadratic forms (and
hence a globally non-linear data projection) would be
possible (Bellet et al., 2013).
5 CONCLUSIONS
We have introduced relevance learning into dimen-
sionality reduction as an efficient concept to accom-
pany a given visual display by the possibility to judge
the relevance of data dimensions for the given map-
ping. Besides a better interpretability of the mapping,
we have shown how this framework can be used as an
interface to change data representations by means of
visual displays, e.g. by incorporating label informa-
tion into the pipeline. This opens the way for future
work in particular in two aspects: on the one hand,
we are working on local matrix variants, which al-
low a richer representation of globally non-linear de-
pendencies, and its corresponding visual display. On
the other hand, we are investigating how the proposed
framework can efficiently be integrated into an inter-
active pipeline, where online adaptation of the display
according to a new metric is a central demand.
ACKNOWLEDGEMENTS
Funding by DFG under grant number HA 2719/7-1
and by the CITEC centre of excellence are gratefully
acknowledged.
REFERENCES
Bellet, A., Habrard, A., and Sebban, M. (2013). A survey
on metric learning for feature vectors and structured
data. CoRR, abs/1306.6709.
Biehl, M., Hammer, B., Mer´enyi, E., Sperduti, A., and
Villmann, T., editors (2011). Learning in the con-
text of very high dimensional data (Dagstuhl Seminar
11341), volume 1.
Biehl, M., Hammer, B., Schneider, P., and Villmann, T.
(2009). Metric learning for prototype based clas-
sification. In Bianchini, M., Maggini, M., and
Scarselli, F., editors, Innovations in Neural Informa-
tion – Paradigms and Applications, Studies in Com-
putational Intelligence 247, pages 183–199. Springer.
ICPRAM2015-InternationalConferenceonPatternRecognitionApplicationsandMethods
238

Biehl, M., Schneider, P., Smith, D., Stiekema, H., Tay-
lor, A., Hughes, B., Shackleton, C., Stewart, P., and
Arlt, W. (2012). Matrix relevance lvq in steroid
metabolomics based classification of adrenal tumors.
In ESANN.
Brown, E. T., Liu, J., Brodley, C. E., and Chang, R.
(2012). Dis-function: Learning distance functions in-
teractively. In Visual Analytics Science and Technol-
ogy (VAST), 2012 IEEE Conference on, pages 83–92.
IEEE.
Bunte, K., Biehl, M., and Hammer, B. (2012a). A general
framework for dimensionality reducing data visualiza-
tion mapping. Neural Computation, 24(3):771–804.
Bunte, K., Schneider, P., Hammer, B., Schleif, F.-M., Vill-
mann, T., and Biehl, M. (2012b). Limited rank matrix
learning, discriminative dimension reduction and vi-
sualization. Neural Networks, 26:159–173.
Committee on the Analysis of Massive Data, Committee on
Applied and Theoretical Statistics, Board on Mathe-
matical Sciences and Their Applications, Division on
Engineering and Physical Sciences, and National Re-
search Council (2013). Frontiers in Massive Data
Analysis. National Academic Press.
Efron, B., Hastie, T., Johnstone, I., and Tibshirani, R.
(2004). Least angle regression. Annals of Statistics,
32:407–499.
Endert, A., Fiaux, P., and North, C. (2012). Semantic inter-
action for visual text analytics. In Proceedings of the
SIGCHI Conference on Human Factors in Computing
Systems, pages 473–482. ACM.
Gisbrecht, A. and Hammer, B. (2014). Data visualization
by nonlinear dimensionality reduction. WIREs Data
Mining and Knowledge Discovery.
Gisbrecht, A., Schulz, A., and Hammer, B. (2014). Para-
metric nonlinear dimensionality reduction using ker-
nel t-sne. Neurocomputing.
Goldberger, J., Roweis, S., Hinton, G., and Salakhutdinov,
R. (2004). Neighbourhood components analysis. In
Advances in Neural Information Processing Systems
17, pages 513–520. MIT Press.
Hammer, B., Gisbrecht, A., and Schulz, A. (2013). Appli-
cations of discriminative dimensionality reduction. In
ICPRAM.
Hammer, B., He, H., and Martinetz, T. (2014). Learning and
modeling big data. In Verleysen, M., editor, ESANN,
pages 343–352.
Jin, Y. and Hammer, B. (2014). Computational intelligence
in big data [guest editorial]. IEEE Comp. Int. Mag.,
9(3):12–13.
Khalil, T. (2012). Big data is a big deal. White House.
Lee, J. and Verleysen, M. (2009). Quality assessment of
dimensionality reduction: Rank-based criteria quality
assessment of dimensionality reduction: Rank-based
criteria quality assessment of dimensionality reduc-
tion: Rank-based criteria quality assessment of di-
mensionality reduction: rank-based criteria. Neuro-
computing, 72(7-9):1431–1443.
Lee, J. A., Renard, E., Bernard, G., Dupont, P., and Verley-
sen, M. (2013). Type 1 and 2 mixtures of kullback-
leibler divergences as cost functions in dimensional-
ity reduction based on similarity preservation. Neuro-
computing, 112:92–108.
Lee, J. A. and Verleysen, M. (2007). Nonlinear dimension-
ality reduction. Springer.
Lee, J. A. and Verleysen, M. (2010). Scale-independent
quality criteria for dimensionality reduction. Pattern
Recognition Letters, 31:2248–2257.
Mokbel, B., Paassen, B., and Hammer, B. (2014). Adaptive
distance measures for sequential data. In Verleysen,
M., editor, ESANN, pages 265–270.
Peltonen, J., Sandholm, M., and Kaski, S. (2013). Infor-
mation retrieval perspective to interactive data visual-
ization. In Hlawitschka, M. and Weinkauf, T., editors,
Proceedings of Eurovis 2013, The Eurographics Con-
ference on Visualization. The Eurographics Associa-
tion.
Riedmiller, M. and Braun, H. (1993). A direct adap-
tive method for faster backpropagation learning: The
rprop algorithm. In Proceedings of the IEEE Inter-
national Conference on Neural Networks, pages 586–
591. IEEE Press.
Roweis, S. T. and Saul, L. K. (2000). Nonlinear dimen-
sionality reduction by locally linear embedding. SCI-
ENCE, 290:2323–2326.
R¨uping, S. (2006). Learning Interpretable Models. PhD
thesis, Dortmund University.
Schulz, A., Gisbrecht, A., and Hammer, B. (2014). Rele-
vance learning for dimensonality reduction. In Ver-
leysen, M., editor, ESANN, pages 165–170.
Simoff, S. J., B¨ohlen, M. H., and Mazeika, A., editors
(2008). Visual Data Mining - Theory, Techniques and
Tools for Visual Analytics, volume 4404 of Lecture
Notes in Computer Science. Springer.
Tenenbaum, J., da Silva, V., and Langford, J. (2000). A
global geometric framework for nonlinear dimension-
ality reduction. Science, 290:2319–2323.
van der Maaten, L. and Hinton, G. (2008). Visualizing
high-dimensional data using t-sne. Journal of Ma-
chine Learning Research, 9:2579–2605.
van der Maaten, L., Postma, E., and van den Herik, H.
(2009). Dimensionality reduction: A comparative re-
view. Technical report, Tilburg University Technical
Report, TiCC-TR 2009-005.
Vellido, A., Martin-Guerroro, J., and Lisboa, P. (2012).
Making machine learning models interpretable. In
ESANN’12.
Venna, J., Peltonen, J., Nybo, K., Aidos, H., and Kaski, S.
(2010). Information retrieval perspective to nonlinear
dimensionality reduction for data visualization. Jour-
nal of Machine Learning Research, 11:451–490.
Ward, M., Grinstein, G., and Keim, D. A. (2010). Interac-
tive Data Visualization: Foundations, Techniques, and
Application. A. K. Peters, Ltd.
Yang, Z., Peltonen, J., and Kaski, S. (2013). Scalable opti-
mization of neighbor embedding for visualization. In
ICML (2), volume 28 of JMLR Proceedings, pages
127–135. JMLR.org.
Zhai, Y., Ong, Y.-S., and Tsang, I. (2014). The emerg-
ing ”big dimensionality”. Computational Intelligence
Magazine, IEEE, 9(3):14–26.
MetricLearninginDimensionalityReduction
239
