
Bioplausible Multiscale Filtering in Retinal to Cortical Processing as
a Model of Computer Vision
Nasim Nematzadeh
1
, Trent W. Lewis
1
and David M. W. Powers
1,2
1
School of Computer Science, Engineering and Mathematics, Flinders University, Adelaide, Australia
2
College of Computing, Beijing University of Technology, Beijing, China
Keywords: Visual Perception, Cognitive Systems, Pattern Recognition, Biological Neural Networks, Self-organising
Systems, Geometrical Illusions, Tilt Effects, Difference of Gaussian.
Abstract: Visual illusions emerge as an attractive field of research with the discovery over the last century of a variety
of deep and mysterious mechanisms of visual information processing in the human visual system. Among
many classes of visual illusion relating to shape, brightness, colour and motion, “geometrical illusions” are
essentially based on the misperception of orientation, size, and position. The main focus of this paper is on
illusions of orientation, sometimes referred to as “tilt illusions”, where parallel lines appear not to be
parallel, a straight line is perceived as a curved line, or angles where lines intersect appear larger or smaller.
Although some low level and high level explanations have been proposed for geometrical tilt illusions, a
systematic explanation based on model predictions of both illusion magnitude and local tilt direction is still
an open issue. Here a neurophysiological model is expounded based on Difference of Gaussians
implementing a classical receptive field model of retinal processing that predicts tilt illusion effects.
1 INTRODUCTION
Our visual perception of the world is the result of the
underlying processing of both parallel and
progressive (multilevel) visual information, starting
from the low level visual processing done in the
retina and passing information through multiple
levels of processing in the visual system. Visual
illusions are some of the visual distortion
experiences we encounter due to the limitations of
our visual information processing. It is likely these
effects emerge in specific processing stages either in
low level processing done in the retina or higher
level information processing in the cortex. Visual
illusions are often evident near or beyond the
thresholds of what our visual system can handle. So
by studying the visual illusions, we can better
understand the underlying mechanism and
limitations, and more generally the processing done
in our visual system. In the process we can also
develop new understanding and techniques for
computer and robot vision.
There are many approaches to the study of
illusion perception such as Gestalt psychology
(Gregory & Heard, 1979; Gilchrist et al., 1999),
computational models (Fermüller & Malm, 2004;
Robinson et al., 2007), neuro-biological, and
cognitive neuro-science approaches (Grossberg &
Todorovic, 1988; Penacchio & Otazu, 2013). Our
model is a bioplausible computational model
inspired by the low level multiscale filtering
performed in the retina itself.
The patterns explored are tilt illusions involving
enhancement of texture backgrounds such as
Checkerboard, Café Wall and bulging checkerboard
illusions. These types of illusions could be explained
in three different ways including: The theory of
‘contrast and assimilation’ (Smith et al, 2001),
‘perceptual inferences and junctions analysis’
providing high level explanations (Gilchrist et al.,
1999; Grossberg & Todorovic, 1988; Anderson,
1997, 2005), or ‘low level spatial filtering’
(Jameson, 1985; Blakeslee & McCourt, 2004).
For high-level explanation models, the ‘Scission
Theory’ proposed by Anderson (1997, 2005) triggers
the parsing of targets into multiple layers of
reflectance, transparency and illumination and
predicts that erroneous decomposition leads to
brightness illusions. Another high-level model is
‘Anchoring Theory’ (Gilchrist et al., 1999) based on
‘grouping factors’ that signal depth information.
Low-level theories are based on the mechanisms
305
Nematzadeh N., W. Lewis T. and M. W. Powers D..
Bioplausible Multiscale Filtering in Retinal to Cortical Processing as a Model of Computer Vision.
DOI: 10.5220/0005186203050316
In Proceedings of the International Conference on Agents and Artificial Intelligence (ICAART-2015), pages 305-316
ISBN: 978-989-758-074-1
Copyright
c
2015 SCITEPRESS (Science and Technology Publications, Lda.)

in early visual processing, e.g. simple image features
such as contrast edges rather than global scene
interpretation. For instance Jameson (1985)
proposed ‘Contrast/Assimilation Model’ which
qualitatively modelled both brightness contrast and
assimilation based on parallel processing at multiple
spatial scales by ‘Difference of Gaussians’ (DoG)
filters. Another example is Oriented-DoG (ODoG)
model proposed by Blakeslee and McCourt (1999,
2004) applying multiple scale and oriented DoG
filters to address many brightness/lightness illusions.
There is evidence that visual processing in the
retina is based on many resolutions simultaneously
(ter Haar Romeny, 2003). The idea mentioned by
Marr and Hildreth (1980) decades ago suggesting
that retinal processing carries ‘signatures’ of the
‘three-dimensional structure’ though did not
received physiological evidence at that time. It
seems that retinal low level multiscale processing
provide band pass visual information of the scene
which is an important factor in our real time quick
visual processing.
About how close these different explanations can
be, Dixon et al., (2013) claimed for connections
between ‘ODoG model’ (Blakeslee & McCourt,
1999) with higher level models such as ‘Anchoring
Theory’ of Gilchrist (1999). The key idea that is a
common principle in multiscale, inference base
brightness/lightness perception, mentioned to be
high pass filtering tuned to the object size.
In this paper we explore a multiscale model
based on the circular centre and surround
mechanism of classical receptive field (CRF) in the
retina relying on difference of Gaussian (DoG)
filters while assuming some limited number of
scales for the filter. The model’s output is a
multiscale pyramid of DoG filtered outputs in which
each scale of the filter creates a new layer of visual
information. The amount of information and its
accuracy is based on the neighbourhood size around
the edges that defined by the surround size of retinal
receptive field (RF) and proper scales of the DoG
filters.
The outputs from different scales of the DoG
filter can then be integrated. This multilayer
representation has a significant power in revealing
the underlying structure of the percept. It provides us
with enough information to start processing and
getting some preliminary 3D percept of the pattern,
containing edges, shades, some textures and even
may be some cues about the depth information. This
multiscale DOG filtering representation might be the
underlying mechanism to connect our model to some
high level explanations (e.g. Gilchrist et al., 1999).
This paper is organised as follows. Section Two
explains multiscale representation and spectral
analysis in computer vision (CV). Section Three
seeks for biological connections of these
mathematical transformations to our vision mainly
relying on the mechanism of retinal RFs and
classical receptive fields (CRFs) models. Section
Four includes the details of our model, the
experimental results on some tilt illusion patterns
and a roadmap for our ongoing and future research.
2 FILTERING AND VISION
There is considerable physiological evidence for
frequency and orientation tuning cells in our visual
system like (Hubel & Wiesel, 1962) and image
spectral analysis provides us important clues for the
final percept as the result of our visual processing.
2.1 Multiscale Representation
Experimental research in psychophysics and
physiological findings has suggested the multiscale
transforms as models of the processing and
projections in the visual cortex of mammals. Hubel
and Wiesel (1962) discovered a class of cells they
called simple cells, which have their response based
on the frequency and orientation of the visual stimuli
based on their examination on the cat’s visual
cortex. The physiological experiments showed that
their response could be modelled with linear filters,
whose impulse response has been measured at
different locations of the visual cortex. Daugmann
(1980) showed an approximation of impulse
response of these cortical cells by applying Gaussian
windows modulated by a sinusoidal wave in which
spatial orientation tuning of these cells modelled by
dilation of modulated Gaussians (e.g. Gabor
functions).
In the 1970s and 1980s, the need to extract
multiscale image information was established by
many researchers (Rosenfeld, 1971; Marr, 1982;
Burt & Adelson, 1983; Witkin, 1983) and some of
their ideas have later been subsumed by the wavelet
paradigm. The use of multiresolution sensor
provides high-resolution information (fine scales) at
selected locations and a large field of view with
relatively little data (coarse scale) at the same time.
Multiresolution algorithms can be implemented
using the multiresolution pyramid introduced by
Burt and Adelson (1983). Among many recent
studies on wavelets, Mallat (1996) was one of the
first to show the impact of wavelets for low-level
ICAART2015-InternationalConferenceonAgentsandArtificialIntelligence
306

vision by concentrating on three major applications
of wavelets, including multiresolution search,
multiscale edge detection and texture discrimination.
Pyramidal image representations
such as scale
invariant transforms (Lowe, 1999) are better
matched to human visual encoding than JPEG-DCT,
and in particular don’t need to partition an image
into blocks before processing. Scale-space analysis
can be performed based on image decomposition by
finding the differences between a pair of scaled
filters with different parameterizations e.g.
Laplacian or Difference of Gaussian filters create a
pyramidal scale hierarchy (Lindeberg, 2011). A
comprehensive comparison of diverse range of
geometric representations for different multiscale
spatial, directional and frequency selectivity
techniques is gathered by Jacques et al., (2011).
Although pyramidal representation with
additional scales is arguably over-complete, it has
the potential to provide a lower error model of the
data, and is more likely to provide the information at
the level of detail required for a particular image or
application. We further connect this to Marr’s idea
of 3D structure above the edge map (Marr &
Hildreth, 1980). We will present illusion processing
results that show evidence for this primitive causal
effect in low level retinal visual. Currently the
simulations of these high-level explanations for
illusion magnitude and error predictions result in
very complex CV models, which tend not to
generalize!
Note further that self-organization models of
repeated patterns of edge detectors at particular
angles are well established (von der Malsburg,
1973). Higher level spatial aggregation of regularly
spaced spots or edges in turn automatically gives
rise to analogues of DCT and DWT type bases, the
latter with localization determined by the higher
level lateral interaction functions or the constraints
of an underlying probabilistic connectivity model
(Powers, 1983).
2.2 Image Spectral Analysis in CV
Image processing in spatial (pixel) domain and in
spectral (frequency) domain have specific
applications in CV, though frequency analysis of the
visual scene seems more biologically plausible. The
more popular discretised spectral transforms are
includes DCT (Discrete Cosine Transform), DFT
(Discrete Fourier Transform), STFT (Short Term
Fourier Transform), and DWT (Discrete Wavelet
Transform).
Such families of functions include not only
bioplausible interaction functions as discussed in the
previous section, but are also fundamental to JPEG
and JPEG2000 compression. Those that are based on
true sinusoidals and/or Gaussians are perhaps not
directly bioplausible, but usefully approximate those
that are bioderived.
One of the main advantages of Fourier
transformation is facilitating image filtering and
convolution (Smith, 2003). The high/low pass
filtering function clearly can contribute to a
multiresolution model, as well as image sharpening
and noise removal, and we can also model edge
detection and texture matching in these terms.
DFT/DCT are intrinsically global and also suffer
from a “Leakage” problem (Merry & Steinbuch,
2005) due to periodically extending the signal.
Whenever localization either in space or time of
spectral components is needed, windowed or
enveloped versions can be used. For example STFT
is calculated by finding DFT after multiplication by
a window function, which is sliding over the entire
image. A main drawback of STFT arises from the
Nyquist-Heisenberg uncertainty principle (Merry &
Steinbuch, 2005), meaning that finding an
appropriate window size is a trade-off between time
and frequency resolution.
Wavelets are a more general approach, and DWT
has had a high impact on signal and image. By
dilation and translation of a mother wavelet,
extraction of very low frequency components at
large scales and very high frequency component at
small scales are possible. The conventional wavelet
has some limitations like shift sensitivity, poor
directionality and lack of phase information, with
newer techniques introduced to address them (Führ
et al., 2006).
Gabor wavelets are product of elliptical Gaussian
and complex plane wave that provide directionality.
Based on dilations and rotations of this generating
function, a set of self-similar Gabor filters generates
for different orientation and scale. This is a reliable
technique for direction and scale tuneable edge and
line detection. Gabor wavelet has the ability to
characterize the underlying texture and image
characteristics due to its ability in finding local
features in small windows, with additional
directional information (Xie et al., 2008; Ali &
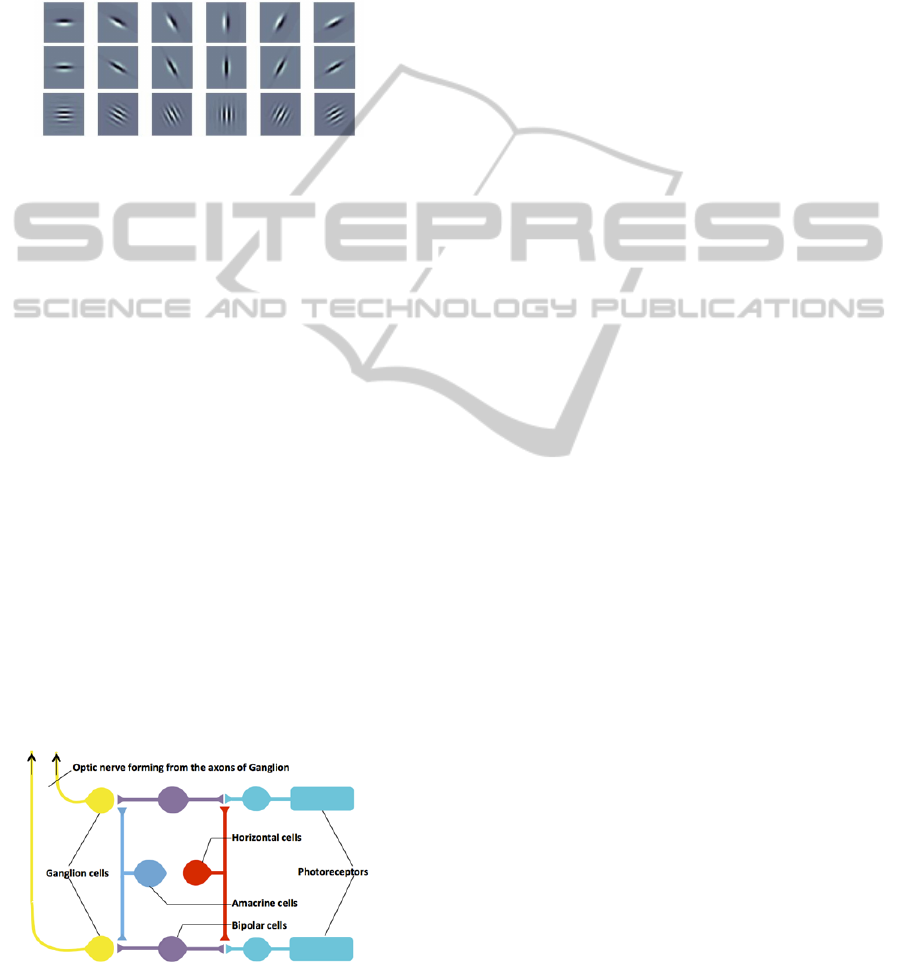
Powers, 2014). In our biological model, a Gabor-like
family of wavelets is implied, at different positions
in the retinal map, and at different frequencies at
different levels of processing. Figure 1 illustrates
three different oriented filter banks on a sample
scale.
Although there is physiological evidence for
BioplausibleMultiscaleFilteringinRetinaltoCorticalProcessingasaModelofComputerVision
307
frequency and orientation tuning cells both in the
retina and cortex and the ‘self-organization map’ of
orientation sensitivity (von de Malsburg, 1973),
there is still no specific evidence about the
bioplausibility of particular mathematical
transformations in our visual system, or
demonstration that specific models are more likely
than others.
Figure 1: One sample scale of 6 oriented filter banks (top)
DoG, (middle) LoG, and (bottom) Gabor wavelet.
3 BIOLOGY OF THE RETINA
3.1 Receptive Fields from Retina to
Cortex
The retina is a nerve tissue layer arranged in three
main layers including photoreceptors (rods and
cones), bipolar cells and ganglion cells (GCs). These
layers are then connected through two intermediate
layers of horizontal cells and amacrine cells (Fig 2).
The photoreceptors are the only retinal cells
which directly convert light into nerve impulses and
then transmit the impulses to layer two and three of
the retina the bipolar neurons, and ganglion neurons
respectively. Ganglion cells axons exit the eye and
carry the visual signals to the visual cortex. The
neurons in the intermediate layers also contribute in
the visual processing. Horizontal cells transmit the
photoreceptors outputs to a few surrounding bipolar
neurons, and the amacrine cells; activate the GCs
that are in their vicinity.
Figure 2: Retina layers including three main layers of
photoreceptors, bipolar cells and ganglion cells, and two
intermediate layers of horizontal cells and amacrine cells.
The figure reproduced using (McGill, 2014).
ON-centre and OFF-centre bipolar cells respond
differentially to the light stimuli on their receptive
field centres by either depolarization or
hyperpolarization. Like bipolar cells, the GCs have a
centre surround antagonism of concentric receptive
fields, and in response to stimuli, increase and
decrease the rate of action potential discharges
(McGill, 2014). Excitation and inhibition effect
happening based on light stimuli on the centre of an
ON-centre or OFF-centre GCs that can be easily
implemented by DoG filters.
Recent physiological findings have identified
further features of retinal ganglion cells (RGCs)
dramatically expanding our understanding of retinal
processing. Field and Chichilnisky (2007) published
a detailed study about circuitry and coding of the
information processing inside the retina, mentioning
that there are at least 17 distinct retinal ganglion cell
types and explained how they contribute in the
visual information encoding. Biological findings in
size variation of RGCs due to eccentricity and
dendritic field size (Shapley & Hugh Perry, 1986)
have been implemented in neuro-computational eye
models (e.g. Lourens, 1995; ter Haar Romeny,
2003).
A few types of RGCs found having orientation
selectivity similar to the cortical cells (Barlow &
Hill, 1963; Weng et al., 2005), even for horizontal
and amacrine cells neurobiological evidence showed
their elongated surround well beyond the CRF size
believed to be responsible for orientation detection
in the retina which modelled as retinal non-CRFs
(nCRFs) models (Carandini, 2004; Cavanaugh et al.,
2002; Wei et al., 2011).
All of these evidences indicate that based on the
diversity of intra-retinal circuits, different types of
RGCs (Field & Chichilnisky, 2007), and the
variations of the size of each individual RGCs due to
the retinal eccentricity (Lourens, 1995), the retinal
cells have the underlying mechanics of multiscale
processing from fine to coarse scales supporting
Marr’s indication of full primal sketch in early
stages of vision.
3.2 Retinal Low Level Visual
Processing
Linear filtering has many applications in CV such as
techniques for image improvement by sharpening
the edges and reducing noise. These procedures take
place by convolving the original image with an
appropriate kernel. In convolution, a rectangular grid
of coefficients (weights) known as the kernel is
multiplied by the activations of the neighbourhood
ICAART2015-InternationalConferenceonAgentsandArtificialIntelligence
308

elements of a particular pixel, and summed (or
averaged or integrated). We now explain the
relationship between the convolution operator and
the point spread function inside retina.
3.3 Lateral Inhibition and Point
Spread
Images can be viewed as a summation of impulses,
for instance variations of scale and shifted delta
function can generate an image. The characteristics
of a linear systems evaluated based on their impulse
responses, therefore the output image would be
equal to the input image convolved with the system's
impulse response. The impulse response is often
called the point spread function (PSF) (Smith, 2003).
The human visual system is an excellent example
of this concept. The first layer of the retina
transforms an input of a pattern’s light image into
another pattern consisting of nerve impulses. The
middle layer of the eye passes the bright spike, and
produces a circular region of increased darkness.
This process known as ‘lateral inhibition’, means
that if a nerve cell in the middle layer is activated, it
decreases the ability of its nearby neighbours to
become active. This biological convolution with its
specific PSF improves the ability of the eye to
understand the world.
The object recognition task and identifying
nearby objects in visual system is based on
distinguishing regions from their brightness and
colours. The mechanism in layer 2 of the retina by
sharpening the edges, facilitate this task. In the
processing of poor and blurry defined edge with
gradual change from dark to light such as ramp
Mach bands illusion, the brightness profile
appearing on the optic nerve as the output from
layer 2, has overshoot and undershoot presence,
reinforces the two regions between the light and
dark areas to appear more abrupt (Smith, 2003).
The lateral inhibition mechanism in layer 2 of the
retina seems to be the underlying mechanism of low
level models for addressing brightness lightness
illusions. The middle layer of the retina is an edge
enhancement or high-pass filter, but the first layer of
the retina with nonlinear mechanism, approximately
taking the logarithm of the incoming image for
retinal gain control. This nonlinearity results in
flattening the illumination component and makes it
possible for the eye to see under poor light condition
(Smith, 2003). Both the nonlinearity and filtering in
layer 2 of the retina seem to be important clues for
addressing brightness lightness illusions (Kingdom,
2011), as well as the tilt illusions, which have been
less well studied but are our present focus.
3.4 Classical Receptive Field Models
Classical receptive field (CRFs) models mainly
emphasize the contrast sensitivity of the retinal
ganglion cells and are modelled based on the
circular centre and surround antagonism using
differences and second differences of Gaussians
(DoG) or Laplacian of Gaussian (LoG) (Ghosh et
al., 2007) to reveal the edge information.
The retinal CRF models date back to the 1960s
when Rodieck & Stone (1965) and Enroth-Cuggel
(1966) used the DoG model for implementing RFs
of the RGCs based on their contrast sensitivity with
centre having smaller Gaussian variance compared
to the surround. Marr and Hildreth (1980) proposed
replacing DoG with LoG and claimed the
equivalence of DoG and LoG based on a certain
ratio ofσ (sigma) of the centre and surround
Gaussians. Powers (1983) showed that DoG models
can themselves results from a simple biophysical
model of ontogenesis and can usefully approximate
the interaction functions proposed in a variety of
neural models.
Jameson (1985) developed an early model of
brightness assimilation and contrast based on DoG
filters with multiple spatial scales. In a later study
(Jameson & Hurvich, 1989) they pointed out that
this processing occurs in parallel and accounts for
the simultaneous appearance of sharp edges and
blended colour that define delimited regions. They
claimed about the source of contrast and assimilation
by saying that contrast effect happening when the
stimulus components are relatively large compared
to the centre of the filter, and assimilation effect
arise when stimulus components are small compared
to the filter centre. Similar explanations have been
proposed for the checkerboard illusion by modelling
multichannel analysis of human contrast sensitivity
based on pattern’s spatial frequency (Devalois &
Devalois, 1988).
Our visual perception of a scene starts by
extracting the edge map of the scene and DoG is a
bioplausible implementation to model this process.
The extracted edge map is an essential and primitive
task in most image processing applications, but edge
map alone cannot provide any information about the
shades, lights, and also three dimensional structure
of the image (Ghosh et al., 2007). Therefore
according to Marr’s ‘raw primal sketch’, there is a
need for further processing to get the ‘full primal
sketch’ for a 3D view of the world (Marr & Hildreth,
1980).
BioplausibleMultiscaleFilteringinRetinaltoCorticalProcessingasaModelofComputerVision
309

Applying LoG (Marr & Hildreth, 1980) instead of
DoG shows the possibility of involvement of higher
order Gaussian derivatives in the filtering functions
in retinal visual processing. Young (1985, 1987)
introduced modelling of the retinal and cortical RFs
of many neurons based on linear combination of
Gaussians and higher derivatives of Gaussian. In a
recent study, Ghosh et al., (2007) used the 4
th
and 6
th
order derivatives of Gaussians to extract the shade
information next to the edges. Still there is no
biological evidence on the structure of these
functions.
The existence of new features in retinal cells
showed more delicate retinal information processing
which introduced the concept of non-classical
receptive fields (nCRFs) of RGCs. The experimental
findings done by Passaglia et al. (2001) indicated
that the surround has an extension well beyond the
CRFs. Based on the nCRFs implementation (Chao-
Yi & Wu, 1994; Wei et al, 2012) Blakeslee and
McCourt (2004) proposed a directional multiscale
DoG filter model for explaining the magnitude of
various White’s effect patterns. There are also
approaches for nCRFs implementation of the
cortical cells (Rao & Ballard, 1999; Grigorescu et
al., 2003; Tanaka & Ohzawa, 2009).
4 OUR MODEL
It has shown that the GCs excitation can be best
described by centre surround organization (Mangel,
1991), which can be modelled by differences of two
Gaussians (Linsenmeier et al., 1982). A ‘neuro-
physiological model’ has been proposed here based
on multiscale DoG filtering for retinal RF’s
implementation. Our goal here is exploring more
about the mechanism and the outputs coming from
layer 2 of the retina, and analyse whether this low
level visual representation could provide us with
enough information for revelling the tilt illusion
effect or not?
4.1 Multiscale Implementations of
Difference of Gaussians (DoG)
Difference of Gaussians is a filtering technique for
identifying the edges and multiscale representation
of DoG filters can produce the multiscale edge map.
DoG edge detection process starts by first
performing a Gaussian blurring with a specified
sigma () on the original image, results in a blurred
version of the image. Then another blurring with the
second Gaussian with sharper sigma (finer scales)
produces the second output with less blurring effect.
The final result calculated by finding the difference
between the two blurred results of the original
image. The zero crossings of the final result define
the edges, as the pixel values having some variation
in their surrounding neighbourhood.
For a 2D signal such as pattern I, the DoG output
of our retinal GCs model with centre surround
organization is given by:
Γ
,
x,
y
I∗
1
2πσ
e
/
I ∗
1
2π
K
σ
e
/
(1)
where the distance from the origin in the horizontal
and vertical axes are x and y respectively, σ is the
sigma of centre Gaussian, and σ indicates the
sigma of the surround Gaussian. Therefore based on
the K factor, the ratio of the surrond Gaussian to the
centre Gaussian is defined. This is the retinal PSF
introduced in section 3.3 modelling lateral inhibition
in layer 2 of the retina.
Figure 3: Difference of Gaussian filter withsigma of 7 for
the centre and 14 for the surround. Window size is
112×112 pixels.
A3D graph of a sample DOG filter is shown in
Figure 3. The value of K in our model set to 2 as
used in the ODoG model (Blakeslee & McCourt,
2004), but our model have a circular centre surround
organization instead of the oriented elongated
surround used in the ODoG model. By increasing
the K factor in Eq. (1), the surround suppression
affects more on the final predicted output. Rather
than the K factor, the DoG window size is another
parameter in the model. Very large windows result
in long computation, and very small windows are
just approximating a box blur filter not weighted
Gaussian one. We set a parameter to define the
window size based on the sigma of the centre
Gaussian and tested different ratios from 3 to 20. For
the experimental results in section 4.4 the window
size set to 6 times larger than the centre Gaussian to
both capture the excitation and inhibition effect.
ICAART2015-InternationalConferenceonAgentsandArtificialIntelligence
310
What we found is that the model is not sensitive to
exact parameter setting. Ideally the models’
parameters are set so that at the finest scale, it can
capture high frequency texture details and at coarse
scales, the kernel has appropriate size relative to the
objects within the scene.
The suggestion of involvement of higher order
Gaussian derivatives first mentioned by Marr’s LoG
approximation in retinal image processing (Marr &
Hildreth, 1982), and the idea used on many research
such as Young (1985, 1987) who applied linear
combination of Gaussian and LoG instead of DoG
(Figure 1), but there is still no biological evidence
for the structure of these functions.
Powers (1983) also proposed an ontogenetic
Bernoulli-like model showing that an appropriate
lateral interaction function can self-organize, and
can approximate many existing mathematical
models, including DoG models and LoG models
(emergent as two levels of DoG processing) noting
that processing is not particularly sensitive to the
parameterization or shape of the filter function.
Indeed cluster-level aggregates of Powers’ Bernoulli
model approximate to Poisson and Gaussian models.
The idea of scale-space analysis is based on
image decomposition, then finding the differences
between a pair of scaled filters (e.g. DoG or LoG)
with different parameterizations, which then used to
create a pyramidal scale hierarchy (Lindeberg,
2011). Our model has a multiscale stack of filtered
outputs to reveal the final percept.
Building a pyramid with additional scales or
multiple models is over-complete but has the
potential to provide a lower error model of the data,
and in particular is more likely to provide the
information at the level of detail required for a
particular image or application. This would in turn
support the connections of Marr’s raw primal to full
primal sketch and his speculation of 3D structure
above the edge map (Marr & Hildreth, 1980). Our
results show evidence for this primitive causal effect
in low level retinal visual processing in terms of
perceptual illusion models. These effects can in turn
be expected to contribute to higher level models of
depth and motion processing.
4.2 Investigated Patterns
The patterns we have investigated here are given in
Figure 4. All of the patterns in this class have a
background effect (such as checkerboards) as well as
other cues such as mortar lines in the Café Wall
illusion or superimposed dots on complex bulge
patterns, which all affect the final percept. From
now on, we refer to this type of tilt illusions as ‘2
nd
order’ tilt effects. The complex bulge pattern
designed by Kitaoka (“A Bulge”, Figure 4), and
similar patterns generated
in the present project with
different shapes of inducing dots (Figure 5), belong
to 2
nd
order tilt effect illusions, and the
superimposed dots on their backgrounds give some
impression of foreground background percept.
Different position of dots on the textured
background, result in some tilt, bow or wave
perception along the edges as well as expansion and
contractions on checkers corners.
Figure 4: Investigated patterns (top): Café Wall, simple
bulge Checkerboard, and (bottom) Complex bulge pattern
(Kitaoka: “A Bulge”) - http://www.ritsumei.ac.jp/
~akitaoka/index-e.html.
4.3 Alternate Explanations
Results from psychophysical and computational
research have shown that the low level visual
processing models are able to explain some low
level visual illusions. As an example, the ODoG
model presented by Blakeslee and McCourt (2004)
claimed to be a parsimonious model for brightness
induction illusions (Kingdom, 2011) with the ability
to predict both the illusion magnitude as well as its
orientation. For improvement of global
normalization step in the ODoG model, two
extensions of the model proposed by Robinson et al.,
(2007) to implement local normalization of
multiscale oriented outputs. There are other similar
BioplausibleMultiscaleFilteringinRetinaltoCorticalProcessingasaModelofComputerVision
311

models based on higher order derivatives of
Gaussians (e.g. Ghosh et al., 2007).
Figure 5: Similar complex bulge patterns with circular and
rectangular superimposed dots on a checkerboard result in
‘2
nd
order’ tilt effects.
There have been attempt to explain geometrical
illusion patterns as well as brightness illusion
patterns by using high level visual models, such as
the perceptual inferences and fill in models proposed
by Grossberg and Todorovic (1988), as well as
Gestalt grouping and junction analysis (Gilchrist et a
l., 1999). But we are exploring the explanatory
power of retinal level filtering, showing that this low
level processing mechanism can provide enough
information to explain a significant family
geometrical illusion effects without requiring the
high computational and training cost of high level
visual models.
There has also been experimental research (e.g.
Jameson 1985; Westheimer, 2007) that specifically
connects ‘brightness induction’ illusions and
‘geometric illusions’. For instance, some
explanations for ‘SBC’ (Simultaneous Brightness
Contrast illusion: Figure 6-left), where a gray test
patch looks darker on a white background compared
to an identical patch on a black background,
suggested the involvement of some neurons with
small excitatory center and elongated surround
(nCRFs) that could be modeled with either ‘wavelet
based modeling’ (Otazu et al., 2008) or ‘DoG based
models’ (Blakeslee & McCourt, 1999, 2004).
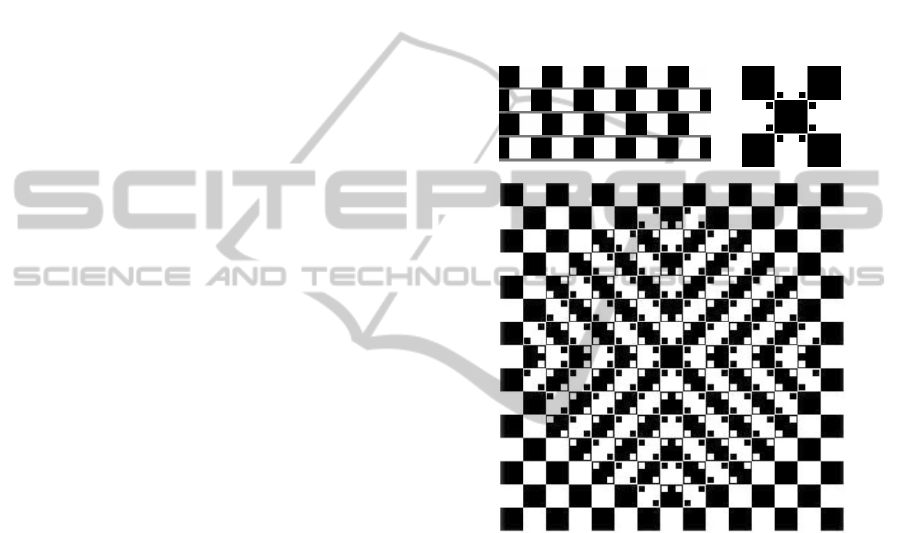
Figure 6: (left) SBC (Simultaneous Brightness Contrast)
illusion, where identical gray test patches appear with
misperception of brightness, and (right)Irradiation pattern
where equal sized black and white test patches appear with
the misperception of size.
Another similar illusion is ‘irradiation pattern’
(Figure 6-right) in which two equal size test patches
of white and black, when positioned on the opposite
colour backgrounds, result in size misperception and
white patch on the black background appears larger.
Westheimer (2007) explained the irradiation effect
and Café Wall illusion by addressing the border shift
in those patterns due to the ‘retinal light spread’,
‘compressive nonlinearity’ and the ‘centre-surround
organization’ of retinal cells. He then mentioned
other factors involved for the final percept such as
cortical stages of straight and sharp borders, pointed
corners, slope of lines, and angle shifts.
Therefore the illusion perception in these 2
nd
order tilt patterns seems to get effect from
‘brightness assimilation and contrast’ as well as
some ‘border shifts’ similar to our investigated
patterns. So for these categories of illusions, the
final percept is not only affected by the brightness
induction, but is also certainly influenced by the
bulging effect happening in the corners of the test
patch, which is basically of geometrical measures
not the exact intensity ones. We are looking to find
whether our multiscale retinal model is able to
address both ‘brightness induction’ and ‘geometrical
clues’ at the same time or not. The model analysis
could potentially be extended to even patterns
related to some other brightness induction illusions
with some minor changes to the model such as
additional multi orientation information.
Some researchers suggest a connection between
brightness induction and geometrical illusions by
other names, such as ‘brightness contrast and
assimilation’ by Jamson (1985), ‘encroachment of
bright regions into dark ones’ and ‘corner effect’ in
Westheimer (2007), ‘diagonal grouping’ along
checkerboard tiles connecting brightness
assimilation to the contrast by Gilchrist (1999),
‘diagonal components’ by Ninio (2006) which claim
to be the missing clue for the tilt illusion
explanations. There thus may be interacting or
related mechanism affecting these two supposedly
distinct illusion categories, and multiscale oriented
spatial filtering could explain the basic underlying
mechanism for the appearance of these effects. In a
complete review of lightness, brightness, and
transparency (LBT), Kingdom (2011) presented a
quarter century of new ideas, mentioned one of the
most promising developments in LBT are models of
brightness coding based on ‘multiscale filtering’ in
conjunction with ‘contrast normalization’.
The contribution of our work to the current
studies is to highlight the multiscale edge map
information derived from a bioplausible modelling
ICAART2015-InternationalConferenceonAgentsandArtificialIntelligence
312
of CRFs by multiscale DoG filters, and use this
multiscale edge representation as a basic neural
model that explains low level illusion precepts.
Figure 7: Café Wall results with centre/surround/window
in the ratio 1:2:6. (a) Multiscale output result for scale
varying from fine to coarse scale starting from the centre
Gaussian of 1 (top-left), increasing 1 pixel at a time to 12
pixels (bottom-right). Original image for the Café Wall
illusion (b) with enlarged output (c) for.6.
4.4 Model’s Predictions and Results
A common assumption is that information in the
visual systems is processed at multiple levels of
resolution, perhaps simultaneously, perhaps
sequentially in some sense. The information in each
scale of our pyramidal bioplausible representation
result creates a new layer of visual information and
investigation of this pyramidal output result from
different scales provides us the multiscale edge map
containing edges, shades around edges, some
textures and even may be some clues about the depth
information as mentioned in full primal sketch of the
3D scene by Marr and Hildret (1980).
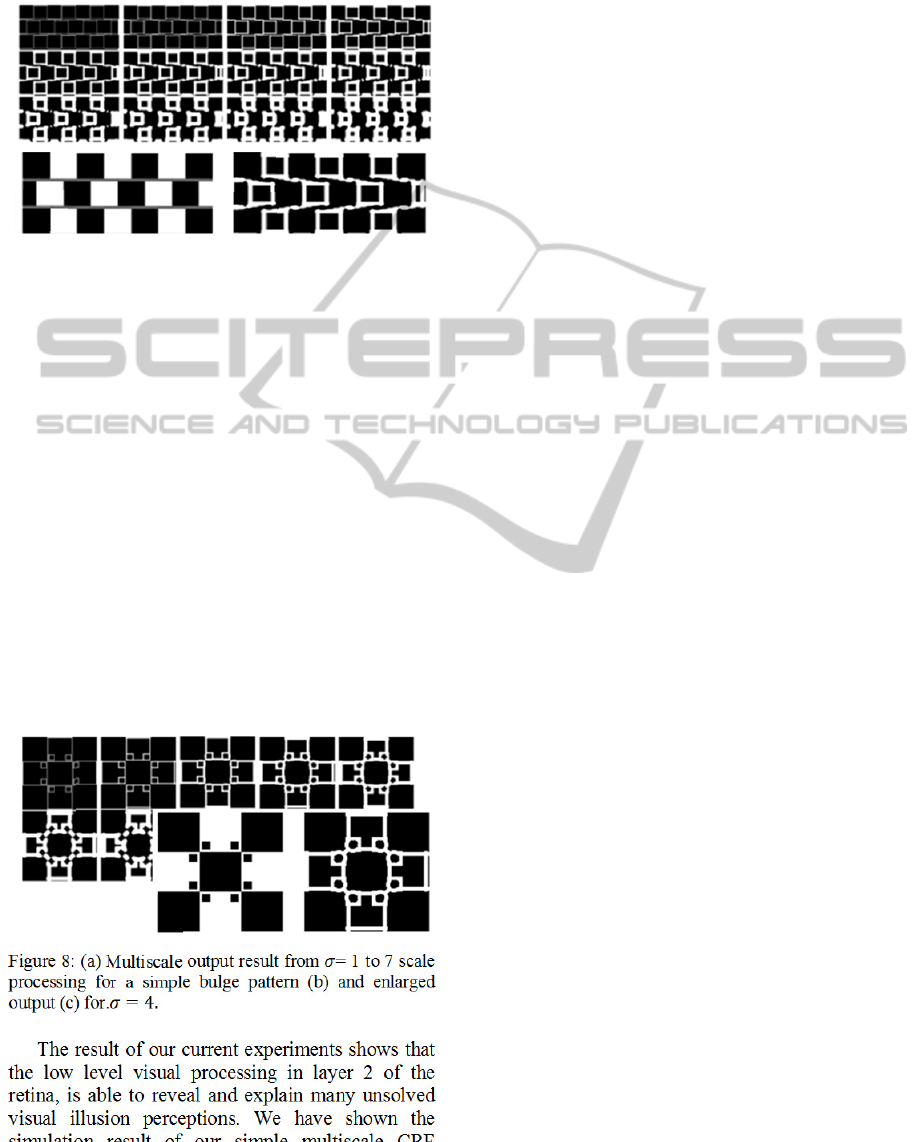
Figure 8: (a) Multiscale output result from = 1 to 7 scale
processing for a simple bulge pattern (b) and enlarged
output (c) for.4.
The result of our current experiments shows that
the low level visual processing in layer 2 of the
retina, is able to reveal and explain many unsolved
visual illusion perceptions. We have shown the
simulation result of our simple multiscale CRF
model based on circular centre and surround
organization using multiscale DoG based filtering
representation. We are currently exploring adding
orientation resolution to our model and extending it
to nCRFs model based on more recent physiological
findings related to orientation based multiscale
filtering in the retina (Carandini, 2004; Cavanaugh
et al., 2002; Passaglia et al., 2001; Tanaka &
Ohzawa, 2009).
The output results of the 2
nd
order tilt patterns
investigated here are organised in the Figures 7, 8
and 9 from low to high scale of the DoG filters
starting from top-left corner by moving to the right
in each row and downwards to go to the next row.
We tried to represent the multiscale representation of
our bioplausible retinal model, in a way that the
output result can be seen easily as a sequence of
increasing scales. Also the result shows an enlarged
output for a specific scale of the DoG filter, which
highlight the illusion effect well. The output results
on the 2
nd
order tilt patterns of Café Wall, simple
3×3 Bulge patterns, and complex bulge pattern,
showed that utilizing simply a multiscale DoG
filtering analysis based on classical model for RFs
on those patterns, not only revealed the sharp edges
when small scale filters are used, but also by
increasing the filter scale, other hidden information
such as local texture information was revealed as
well. These results not only add weights to the
findings behind the Jameson’s (1985) ‘contrast and
assimilation theory’, but also indicated that there are
lots of geometrical clues which can be revealed from
this bioplausible multiscale representation.
Of those geometrical cues, our model highlights
the perception of divergence and convergence of
mortar lines in the “Café Wall” illusion shown in
Figure 7. Similar explanation for Café Wall illusion
is given by other researchers in the field based on
low level filtering models (Tani et al., 2006;
McCourt, 1983), although there are some
psychological explanations for it as well (Gregory &
Heard, 1979).
The experimental results show that on the
“Bulge patterns” in Figures 8 and 9, a bulge effect
occurs both in the simple pattern as well as the
complex one, which based on our assumption, is
happening due to a few visual clues for instance the
brightness perception of the checkerboard
background causing a simple border shifts outwards
for white tiles, the expansions happening in the
intersection angles, and some further clues related to
local position of dots, which may have frequency
discharge or emission results in local border tilts or
bow. This might be addressed by high level effects
(a)
(b) (c)
(c)
(b)
(a)
BioplausibleMultiscaleFilteringinRetinaltoCorticalProcessingasaModelofComputerVision
313
or psychological explanations for bulge effect
patterns such as uncertainties in both formation and
processing of image features such as points and lines
(Fermüller & Malm, 2004) and also categorization
of edges based on different intensity values around
them (Gregory & Heard, 1979; Kitaoka, 2007), but it
has a biological neural explanation for that which we
are interested in.
The pyramidal outputs from our model seem to
easily connect to ‘Gestalt grouping’ principles for a
psychological point of view that assumes the
grouping rules as basic blocks for perception of the
world. Our model suggests grouping principals as
we find different perceptual groupings occur at
different scales of the DoG filter applied to the
pattern.
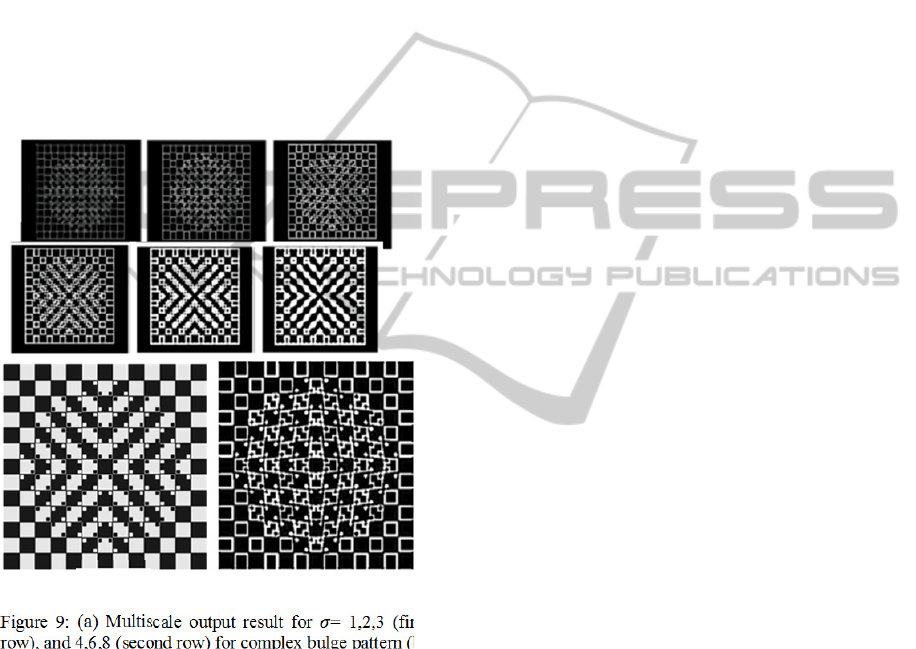
Figure 9: (a) Multiscale output result for = 1,2,3 (first
row), and 4,6,8 (second row) for complex bulge pattern (b)
with enlarged scale output (c) for.3.
For example in “Complex Bulge” pattern for
lower scale filters (Fig 9) we first see the central
bulge which gradually expands to a level in which
another grouping principle dominates in as an X
rather than a bulge. In the “Café Wall” illusion (Fig
7) the appearance of diverging and converging
mortar lines when the DoG filter has a mid-range
scale appear, and by increasing the scale the effect
of mortar lines disappear and another perceptual
grouping of tiles along vertical direction opposite to
the direction of near horizontal mortar effect start to
appear. It is quite likely that this multiscale
representation is the underlying mechanism of not
only perceptual grouping but also some of the higher
level illusion explanatory models.
5 CONCLUSIONS
We have presented our preliminary investigation of
a variant of the classical retinal receptive field
(CRFs) model that implementing a circular centre
and surround mechanism and uses DoG to explain
some of the tilt illusion patterns such as Café Wall
and both Simple And Complex Bulge patterns which
we refer to them all as ‘2
nd
order’ tilt patterns. We
focus on low level processing based on what takes
place in the retinal ganglia. We further expect that
these retinal filter models will prove to play a
significant role in higher level models of depth and
motion processing. Currently the simulations of
these high-level explanations for illusion magnitude
and error predictions result in very complex CV
models, which tend not to generalize. In our future
work we are extending the model to a non-classical
receptive field (nCRF) model with circular centre
and elongated surrounds inspired by our visual
system, and moving to identify angles of orientation
and motion quantitatively.
The experimental results showed that the output
of the model could provide us not only the
multiscale edge map as the indications for some
shades around the edges, but also we get other
information such as local texture information hidden
in the pattern as well. In this multiscale
representation, the information from each scale of
DoG filtering creates a new layer of visual
information.
The outputs from different scales of the DoG
filter can then be integrated to generate a multiscale
pyramid of the outputs generated by the DoG model.
This multiscale pyramidal representation provides us
with enough information to start processing and
getting some introductory 3D percept of the pattern,
including information of edges, shades, some
textures and even may be some preliminary clues
about the depth information, as mentioned by Marr’s
speculation of full primal sketch to complete our 3D
view of the world.
This multiscale filtering representation can be
used for illusion perception prediction and our future
study is on efficient data representation as well as
systematic analysis for predicting both illusion
magnitude and local shift direction by additional
orientation tuning to the model. Also we are keen to
make a connection between our bioplausible model
(c)
(a)
(b)
ICAART2015-InternationalConferenceonAgentsandArtificialIntelligence
314

with the psychological aspects of ‘Gestalt grouping
principles’.
ACKNOWLEDGEMENTS
This work was supported in part by the Chinese
Natural Science Foundation under Grant No.
61070117, the Beijing Natural Science Foundation
under Grant No. 4122004, and the Australian
Research Council under ARC Thinking Systems
Grant No. TS0689874, as well as the Importation
and Development of High-Caliber Talents Project of
Beijing Municipal Institutions.
REFERENCES
Ali, H. B., Powers, D. M., 2014. "Facial Expression
Recognition Based On WAPA AND OEPA FASTICA".
International Journal of Artificial Intelligence &
Applications, 5(3).
Anderson, B. L., 1997. "A theory of illusory lightness and
transparency in monocular and binocular images: The
role of contour junctions". Perception-London-, 26,
419-454.
Anderson, B. L., Winawer, J., 2005. "Image segmentation
and lightness perception". Nature, 434(7029), 79-83.-
Scission theory.
Barlow, H. B., Hill, R. M., 1963. "Selective sensitivity to
direction of movement in ganglion cells of the rabbit
retina". Science, 139(3553), 412-412.
Blakeslee, B., McCourt, M. E., 1999. "A multiscale spatial
filtering account of the White effect, simultaneous
brightness contrast and grating induction". Vision
research, 39(26), 4361-4377.
Blakeslee, B., McCourt, M. E., 2004. "A unified theory of
brightness contrast and assimilation incorporating
oriented multiscale spatial filtering and contrast
normalization", Vision Research, 44, 2483–2503.
Burt, P. Adelson, E., 1983. "The Lapalacian pyramid as a
compact image code", IEEE Trans. Comm., vol.
COM-31, pp. 532-549, Apr.
Carandini, M., 2004. "Receptive fields and suppressive
fields in the early visual system". The cognitive
neurosciences, 3, 313-326.
Cavanaugh, J. R., Bair, W., Movshon, J. A., 2002. "Nature
and interaction of signals from the receptive field
center and surround in macaque V1 neurons". Journal
of neurophysiology, 88(5), 2530-2546.
Chao-Yi, L., Wu, L., 1994. "Extensive integration field
beyond the classical receptive field of cat's striate
cortical neurons—classification and tuning
properties". Vision research, 34(18), 2337-2355.
Daugmann, J. G., 1980. "Two-dimensional spectral
analysis of cortical receptive field profile", Vision
Res., vol. 20, pp. 847-856.
DeValois, R. L., DeValois, K. K., 1988. "Spatial vision".
New York: Oxford University Press.
Enroth-Cugell, C., Robson, J.G., 1966. "The contrast
sensitivity of the retinal ganglion cells of the cat",
Journal of Physiology (London) 187 517–552.
Field, G. D., Chichilnisky, E. J. 2007. "Information
processing in the primate retina: circuitry and
coding". Annu. Rev. Neurosci., 30, 1-30.
Führ, H., Demaret, L., Friedrich, F., 2006. "Beyond
wavelets: New image representation paradigms".
Document and image compression, 7, 179-206.
Fermüller, C., Malm, H., 2004. "Uncertainty in visual
processes predicts geometrical optical illusions".
Vision research, 44(7), 727-749.
Ghosh, K. Sarkar, S. Bhaumik, K. 2007. "Understanding
image structure from a new multiscale representation
of higher order derivative filters". Image and Vision
Computing 25(8): 1228-1238.
Gilchrist, A., Kossyfidis, C., Bonato, F., Agostini, T.,
Cataliotti, J., Li, X., et al. 1999. "An anchoring theory
of lightness perception". Psychological Review, 106,
795–834.
Gregory, R. L., Heard, P., 1979.
"Border locking and the
Café Wall illusion". Perception, 8(4), 365-380.
Grigorescu, C., Petkov, N., Westenberg, M. A., 2003.
"Contour detection based on nonclassical receptive
field inhibition". Image Processing, IEEE Transactions
on, 12(7), 729-739.
Grossberg, S., Todorovic, D., 1988. "Neural dynamics of
1-D and 2-D brightness perception: A unified model of
classical and recent phenomena". Perception &
Psychophysics, 43, 241–277.
Hubel, D. Wiesel, T., 1962. "Receptive fields, binocular
interaction and functional architecture Ain the cat’s
visual cortex", J. Physiol., vol. 160.
Jacques, L., Duval, L., Chaux, C., Peyré, G., 2011. "A
panorama on multiscale geometric representations,
intertwining spatial, directional and frequency
selectivity". Signal Processing, 91(12), 2699-2730.
Jameson, D., 1985 . "Opponent-colours theory in the light
of physiological findings". In D. Ottoson, & S. Zeki
(Eds.), Central and peripheral mechanisms of colour
vision (pp. 83–102). London: MacMillan.
Jameson, D., Hurvich, L. M., 1989. "Essay concerning
color constancy". Annual review of psychology,
40(1), 1-24.
Kingdom, F. A. A., 2011. "Lightness, brightness and
transparency: A quarter century of new ideas,
captivating demonstrations and unrelenting
controversy". Vision Research, 51, 652–673.
Kitaoka, A., 2007. "Tilt illusions after Oyama (1960): A
review1". Japanese Psychological Research, 49(1), 7-
19.
Lourens, T., 1995. "Modelling retinal high and low
contrast sensitivity filters". In From Natural to
Artificial Neural Computation (pp. 61-68). Springer
Berlin Heidelberg.
Lowe, D. G., 1999. "Object recognition from local scale-
invariant features". Proceedings of the International
Conference on Computer Vision 2. pp. 1150–1157.
BioplausibleMultiscaleFilteringinRetinaltoCorticalProcessingasaModelofComputerVision
315

doi:10.1109/ICCV.1999.790410.
Lindeberg, T., 2011. "Generalized Gaussian scale space
axiomatics comprising linear scale-space, affine
scale-space and spatio-temporal scale-space", Journal
of Mathematical Imaging and Vision, Volume 40,
Number 1, 36-81.
Linsenmeier, R. A., Frishman, L. J., Jakiela, H. G.,
Enroth-Cugell, C., 1982. "Receptive field properties of
X and Y cells in the cat retina derived from contrast
sensitivity measurements". Vision research, 22(9),
1173-1183.
Mallat, S., 1996. "Wavelets for Vision". Proceedings of the
IEEE, vol 84, no. 4, april 1996.
von der Malsburg, C., 1973. "Self-organization of
orientation sensitive cells in the striate cortex".
Kybernetik, 14(2), 85-100.
Mangel, S. C., 1991. "Analysis of the horizontal cell
contribution to the receptive field surround of
ganglion cells in the rabbit retina". The Journal of
physiology, 442(1), 211-234.
Marr, D., Hildreth, E., 1980. "Theory of edge detection",
Proc. of Royal Society of London B 207, 187–217.
Marr, D., 1982. "Vision", W.H. Freeman and Company,
New York. Zero-crossing.
McCourt, M. E., 1983. "Brightness induction and the von
der Malsburg illusion". Perception 12: 131-142.
McGill C. A., 2014. Le cerveau à tous les niveaux.
[ONLINE] Available at: http://thebrain.mcgill.ca.
(Including links vision, and retina).
Merry, R. J. E., Steinbuch, M., 2005. "Wavelet theory and
applications". A literature study, Eindhoven
University of Technology.
Ninio, J., Pinna, B., 2006. "Orthogonal expansion: a
neglected factor in tilt illusions". Psychologia, 49(1),
23-37.
Otazu, X., Vanrell, M., Alejandro Parraga, C., 2008.
"Multiresolution wavelet framework models brightness
induction effects". Vision Research, 48(5), 733-751.
Penacchio, O., Otazu, X., Dempere-Marco, L., 2013. "A
Neurodynamical Model of Brightness Induction in
V1". PloS one, 8(5), e64086.
Passaglia, C. L., Enroth-Cugell, C., Troy, J. B., 2001.
"Effects of remote stimulation on the mean firing rate
of cat retinal ganglion cells", Journal of Neuroscience
21, 5794–5803.
Powers, D. M. W., 1983. "Lateral Interaction Behaviour
Derived from Neural Packing Considerations",
Technical Report No 8317, Department of Computer
Science, University of NSW, Australia.
Rao, R. P., Ballard, D. H., 1999. "Predictive coding in the
visual cortex: a functional interpretation of some
extra-classical receptive-field effects". Nature
neuroscience, 2(1), 79-87.
Robinson, A. E., Hammon, P. S., de Sa, V. R., 2007.
"Explaining brightness illusions using spatial filtering
and local response normalization". Vision research,
47(12), 1631-1644.
Rodieck, R. W., Stone, J., 1965. "Analysis of receptive
fields of cat retinal ganglion cells", Journal of
Neurophysiology 28, 833–849.
Rosenfeld, A., Thurston, M., 1971. "Edge and curve
detection for visual scene analysis". Computers, IEEE
Transactions on, 100(5), 562-569.
Shapley, R., Hugh Perry, V., 1986. "Cat and monkey
retinal ganglion cells and their visual functional
roles". Trends in Neurosciences, 9, 229-235.
Smith, R. G., Freed, M. A., Sterling, P., 1986.
"Microcircuitry of the dark-adapted cat retina:
functional architecture of the rod-cone network". The
Journal of neuroscience, 6(12), 3505-3517.
Smith, S. W., 2003. "Digital signal processing: a practical
guide for engineers and scientists". Newnes.
Smith, V. C., Jin, P. Q., Pokorny, J., 2001. "The role of
spatial frequency in color induction". Vision
Research, 41, 1007–1021.
Tanaka, H., Ohzawa, I., 2009. "Surround suppression of
V1 neurons mediates orientation-based representation
of high-order visual features". Journal of
neurophysiology, 101(3), 1444-1462.
Tani, Y., Maruya, K., Sato, T., 2006. "Reversed Café Wall
illusion with missing fundamental gratings". Vision
research, 46(22), 3782-3785.
ter Haar Romeny, B. M., 2003. "A scale-space model for
the retinal sampling. Front-End Vision and Multi-
Scale Image Analysis". Multi-Scale Computer Vision
Theory and Applications, written in Mathematics,
167-177.
Wei, H., Wang, Z. Y., Zuo, Q. S., 2012. "A model of
image representation based on non-classical receptive
fields". In Advances in Neural Networks–ISNN 2012
(pp. 297-306). Springer Berlin Heidelberg.
Wei, H., Zuo, Q., Lang, B., 2011. "Multi-scale image
analysis based on non-classical receptive field
mechanism". In Neural Information Processing (pp.
601-610). Springer Berlin Heidelberg.
Westheimer, G., 2007. "Irradiation, border location, and
the shifted-chessboard pattern". Perception, 36(4),
483.
Witkin, A. P., 1983. "Scale-space filtering", in:
Proceedings of International Joint Conferences on
Artificial Intelligence, Karlsruhe, pp. 1019–1022.
Xie, X., Lam, K. M., Zhao, H., Dai, Q., 2008. "Efficient
rotation-and scale-invariant texture classification
method based on Gabor wavelets". Journal of
Electronic Imaging, 17(4), 043026-043026.
Young, R.A., 1985. "The Gaussian derivative theory of
spatial vision: analysis of cortical cell receptive field
line weighting profiles". General Motors Research
Publication GMR-4920.
Young, R. A., 1987. "The Gaussian derivative model for
spatial vision: I. Retinal mechanisms", Spatial Vision
2, 273–293.
ICAART2015-InternationalConferenceonAgentsandArtificialIntelligence
316
