
A Study about Discovery of Critical Food Consumption Patterns
Linked with Lifestyle Diseases using Data Mining Methods
Farshideh Einsele
1
, Leila Sadeghi
2
, Rolf Ingold
3
and Helena Jenzer
2
1
Section of Business Information, Bern University of Applied Sciences, Switzerland
2
Health Division, a R&D in Nutrition and Dietetics, Bern University of Applied Sciences, Switzerland
3
Department of Computer Science, University of Fribourg, Switzerland
Keywords: Data Mining, Association Rules, Nutritional Patterns, Knowledge Interpretation, Lifestyle Diseases,
Demographic, Customer Profiles, Disease Diagnosis.
Abstract: Background: To date, the analysis of the implications of dietary patterns on lifestyle diseases is based on data
coming either from clinical studies or food surveys, both comprised of a limited number of participants. This
article demonstrates that linking big data from a grocery store sales database with demographical and health
data by using data mining tools such as classification and association rules is a powerful way to determine if
a specific population subgroup is at particular risk for developing a lifestyle disease based on its food
consumption patterns. Objective: The objective of the study was to link big data from grocery store sales with
demographic and health data to discover critical food consumption patterns linked with lifestyle diseases
known to be strongly tied with food consumption. Design: Food consumption databases from a publicly
available grocery store database dating from 1997–1998 were gathered along with corresponding
demographics and health data from the U. S. west coast, pre-processed, cleaned and finally integrated to a
unique database. Results: This study applied data mining techniques such as classification and association
mining analysis. Firstly, the studied population was classified according to the demographical information “
age groups” and “race” and data for lifestyle diseases were correspondingly attributed. Secondly, association
mining analysis was used to incorporate rules about food consumption and lifestyle diseases. A set of
promising preliminary rules and their corresponding interpretation was generated and reported in the present
paper. Conclusions: Association mining rules were successfully used to describe and predict rules linking
food consumption patterns with lifestyle diseases. In the selected grocery store database, information about
interesting aspects of the grocery store customers were found such as marital status, educational background,
profession and number of children at home. An in-depth research on these attributes is needed to further
expand the present demographical database. Since the search on the internet for demographical attributes back
to the year of 2000 corresponding to the studied population subgroup was extremely laborious, the selected
demographical attributes to prove the feasibility of the study were limited to age groups and race.
1 INTRODUCTION
Lifestyle diseases are diseases that increase in
frequency as countries become more industrialized
and people get more aged. Lifestyle diseases include
obesity, hypertension, heart disease, type II diabetes,
cancer, mental disorders and many others. They differ
from the infectious diseases originated from
malnutrition, also called communicable diseases
(CD) due to their contagious, dispersive nature.
Lifestyle diseases are therefore among the so-called
NC (non-communicable) diseases. According to
World Health Organization (WHO), the growing
epidemic of chronic diseases afflicting both
developed and developing countries are related to
dietary and lifestyle changes (WHO, 2003).
“Food has become commodities produced and
traded in a global market. Changes in the world food
economy are reflected in shifting dietary patterns, for
example, increased consumption of energy-dense
diets high in fat, particularly saturated fat, and low in
unrefined carbohydrates” (WHO, 2003).
Food consumption patterns play an important role
in the health of the people and consequently in the
prevention of lifestyle diseases. These patterns
represent the interplay of all the individual food
choices that describe a complete food pattern. Food
consumption patterns are influenced by many factors
239
Einsele F., Sadeghi L., Ingold R. and Jenzer H..
A Study about Discovery of Critical Food Consumption Patterns Linked with Lifestyle Diseases using Data Mining Methods.
DOI: 10.5220/0005170402390245
In Proceedings of the International Conference on Health Informatics (HEALTHINF-2015), pages 239-245
ISBN: 978-989-758-068-0
Copyright
c
2015 SCITEPRESS (Science and Technology Publications, Lda.)

such as climate, demographics, religion, culture and
many others. For this reason, health concerns are
gaining increasingly on importance for supermarkets,
sporting organizations, health care organizations,
health practitioners and governments. People are
becoming more and more keen on eating healthy,
although they are still mostly unaware of qualities,
limitations and above all of the impact of food
consumption patterns on their health.
The study of nutritional patterns instead of that of
individual food consumption using data mining
techniques has been proposed by various researchers.
Several papers describe the use of pattern recognition
and data mining to extract nutritional patterns. I.P
Hearty et al. propose in (I. P Hearty, 2008) a coding
system at the meal level that might be analyzed by
using data mining techniques. These researchers used
data from a conducted survey. The following authors
in (M. Sulaiman Khan, Maybin Muyeba, Frans
Coenen, 2008) introduced a framework for mining
market basket data to generate nutritional patterns
(NPs) and a method for analyzing generated
nutritional patterns using Fuzzy Association Rule
Mining. The database used by Sulaiman Khan et al.
was a synthetic grocery basket database from IBM
Almaden (R. Agrawal and R. Srikant, 1996). L.
Manikonda et al. in (L. Manikonda, R. Mall, V. Pudi,
2011) focused on an application of mining
questionnaires of such kind to determine the current
knowledge of participants and how this knowledge
improved after the training session. However, these
studies were mainly concentrated in finding
nutritional patterns and did not investigate their
implications on lifestyle diseases. Nikolaos Katsaras
et al. carried out a study described in (J.D. Kinsey, P.
Wolfson, N. Katsaras, B. Senauer, 2001) using a
nationwide survey of consumer preferences. S.
Kumar et al. in (S. Kumar, V. Bishnoi, 2011)
described using some hundred questionnaires in
various Indian cities to assess the consumers’
shopping behavior pertaining to packaged food in
retail and convenience stores. They categorized the
shopping behavior based on their factor analysis
method to 7 dimensions including health conscious
behavior and traditional behavior. J. Harris et al.
reported in (J. M. Harris and N. Blisard, 2002) a study
that aimed at quantifying food expenditures by age
groups and contrast elderly expenditure patterns
with other age groups, test for significant differences
between elderly food-expenditures and younger age
groups, and test for differences in food expenditures
between two elderly age groups (age 65-74 versus
age 75 and over).
N. Habib et al. described in (N. Habib, S. Inam, S.
Batool, S. Naheed and S. Siddiqui, 2013) a study
conducted in Tehsil Kot Addu in the province of
Punjab, Pakistan, the relationship between fast food
and its impacts on the health of citizen. They used
questionnaires and the 140 participating respondents
were selected with the help of simple random
sampling techniques.
Although the studies described above used data
mining techniques for the analysis of the interplay
between health and nutritional patterns are valuable,
they suffer from the drawback that they used a limited
database gained from questionnaires or clinical
studies with limited numbers of participants.
Notwithstanding, we present in this study a novel
approach which aims at investigating the link
between nutritional patterns and lifestyle diseases
using data mining techniques taking into account a
big food consumption database consisting of a
grocery store database. Although the impacts of
nutritional patterns on lifestyle diseases have been
investigated by various researchers, as reported
above, to the best of our knowledge, none of the
previous researchers , aimed to link a big food
consumption database gathered from a vast amount of
customers from grocery stores with demographical
and lifestyle diseases’ data of the same region in order
to discover critical food consumption patterns which
are related to specific life style diseases of the same
region. In addition to this, the gained knowledge to
prevent and predict life style diseases using the food
consumption data is closer to the “food-intake-
reality” of the population than by using data from
questionnaires, surveys and polls. For example in
November 2010 Harris Interactive published the
results of the Harris Poll that surveyed 2,620 adults
online between September 14 and 20, 2010 by Harris
Interactive (Harris Polls, 2010). This Poll found out
that large numbers of people in United States claim to
be changing their foods and drinking habits. Many of
these changes are in line with the guidance provided
by experts, such as eating more fruits and vegetables
and whole grains, and consuming less soda, white
bread and processed food. Over 72 percent of the
interviewed adults claimed to eat a balanced diet and
choose healthy snacks, and almost 80 percent of them
ate healthier meals at home than when dining out. The
results of this poll are in contradiction with the fact
that the US has as an "obesity epidemic" with rapidly
rising numbers of people who are overweight and
obese. There is no good evidence that this trend has
stopped or reversed. Therefore, the data suggest that
many Americans reflect public aspirations and public
knowledge of what they should be doing rather than
HEALTHINF2015-InternationalConferenceonHealthInformatics
240

an accurate report of actual behavior. To summarize,
we believe that using food consumption data from a
big database with lifestyle diseases data leads to
incorporate rules that are firstly more accurate and
secondly can show entirely new and unexpected
relationships between food consumption patterns and
lifestyle diseases compared to data coming from
questionnaires and surveys, since the database has a
much higher degree of granularity (many 10000-
many 1000000 food consumption customers vs. max.
many-1000 interviewed) and reflects more objective
food consumption habits than the “self-claimed”,
”wishing-to-have-behavior” gathered from surveys
and polls.
To gain understanding about the impact of using
data mining techniques for the analysis of lifestyle
diseases that can be influenced by nutrition, we have
decided to conduct a preliminary study on this matter.
As previously stated, we intend to use a big database
gained from a grocery store chain over a certain
period of time. Such a database from Switzerland was
not available at the beginning of our preliminary
study. To show the proof of our concept, we decided
to use a publicly on-line available grocery store
dataset (RecSysWiki, 2012)
Our goal is however to conduct the consecutive
research study with a more up-to-date database
gained from a grocery store chain in Switzerland or
at least from a European country, preferably one with
similar population and demographics and health
patterns as in Switzerland. Notwithstanding, we
believe that regardless of where the grocery store
database has originated, the results of this research
can be novelty and can be applied to other developed
countries in order to obtain the hidden patterns and
the associations between food consumption and the
majority of lifestyle diseases found in such countries.
To name a few, obesity, type II diabetes,
hypertension, various types of cancer, mental,
conduct disorders, and many others can be found.
2 PREPARING DATA
2.1 Selected Databases
2.1.1 Grocery-store Database
As previously stated, we used the Microsoft-
foodmarkt-database (RecSysWiki, 2012). Data were
gathered from a supermarket chain in West coast
USA, see figure 1, in two consequent years (1997-
98). The database contained the following entities:
10’218 customers
165’000 product sales 1998
18’000 product sales December 1998
85’000.product sales 1997
100 sales cities from the states of Washington,
California, and Oregon for the U.S. and British
Columbia for Canada
1500 products
109 product classes (has later been narrowed
down to 40 product classes of interest)
Figure 1: Geographical positions of grocery stores.
2.1.2 Demographical Database
For the sake of consistency, we decided to focus on
the grocery state database from some cities in the
three above-mentioned U.S. states (Washington
(WA), Oregon (OR) and California (CA)). Since
gaining demographic information from the 100 cities
in the database was enormously time consuming, we
decided to choose a smaller number of these cities.
Based on the size and types of the cities, we have
chosen ten different cities in the U.S. west coast: three
large cities with a population of more than a million
including Los Angeles, San Diego and San Francisco
(CA) and two middle cities with a population between
half a million and a million including Portland (OR)
and Seattle (WA), two small cities with a population
between 50000 to 100000 including Palo Alto (CA)
and Spokane (WA) and two rural places with a
population of less than 10000 including Bremerton
(WA) and Bellingham (WA). Such an approach
enabled us to have enough statistical relevance for
this preliminary study. We decided to gather
demographic information from year 2000 from the
(US Census, 2000), assuming that the impact of food
AStudyaboutDiscoveryofCriticalFoodConsumptionPatternsLinkedwithLifestyleDiseasesusingDataMining
Methods
241

intake on people’s health occurs with an approximate
delay of 2-3 years. Our demographic data contained
the following information:
Age groups (9 different age groups): 15-24, 25-
34, 35-44, 45-54, 55-59, 60-64, 65-74, 75-84,
85 and over
Gender. male, female
Races:(4races): White, Latino, African-
American, Asian/Pacific
2.1.3 Lifestyle-diseases Database
We considered for our study the following conditions,
which may be impacted by dietary patterns:
Obesity, sedentary behavior, hypertension, heart
disease, type II diabetes, cancer, mental disorders,
and binge drinking. As previously stated, while
assuming a delay of 2-3 years between the food intake
and its impact on lifestyle diseases, we gathered data
for the above-mentioned health conditions from the
chosen cities in our demographic database in the west
coast U.S. from the year 2000. We then classified the
lifestyle diseases data according to the pre-defined
classes in the demographic database, i.e. age groups
and races. Data were gathered from the official
health-related websites of the selected states and from
various health organizations sources (13, 14, 15, 16,
17, 18, 19, 20, 21, 22, 23, 24, 25, 26, 27 and 28).
Linking lifestyle diseases data with gender proved to
be a challenge; we therefore did not consider gender
in the data-mining task of our study.
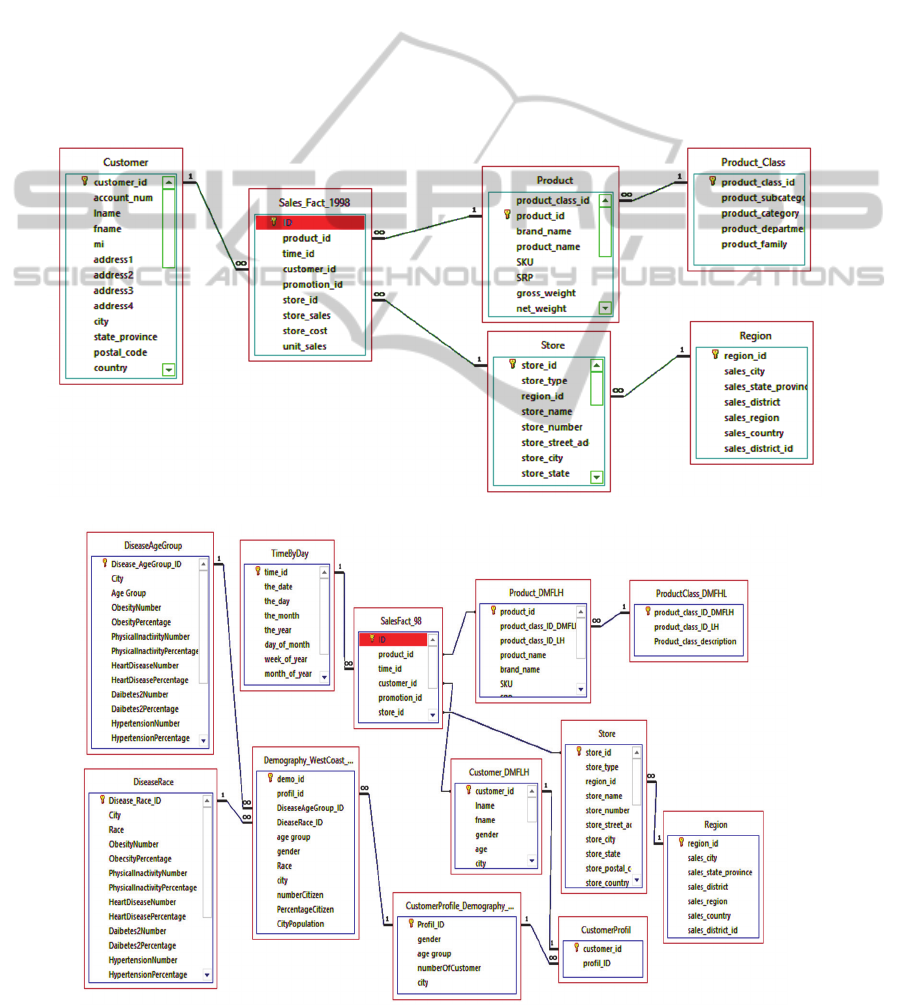
2.2 Cleaning and Integration of
Databases
2.2.1 Cleaning Grocery-store Database
The selected grocery-store database (RecSysWiki,
2012) has approximately 20 tables. Not all of them
are relevant for this preliminary study, as they contain
information about the store’s inventory, employees,
salaries, positions, etc. Such tables have been
therefore omitted in this study. In addition to this, the
product’s table contained 1500 products and its
relationship to the product-class table, that contained
120 product classes, was based on supermarket-chain
marketing criteria, not on nutritional criteria.
Therefore, we have redefined the product class
criteria and reduced it from 120 to 40 product classes
according to the European Food Safety Authority
(EFSA, 2014). We then have built new relationships
between the 1500 products and the new built product
class table. Figure 2 in the last page shows the cleaned
scheme of our grocery-store database.
2.2.3 Building an Integrated Database
The resulted grocery-store database in figure 2
contains food consumption information about the
individual customers whereas for this preliminary
study, we were able to gather demographic and health
data for pre-defined classes age group and races. In
order to link the grocery-store-database with the
demographic and disease database, we have created
linking tables containing customer profiles classified
by age groups, races and cities. We then added the
linking tables and the demographic and disease tables
to the grocery-store database and defined the
relationships. Figure 3 in the last page shows the
scheme of the resulted integrated database.
3 SELECTED METHODOLOGY
Discovering information from data has two major
forms: descriptive and predictive analysis. Generally
speaking, data mining is used to simplify and
summarize the data to understand them, and then to
allow inferring rules about specific cases based on the
observed patterns.
In data mining, different methods and techniques
can be used to discover the patterns. We can
categorize data mining tasks in three main categories:
classification, association rule mining, clustering.
Data mining is a multidisciplinary field, which has
adopted techniques from various research domains
including machine learning, statistics and
visualization techniques.
3.1 Our Data Mining Approach
For our dataset, we have used the descriptive form of
data mining and applied the following data mining
approaches.
3.1.2 Classification
As we previously stated in the section about selected
database, we were only able to gather demographical
data for two classes: age group and races. Hence, we
have assigned our lifestyle diseases data into these
two pre-defined demographical classes. Therefore,
we gained different customer profiles associated with
the predefined age group and races.
3.1.3 Association Rule Mining
To discover relations among attributes belonging to
food consumption, demographical and lifestyle
HEALTHINF2015-InternationalConferenceonHealthInformatics
242

diseases in our integrated database, we used the brute
force method, i.e. we did the following calculation:
We summed up the sales per year for each product
class for every predefined customer profile. To gain
association rules with high fraction of relevance, we
tried the following pruning approach: we divided the
sum of yearly sales for each product class for each
customer profile to 3 times the calculated average of
the yearly sales of each product class for each
customer profile. In order to prune out the less
relevant results, we decided to set a threshold between
0.7 (i.e. 70%) and 1 (i.e. 100%). We named this
threshold the “critical-buy-index”.
This method ensured us to keep the most relevant
sales for each product class linked with each
predefined customer profile. After pruning out the
less relevant critical buy indexes (i.e. less than 0.7),
we finally searched for life style diseases that
corresponded to the same customer profile and were
able to incorporate interesting relationships that we
called rules.
3.2 Results and Their Interpretation
Rule 1: 25-34 years old from Los Angeles show the
highest critical buy index for confectionary, salt
containing, and high sodium content-products among
all age groups from the same region, and tend to have
a sedentary behavior as well as frequent binge
drinking episodes.
Interpretation: This age group displays
consumption and lifestyle behaviors that should be
addressed as part of focused health promotion
initiatives.
Rule 2: 65-84 years old from Los Angeles show
critical buy indexes of savory snacks and ready-to-eat
products, both susceptible to contain high sodium
levels. This group shows the highest hypertension
and heart disease rates among all age groups as well
Interpretation Salt consumption behavior among
this age group needs to be addressed in an effort to
decrease cardiovascular disease rates.
Rule 3: age groups 25-34, 45-54, 55-59 and 75-
84 in Spokane show a critical buy index for purchased
red meat.
Interpretation: Due to undissolved percentage
rate of diseases by age groups in Spokane, this data
cannot be linked to specific diseases.
Rule 4: Critical buy indexes for pasta, bakery
wares, rice and sugar has been noted among all age
groups in Spokane
Interpretation: This may be associated with the
generally high rates of obesity in Spokane.
Rule 5: A negative correlation was surprisingly
noted between high support and confidence rate of
obesity and low support and confidence rate of
sedentary behavior in Spokane.
Interpretation: A further investigation revealed
that Spokane has an anchored sport culture, which
could partially explain the rather low sedentary
activity among its residents.
Rule 6: The significantly high critical buy index
for alcohol beverages is directly linked with a high
percentage of binge drinking in Spokane among all
age groups.
Interpretation: Measures to prevent binge-
drinking behavior among all age groups in this region
should be established.
Rule 7: Caloric beverages with some nutrients
show critical buy indexes among all age groups in
Spokane.
Interpretation: Caloric beverages may
contribute to the high prevalence of obesity.
Preventive public health measures should tackle this
issue.
Rule 8: 65-84 years old from Spokane show a
significantly high critical buy index of savory snacks
and ready-to-eat products, both products susceptible
to contain high sodium levels. This age group shows
the highest hypertension incidence as well.
Interpretation: Preventive measures to reduce
sodium intake among this age group may contribute
to decrease hypertension rates.
4 CONCLUSIONS AND FUTURE
WORK
The present study has shown a novel approach by
linking data sources of a grocery basket database to
demographical and health statistics to address the
influence of food consumption patterns on lifestyle
diseases such as obesity, hypertension, cardio-
vascular diseases, cancer, type II diabetes and mental
disorders. Further the link between food consumption
patterns and both sedentary behavior and binge
drinking has been the subject of the investigation.
According to the World Health Organization (15),
“lifestyle diseases are among the main causes of
premature death and disability in industrialized
countries and in most developing countries.
Developing countries are increasingly at risk, as are
the poorer populations in industrialized countries “.
The promising rules and their interpretation
gained in this study that show the immense potential
of our approach is twofold: First the interplay of these
AStudyaboutDiscoveryofCriticalFoodConsumptionPatternsLinkedwithLifestyleDiseasesusingDataMining
Methods
243

three databases by using data mining tools such as
classification and association rules is a sophisticated
approach to predict and describe the risk of lifestyle
diseases when liked with food consumption patterns
in a big database for a specific population belonging
to a demographical subgroup. Furthermore since this
study uses a large food consumption database, the
incorporated rules are by far more realistic than rules
that have been incorporated by using food
consumption data from interviewers in survey,
questionnaires or polls, since these data retrieval
methods have the unfortunate disadvantage that the
interviewers claim their wishful thoughts rather than
their daily food consumption facts.
In fact, our demographical and health data do not
possess the level of distinctive accuracy we aimed for
in order to link these patterns with specific age groups
and races among different geographical areas of the
U.S. west coast. Since such a thorough research on
the internet back to the year of 2000 revealed itself a
laborious one, we have chosen two demographical
attributes, age group and race, in order to demonstrate
the feasibility of our concept.
Furthermore, one limitation of our study consists
of focusing on data from customers of a specific
grocery chain. This might create bias in the outcomes
and therefore the rules produced. Further research is
needed to explore the grocery shopping patterns of
customers based on multiple grocery chain stores.
In the section of data mining and knowledge
interpretation, we have listed some preliminary
interesting rules along with a corresponding
interpretation.
In epidemiology, disease incidence and
nutritional behavior could be combined to assign
population attributable risks. In data mining, these
risks are detected because of the combination of huge
databases, which are linked by foreign keys. Risks
assigned to the population could be checked for
individuals by comparing the individual’s profile to
the pre-defined population risk patterns. Thus, typical
profiles related to high disease risks as a result of a
nutritional behavior could be collected and be made
available to dietitians as checklists to facilitate the
detection of those patients and clients who are at risk.
For our future work, we intend to gather more
actual and precise data coming preferably from a
grocery chain in Switzerland or Europe. Our
cooperation with the health institutes in Switzerland
and in the European countries will be essential to
receive accurate demographical and health data,
which should help us derive interesting and possibly
novel hidden patterns. Our ultimate goal is to find
valid rules in order to be able to predict and prevent
lifestyle diseases by detecting critical food
consumption patterns. Data mining is an enormously
mighty technique that allows us to help reach our goal
without the common limitations of the previous
research efforts, which used the classical statistical
hypothesis-bound methods.
REFERENCES
WHO, World Health Organization Geneva 2003, Diet,
Nutrition and the Prevention of Chronic Diseases,
Report of a Joint WHO/FAO Expert Consultation.
I. P Hearty and M. J Gibney, 2008, Analysis of meal
patterns with the use of supervised data mining
techniques artificial neural networks and decision trees,
88:1632–42. American Society for Nutrition.
M. Sulaiman Khan, Maybin Muyeba, Frans Coenen, 2008,
On Exraction of Nutritonal Patterns (NPS) using Fuzzy
Association Rule Mining, Healthinf 2008.
R. Agrawal and R. Srikant, 1996, Quest Synthetic Data
Generator, IBM Almaden Research Center.
L. Manikonda, R. Mall, V. Pudi, 2011, "Mining Nutrition
Survey Data", SSCI 2011, CIDM 2011, Paris, France.
J.D. Kinsey, P. Wolfson, N. Katsaras, B. Senauer, 2001,
Data mining A segmentation analysis of US grocery
shoppers, Working paper (Univer -sity of Minnesota.
Retail Food Industry Center), 01-01.
S. Kumar, V. Bishnoi, 2011, Indian Consumer Food
Shopping Behaviour and their Choice & Preference for
Packaged Food and Food Retailers, an Exploratory
Study, Proceedings for 2011 International Research
Conference And Colloquium, Contemporary Research
Issues and Challenges in Emerging Economies.
J. M. Harris and N. Blisard, 2002, Food -Con-sumption
Patterns among Elderly Age Groups.
N. Habib, S. Inam, S. Batool, S. Naheed and S. Siddiqui,
2013, Nutritional Pattern and its Impact on the Health:
A Case Study of Tehsil Kot Addu, Punjab, Pakistan,
International Journal of Humanities and Social Science,
Vol. 3 No. 10,Special Issue, May 2013.
Harris Polls, 2010, http://www.harrisinteractive.com
/NewsRoom/ HarrisPolls/tabid/447/ctl/
ReadCustom%20Default/mid/1508/ArticleId/614/Defa
ult.aspx.
RecSysWiki, 2012, http://recsyswiki.com/wiki/ Grocery_
shopping_datasets.
US Census, 2000, http://www.census.gov/ces/
dataproducts/ demographicdata.html.
http://www.publichealth.lacounty.gov.
http://www.cancer-rates.info/ca/index.php.
http://sandiegohealth.org/disease/diabetes/
diabetes2001.pdf.
http://www.cdph.ca.gov/pubsforms/Pubs/
OHIRmentalhealthCareCA2001.pdf.
http://www.healthysf.org/bdi/determinants/ hypertension/
http://www.sdcounty.ca.gov/hhsa/programs/
http://adai.washington.edu/pubs/ infobriefs/ ADAI-IB-
2004- 06.pdf.
HEALTHINF2015-InternationalConferenceonHealthInformatics
244
https://fortress.wa.gov/doh/wscr/WSCR/PDF/02REPORT/
CancerByCounty02.pdf.
http://www.doh.wa.gov/portals/1/ Documents/ Pubs/345-
271- ChronicDisease ProfileSpokane.pdf.
http://public.health.oregon.gov/DiseasesConditions/Chronic
Disease/HeartDiseaseStroke/
Documents/2006Heart
DiseaseRpt.pdf
N.Ikeda, D. Sapienza, R. Guerrero, W.
Aekplakorn, M. Naghavi, Ali H Mokdad, R. Lozano,
C. JL Murray & S. S Lim, Control of hypertension with
medication: a comparative analysis of national surveys
in 20 countries, Bulletin of the World Health
Organization, 2014; 92:10-19C
U.S. Cancer Statistics Working Group, United State Cancer
Statistics 2004 Incidence and Mortality
www.lapublichealth.org, County of Los Angeles,
Department of health, Obesity on the Rise, July 2003
D. J. Reynen, A. S. Kamigaki, Nan Pheatt,
L. A. Chaput, The Burden of of Cardiovascular Disease in
California, July 2007
L.A.Health, Physical Activity Among Adults in Los
Angeles County, November 2000,
www.lapublichealth.org
H. Lee, Obesity Among Racial and Ethnic Differences,
Copyright © 2006 by Public Policy Institute of
California
EFSA, 2014, http://www.efsa.europa.eu/en/datex/
datexfoodclass.htm.
APPENDIX
Figure 2: Scheme of the cleaned Grocery-Store database
Figure 3: Scheme of the Integrated Database
AStudyaboutDiscoveryofCriticalFoodConsumptionPatternsLinkedwithLifestyleDiseasesusingDataMining
Methods
245
