
A Discrete Event Simulation Model to Support Bed Management
Paolo Landa
1,2
, Michele Sonnessa
1
, Elena Tànfani
1
and Angela Testi
1
1
Department of Economics and Business studies, University of Genoa, Via Vivaldi 5, Genoa, Italy
2
Agenzia Regionale Sanitaria Liguria, Genova, Italy
Keywords: Health Care Services, Bed Management, Discrete-Event Simulation.
Abstract: In recent years, due to the overcrowding of Emergency Department (ED) and the growing concern in
reducing the number of inpatient ward beds, it has become crucial to improve the capacity planning and
control activities, which manage the patient flows from EDs to hospital wards. Bed Management has a key
role in this context. This study starts by a collaboration with the Local Health Government (LHG) of the
Liguria region aimed at studying the impact of supporting bed management with some operational strategies
without increasing the bed capacity. A large amount of data was collected over a one-year period at public
hospital in Genova and a preliminary observational analysis was conducted to get the main information
about the flow of emergency and elective patients from ED to inpatient wards. A Discrete Event Simulation
(DES) model has been then developed in order to represent the real system. A scenarios analysis is proposed
to assess the best strategy to improve the system performance without increasing bed capacity, by simply
synchronizing bed supply and demand. The model can be used as a decision support tool to optimise the use
of the available resources as well as to improve the quality of the patient pathway inside the hospital.
1 INTRODUCTION AND
PROBLEM ADRESSED
In recent years, in order to increase clinical
outcomes and citizens’ satisfaction, there has been a
growing concern to reduce overcrowding in
Emergency Department (ED). Two main
interventions are usually suggested (Bagust et al,
1999). Firstly, reducing the number of patients
which inappropriately addressees the EDs. Secondly,
facilitating early discharges from inpatient wards to
facilitate on time emergent admissions in inpatient
departments.
In Italy, regional decision makers tackled the
first intervention encouraging general practitioners
to give appropriate pathways for their patients, by
giving more non-hospital options available and
imposing a co-payment for non-appropriate
admissions. Indeed in one year access to ED has
been reduced by about 1 million (Agenas, 2012). In
spite of that, EDs are always overcrowded. This is
mainly due to both a public budget unbalance and
the reduction, in the same period, of the number of
inpatient ward beds available, which has been
reduced drastically, from 6.1 to 4.3 per thousand
population in ten years ranking below the European
average (Istat, 2011).
Nowadays hospitals are focusing on the second
intervention trying to facilitate early discharges from
inpatient beds and get more beds available for
emergent patients to be admitted. This entails to
recognize that the so-called “ED problem,” is
actually a “system problem”. ED is simply a step in
the patient flow through the hospital and increasing
capacity in the ED without facilitating a smooth exit,
can worsen the problem (IHI, 2003). In the past the
problem has been already addressed extensively in
many health systems, mainly North American and
UK (Audit Commission, 1992; Audit Commission,
1993; IHI, 2003). A solution suggested is the
introduction of the so-called Bed Manager (BM). It's
main task is to report at given interval time slots
during the day the volume, census, and occupancy
rates of the available ward stay beds in order to
synchronize the expected discharges, i.e. bed supply,
with the expected admissions from ED, i.e. bed
demand, (Haraden et al., 2004).
The BM is not a new concept. Indeed, twenty
years ago, it has already been defined as the way of
“keeping a balance between flexibility for admitting
emergency patients and high bed occupancy, which
901
Landa P., Sonnessa M., Tànfani E. and Testi A..
A Discrete Event Simulation Model to Support Bed Management.
DOI: 10.5220/0005161809010912
In Proceedings of the 4th International Conference on Simulation and Modeling Methodologies, Technologies and Applications (HA-2014), pages
901-912
ISBN: 978-989-758-038-3
Copyright
c
2014 SCITEPRESS (Science and Technology Publications, Lda.)

is an indicator of good hospital management” (Green
and Armstrong, 1994).
The bed manager function has been proved to be
effective. For instance, Howell et al. (2008) report
an increase of the ED throughput, substantially due
to the reduction of about 25% (approximately one
hour and half) of the time spent inside ED. This
effect was still larger in transferring patients from
ED to Intensive Care Units (Howell et al., 2010).
Efficient patient throughput, however, requires a
high degree of coordination and communication
among the different staff and health care facilities
involved. The control of the whole set of patient
flows, is obviously possible only with the help of an
on-line system able to identify earlier information
about pending admissions to the acute beds available
(Tortorella et al., 2013). This can be done, for
instance, visualizing the on time patient flows by
means of a tool which collects and filters the
information from the ED and inpatient ward thus
supporting hospital bed managers in their daily
decision making (Jensen et al., 2012).
Of course BM should be supplemented by other
techniques generally intended to reduce the patient
flows variability inside the hospital, developing all
activities and tools to allow supply matching
demand in a dynamic situation. Many operations
research and management science methods such as
queuing theory, supply chain models, optimization
and simulation, can be used study this problem. In
fact, the analysis of patient flows and clinical
pathways are a key issue in the recent operational
research literature (see, for instance, Vanberkel et al,
2009; Vissers et al., 2005). In addition, many other
methods from industrial and business process
modelling have been also used, such as lean health
care or six sigma (Young et al., 2004).
Health Foundation (2013) provides an extensive
collection of empirical research studies aimed at
improving patient flow across pathways, not only
through BM. From the analysis of the literature it
appears that the scope, responsibility and role of bed
manager is not clearly defined and it is actually
rather different in practical applications: medical,
nursing or managerial staff can perform the bed
manager function and even tasks or levels may be
different (Proudlove et al., 2007). The non-existence
of standards of bed management practice is taken to
reflect a lack of systematic attention paid to this role
(Boaden et al, 1999). In the operative scenario of the
Italian Health System herein studied, the bed
management has been only recently introduced in
hospitals and no systematic results are until now
available (Simeu, 2011).
This study starts by a collaboration with the
Local Health Government (LHG) of the Liguria
region aimed at studying the impact of supporting
bed management with some operational strategies
without increasing the bed capacity. At least to the
authors knowledge, this is the first attempt to give
some quantitative insights in this field.
The specific objective of this paper is to develop
a Discrete Event Simulation (DES) model to study
the interrelation of the flows of emergent and
elective admissions into inpatient departments and
show how the model can help in supporting the bed
management decisions. The advantage to use a DES
model is mainly related to its ability to give a deep
analysis of the dynamic flows of patients throughout
different time windows. It is not sufficient to
consider the average distribution pattern. Capacity
and demand may match on average, and it may look
as though the system ought to flow smoothly.
However, even when capacity and demand match on
average, the degree of variation in the timing of the
patient arrivals (demand) and the ability of beds to
absorb that demand can results in admission delays
and cancellations.
Simulation has been already utilized in bed
management literature. Bagust (1999) applies a
stochastic simulation model to determine which is
the optimal level of spare capacity in presence of
flows by their nature stochastic and difficult to
predict, resulting in 85% bed occupancy at most.
Harper et al. (2002) utilize a DES model not only to
manage but also to plan the bed capacity, with
particular regard to the trade-off between bed
occupancy and refusals. Schmidt et al. (2013)
implement a DES model to assess a decision support
system for bed management in a context where there
is inherent uncertainty in length of stay and ED
patients to be admitted.
In this paper, we focus on studying the flow
variability in order to manage the on-line decisions
to be taken at a given set of time windows. The
effect of different BM rules is evaluated by means of
a set of performance indexes. They are chosen to
take into consideration both the hospital point of
view (bed occupancy, turnover interval, additional
beds) and the patient point of view (misallocation,
cancellations of elective admissions already
scheduled, excessive waits). The BM rule are
defined assuming a flow process where emergent
patients are “pushed” through the system from the
ED to the acute wards and “pulled” towards
anticipated discharge (Proudlove et al., 2003).
The paper is organized as follow. In Section 2 the
description of the simulation model structure and
SIMULTECH2014-4thInternationalConferenceonSimulationandModelingMethodologies,Technologiesand
Applications
902

performance metrics to be used for the analysis are
given. In Section 3 the case study is introduced
together with the data collection and analysis
performed with the collaboration of the Local Health
Government (LHG) of the Liguria region. Section 4
is devoted to the model validation and experiment
settings, while in Section 5 the preliminary results of
the scenarios analysis tests are given. Conclusions
and future direction of the research end the paper.
2 SIMULATION MODEL
DESCRIPTION
The main aim of the model herein developed is to
study the interrelation and synchronization of the
patient flows between an emergency department and
a set of inpatient hospital wards. A discrete-event
simulation model has been developed adopting a
patient-centred approach. From an operational point
of view, this means considering the patient
characteristics regarding their clinical need (medical,
surgical, orthopaedics or others) and the timing of
the care process from their entrance into the system
until their exit.
The overview of the system under study, main
elements and patient flows involved is reported in
Figure 1.
Both emergent and elective patients flow across
the system made up of one ED and a given set of
hospital inpatients wards.
Hospital wards are divided into a set of n groups
(in the case study reported in Section 3 they are:
medical, surgery, orthopaedic and other wards).
Emergent patients exiting from the ED with a
decision to admit and the elective ones compete for
the same beds available in the wards. The elective
patients are previously registered in a waiting list
and the date of admissions is fixed a priori. This
means that this flow can be controlled and indeed
this can be a way to smooth the demand for beds.
Obviously, emergent patients can be admitted into a
ward if and only if there is a free bed available. Note
that for both emergent and elective patient arrivals, a
detailed shift pattern is created to simulate the
different arrival distribution during the day and
week. For each emergent patient who arrives in the
system four attributes are generated. The attribute
“to_admit” can assume the value 1 or 0, if
respectively, the patient must be admitted into an
hospital ward and 0 if is discharged. The Attribute
“ward” gives the ward where the patients to be
admitted should be allocated. The “Time_in_ED” is
the time spent by the patient within the ED. These
attributes are generated with different distributions
depending on the slot time of arrival. Besides, for
both elective patients and emergent to be admitted,
the Length of Stay (LOS) is also generated with a
different pattern depending on the type of patient
(emergent or elective) and the ward they are
assigned to. When the elective patients have spent in
the emergency department their “Time_in_ED”,
they become ready and are then processed by a
machine which verifies if they must be admitted into
a hospital ward or not. In the positive case they are
pushed into one of the buffers “To_be_admitted”
depending on the ward they are assigned to.
Afterwards at a priori determined time windows
during each day the “bed manager”, verifies the
consistency of available ward beds and decides the
emergent patients allocation to them. The number of
beds available in each ward is known as well as the
average number of elective arrivals during the
following time slots in the same day as well as the
transferrals of patients among inpatient wards. After
the admission the patients stay in the inpatient ward
accordingly to the assigned “LOS” attribute.
Different rules and levels of timing and look
ahead policies can be applied to simulate the bed
manager decisions. The set of performance metrics
used to test and compare the impact of different BM
rules and hospital ward organizational strategies is
reported in the next section, while the preliminary
results of the scenario analysis performed are given
in Section 5.
2.1 Performance Metrics
The impact of applying alternative bed management
rules is assessed by means of the following main
indicators:
1. Misallocation index: percentage of patients
admitted in a ward different from the one assigned to
them at the ED decision to admit. In a baseline
scenario patients can be placed in the first available
bed, but this is not always appropriate. It is
important, for instance, to limit the number of
medical ward beds occupied by surgical patients
and, vice versa. (Audit commission, 1993).
2. Average number of patients waiting to be
admitted for each ward, time slot/day (additional
beds or trolley in ED)
3. Waiting times before admission for emergent
patients into inpatient wards. Note that national
guidelines give a maximum time of 4 hours for UK
Proudlove et al., 2003) and 8 hours in Italy (Simeu,
2011).
ADiscreteEventSimulationModeltoSupportBedManagement
903

Figure 1: Overview of the system and flows of patients under study.
4. Number of elective patients postponed for the
unavailability of a free bed in the day a priori fixed
for their admission .
5. Bed utilization rate: bed occupancy of stay beds
for each ward (total, emergent and elective ones).
3 CASE STUDY
Our case study refers to a large hospital in the city of
Genova. The data has been provided by the Local
Health Government of Liguria (Agenzia Regionale
Sanitaria). In 2012, the number of patients arrivals at
the ED was 84,781. As shown in Table 1,
approximately one out of four (24.7%), i.e. 20,942,
were subsequently admitted to an inpatient ward. In
the same period 24,696 elective patients were
admitted into the same wards.
The total number of beds available in the wards
is 1256, distributed among 79 wards. The wards
have been grouped into four main groups, i.e.
Medicine, Surgery, Orthopaedics and other wards,
respectively. For each ward group the number of
beds available, the average time spent in the ED and
the average length of stay are reported.
SIMULTECH2014-4thInternationalConferenceonSimulationandModelingMethodologies,Technologiesand
Applications
904

Table 1: Case study descriptive analysis.
# of ED admissions
84,781
% discharged without admissions (75.3%)
% transferred to inpatient wards (24.7%)
# of inpatient ward admission
45,638
elective 24,696
coming from ED 20,942
Average time spent in ED (in hours)
patients discharged without admission 2.92
patients transferred to inpatient wards 4.45
Average LOS (in days)
Medicine 3.14
Surgery 6.87
Orthopaedics 9.00
Other 8.73
# of ward beds
1,141
Medicine 332
Surgery 157
Orthopaedics 80
Other 569
3.1 Data Collection and Analysis
During a one year period, January 2012- December
2012, data have been collected from two database
sources which refer to the flow of patient within the
emergency department and hospital wards,
respectively. From the first, we get the day and time
of arrival and the exit decision from the ED (to be
admitted into an hospital ward or not). From the
second, we collected for both elective and emergent
patients the date and time of admission; the ward of
admission, the eventual transferral information to
other wards and the date and time of discharge from
the hospital.
A deepest analysis has been devoted to estimate
the inter-arrival and service rates for both emergent
and elective patients. They are, apparently, very
variables. Indeed, there is a large difference in
arrivals between weekdays and weekends, working
and resting time. Their variance, however, can be
reduced when particular time slots are considered.
Therefore, with the help of the medical staff 42 time
slots have been chosen to cover each week time
period (Table 2).
For each emergent patient the value of the
attribute “ward” has been generated using the
empirical distribution reported in Table 3.
In Figure 2 the overall trend of patient flows
during the 42 slots time is given. In particular, for
each timeslot the number of patient discharged and
Table 2: Time slots and shift pattern.
Slot Day Time Slot Day Time
1 Mon 0-7 22 Thurs 13-16
2 Mon 7-10 23 Thurs 16-19
3 Mon 10-13 24 Thurs 19-24
4 Mon 13-16 25 Fri 0-7
5 Mon 16-19 26 Fri 7-10
6 Mon 19-24 27 Fri 10-13
7 Tues 0-7 28 Fri 13-16
8 Tues 7-10 29 Fri 16-19
9 Tues 10-13 30 Fri 19-24
10 Tues 13-16 31 Sat 0-7
11 Tues 16-19 32 Sat 7-10
12 Tues 19-24 33 Sat 10-13
13 Wed. 0-7 34 Sat 13-16
14 Wed. 7-10 35 Sat 16-19
15 Wed. 10-13 36 Sat 19-24
16 Wed. 13-16 37 Sun 0-7
17 Wed. 16-19 38 Sun 7-10
18 Wed. 19-24 39 Sun 10-13
19 Thurs 7-10 40 Sun 13-16
20 Thurs 10-13 41 Sun 16-19
21 Thurs 13-16 42 Sun 19-24
Table 3: Emergent patients ward admissions.
Ward Group %
Medicine 62.47
Surgery 4,80
Orthopaedics 5,93
Other 26,80
admitted is given. The number of patients admitted
is also splitinto emergency and elective flows.
These flows represent for each slot the supply of
beds, which consists of the patients discharged that
are leaving a bed free for a new admission, and the
demand for ward beds, composed by emergent
patients to be admitted from the ED and elective
patients already scheduled to be admitted into
inpatient wards.
A grayed area also highlights the internal flow of
patient transferred from one ward to another. It does
not affect the admission/discharges flows but has a
significant impact over ward occupancy rates. Two
main remarks can be outlined. The most of the
discharges are concentrated in the days before the
weekend, while the admissions are mainly
concentrated in the first days of the week. This
effect is mainly due to the internal hospital
organization and can have great impact over the bed
occupancy flows and allocation. Looking at the
internal distribution of arrival flows it is clear how
the elective patients are admitted on regular
frequency, mostly at the beginning of the week,
ADiscreteEventSimulationModeltoSupportBedManagement
905

Figure 2: Distribution of inpatient ward input-output flows.
Figure 3: LOS distributions (in days) in the inpatient wards- elective patients.
while emergent ones are more equally distributed.
This phenomenon is quite reasonable and must be
taken into account to effectively plan the bed
allocation. Discharges are distributed in three slots
(i.e. 7_10, 10_13, 13_16). The most of discharges
are placed in the last slot of the day (13-16), just
after the launch and after the ward rounds.
Figure 3 and Figure 4 show the distribution of
the length of stay (LOS) for each ward, for elective
and emergent patients, respectively. On the x-axis,
the length of stays in days are represented, while on
y-axis the % of patients is reported for each ward
where they have been admitted.
The largest number of emergent patients exits
the ED with a decision to be admitted into one of the
medicine wards and their stay is quite short (the
largest number remain for no more than 3 days). The
elective patients are more equally distributed over
different wards, in fact the most stay in the “other”
group which contains all the wards but medicine,
orthopaedics and surgery. The average length of stay
is greater in this case. More elective patients are
admitted into surgery wards with respect to the
emergent ones and the length of stay is on average
greater.
The data analysis highlights some phenomena
which can be addressed by the model to simulate
different bed manager rules (i.e. decision about the
ward where an emergency patient should be
admitted) and hospital organizations (i.e. slots and
frequencies of patients discharge and elective
admissions).
0
10
20
30
40
50
60
70
80
0_7
7_10
10_13
13_16
16_19
19_24
0_7
7_10
10_13
13_16
16_19
19_24
0_7
7_10
10_13
13_16
16_19
19_24
0_7
7_10
10_13
13_16
16_19
19_24
0_7
7_10
10_13
13_16
16_19
19_24
0_7
7_10
10_13
13_16
16_19
19_24
0_7
7_10
10_13
13_16
16_19
19_24
Monday Tuesday Wednesday Thursday Friday Saturday Sunday
Transferred Elective admissions Emergent admissions Discharged
0%
5%
10%
15%
20%
25%
30%
1234567891011121314151617181920
Other Surgery Medicine Orthopaedics
SIMULTECH2014-4thInternationalConferenceonSimulationandModelingMethodologies,Technologiesand
Applications
906

Figure 4: LOS distributions (in days) in the inpatient wards - emergent patients.
4 MODEL VALIDATION AND
STEADY STATE CONDITIONS
The DES model has been implemented using the
simulation software environment Witness (Witness,
2013) and has been be validated to ensure that the
simulation outputs adequately represented the real
data of the system under investigation by adopting
appropriate statistical tests (Law, 2007). There are
numerous techniques for validating a simulation
model; some of them are based on subjective
graphical analysis, some others on mathematical
statistics to obtain quantitative data about the quality
of the simulation model.
Firstly, the model validation has been performed
to verify if and to which extent the model is able to
represent the real flows of elective and emergent
patients within the system under investigation.
Referring to the logic and rules implemented to
simulate the bed manager decisions a face validation
(Law, 2007) has been firstly performed with the
hospital managers and clinicians which gave us
many insights to adapt the model to the current
practice and render it a truer representation of the
real system. Besides, the simulation outputs have
been compared to the real data using a classical
parametric statistical test, i.e. the T-test (Law, 2007).
In particular, we compared two output measures,
i.e. number of emergent patients to be admitted and
number of total patient admissions (for each
inpatient ward). Note that the last metric includes the
emergent and elective admissions as well as the
transferrals among different inpatient wards. The
simulated output measures were obtained through 20
IID replications and then compared against the same
real measures for the reference time period, i.e. one
year. We decided to test the null hypothesis H
0
under a probability of rejecting the model fixed to
the
=0.05 level. The corresponding critical value of
the test is t
n-1,1-/2
= t
19, 0.975
= 2.093; from Table 4 we
can see that t
(19)
2.093 for all values and hence our
simulation model has been proved to represent the
real behaviour with a low probability of error.
Table 4: Comparison between real data and simulated
output.
# of emergent admissions
W1 W2 W3 W4
Real measures
12349 948 1173 5299
Simul. outputs
12382 954 1162 5321
o
p
t
0.27% 0.63% 0.94% 0.42%
T-test (t
24
)
1.932 2.065 2.088 1.989
Since the aim of our simulation study is to derive
a set of performance indices able to evaluate the
efficiency of the system under study, it is important
to choose the conditions under which a steady state
behaviour in the simulation is reached (Law, 2007).
To obtain the steady state conditions we have
used the batch means method, based on a single run
of data collection, which has been divided into 10
batches. The decision of using 10 sampling batches
is due to the results of the initial experimentation
0%
5%
10%
15%
20%
25%
30%
35%
40%
1 2 3 4 5 6 7 8 9 10 11 12 13 14 15 16 17 18 19 >20
Other Surgery Medicine Othopaedics
ADiscreteEventSimulationModeltoSupportBedManagement
907

with the simulation model, that revealed a relatively
small variance in the system output.
The first run begun at time t
0
= 0 corresponding to
the empty initial state of the system; therefore, a
preliminary simulation time was needed to clean out
the transient simulation period. After this initial
warm-up fixed to 90 days, we reset the statistics of
the model and run it starting by the new initial time
t
0
=2160 (hours) until the ending time condition
t
f
=88560, so that each batch represents 360 days of
steady-state simulation. The results presented in the
next section are the average of the performance
indices sampled for the 10 batches.
5 SCENARIOS ANALYSIS AND
PRELIMINARY RESULTS
Once validated, the discrete event simulation model
has been used to analyze the effects on system
behavior of different bed management rules and
inpatient ward organization and verify their
effectiveness to face the bed allocation problem.
For the output analysis we used the set of
performance metrics reported in Section 2.1 which
allow to assess the performance of the system from
both the patient point of view (waiting time before
admission and elective admission postponements)
and the hospital point of view (bed utilization rate
and misallocation indexes).
Three set of scenarios and related results are
herein presented (Table 5).
In the first set of scenarios (Scenarios 0-3) the
system rules of the bed management are modified
with respect to the number and timing of the
evaluation of available beds and ability to look
ahead. In particular, in the baseline scenario
(Scenario 0) the bed manager simply verifies, for
each emergent patient to be admitted in the inpatient
wards, if there is a free bed available in the ward
assigned to her/him, if not it checks the bed
availability in the other wards and when it finds a
free bed sends the patient to the first ward with a
free bed available even if misallocated. Including the
“timing” characteristic (Scenario 1) gives the bed
manager the ability to postpone at most 4 times the
assignment of a patient to a “wrong” ward in order
to verify if after a short time (usually half an hour)
some beds will be available. The number of times
the BM can postpone its decision as well as the
period between the re-evaluations are also key
parameters. In the preliminary tests herein presented
they are set at 4 re-evaluation, every 30 minutes, i.e.
at least the bed manager can postpone its decision to
admit for 2 hours. The ability to long-ahead
(Scenario 2 and 3) allows the BM to consider in
each time slot not only the number of beds available
but also the expected number of elective patients to
be admitted during the day.
Table 5: Scenarios analysis.
Scenario
Bed
manager
timing
Bed
manager
look
ahead
Elective
admiss.
blocking
New
discharge
policy
Scenario0
Scenario1
x
Scenario2
x
Scenario3
x x
Scenario4
x x x
Scenario5
x x x
In the second series of results (Scenario 4 and 5)
the idea is to block (not schedule) or reduce the
elective admission during the days and slots where
peaks in the ED admissions are expected, for
instance on Monday, slot 7-10, (see Figure 2 and
Figure 5). These is scenario tries to manage the
inpatient demand flow in order to smoothing the
flow of emergent patients coming from the ED.
Finally, the third analysis is intended to manage
the supply flow, i.e. to change the discharge policy
to shortening as much as possible the length of stay
(Scenario 6 and 7). The usual proposal is to transfer
patients likely to be discharged during the day and
(waiting only for the next visit by the consultant), in
a dedicated room (referred as discharge room or
lounge). This allows freeing in advance some beds
since the morning, instead of the first afternoon as it
usually happens in the current practice observed.
This analysis can also be designed to verify the
impact of removing some administrative barriers or
modifying the work shifts and roastering of the
inpatient ward staff, thus allowing discharges on
Saturday and Sunday, or late evening, thus
smoothing the in and out flows during the day and
avoid useless stays.
The results are reported in Table 6. For each
scenario the resulting values of the performance
indexes reported in Section 2.1 are given.
Introducing the re-evaluation in the BM
behaviour reduces the number of misallocated
patients. Moving from scenario 0 to scenario 1 and
from scenario 2 to 3, the total number of patients
misallocated is reduced of about 61% and 83%,
respectively, thus resulting in a reduction of the
SIMULTECH2014-4thInternationalConferenceonSimulationandModelingMethodologies,Technologiesand
Applications
908

Table 6: Scenarios analysis results.
Indexes
Scenario
0
Scenario
1
Scenario
2
Scenario
3
Scenario
4
Scenario
5
# of patients misallocated (W1) 376 175 1133 227 163 138
# of patients misallocated (W2) 0 0 38 0 0 1
# of patients misallocated (W3) 5 0 29 0 1 3
# of patients misallocated (W4) 238 64 1070 141 25 87
Total # of patients misallocated 619 239 2270 368 189 229
Misallocation index (W1) 2,959 1,3973 9,0351 1,814 1,2944 1,0980
Misallocation index (W2) 0,000 0,0000 3,7924 0,000 0,0000 0,1067
Misallocation index (W3) 0,419 0,0000 2,3829 0,000 0,0853 0,2555
Misallocation index (W4) 4,163 1,1140 18,8646 2,497 0,4365 1,5029
Avg. Misallocation index 3,005 1,1706 11,1106 1,805 0,9252 1,1188
Avg. # of ED patients to be admit. in W1 2,933 2,667 2,200 1,133 2,000 1,584
Avg. # of ED patients to be admit. in W2 0,200 0,067 0,467 0,000 0,600 0,234
Avg. # of ED patients to be admit. in W3 0,067 0,400 0,467 0,800 0,000 0,200
Avg. # of ED patients to be admit. in W4 0,933 1,533 1,000 2,667 1,600 1,800
Avg. # of ED patients to be admitted 1,033 1,167 1,033 1,150 1,050 0,955
Waiting time before admission (W1) 1,799 2,560 2,584 2,986 2,828 2,528
Waiting time before admission (W2) 1,576 1,603 1,673 1,667 1,700 1,600
Waiting time before admission (W3) 1,564 1,751 1,736 1,677 1,681 1,681
Waiting time before admission (W4) 1,705 2,228 2,063 2,543 2,286 2,342
Avg. waiting time before admission 1,661 2,035 2,014 2,218 2,124 2,038
# postponed elective admissions (W1) 73 126 8 93 54 66
# postponed elective admissions (W2) 0 0 23 0 0 0
# postponed elective admissions (W3) 4 0 11 0 0 0
# postponed elective admissions (W4) 627 616 41 211 72 101
Total # postponed elective admissions 704 742 83 304 126 167
Bed utilization rate (W1) 92,350 92,520 92,420 92,320 91,680 92,380
Bed utilization rate (W2) 67,210 66,310 79,660 68,060 66,730 67,730
Bed utilization rate (W3) 73,490 70,020 75,930 71,250 70,010 72,230
Bed utilization rate (W4) 92,690 92,490 90,710 92,750 89,280 91,450
Avg. bed utilization rate 81,435 80,335 84,680 81,095 79,425 80,948
misallocation indexes as well. This is correlated with
an increase of the number of patients waiting to be
admitted and their average waiting time. Beside the
waiting time to be admitted never grows of more
than one hour. The introduction of the look-ahead
characteristics (Scenario 2 and 3) has a major impact
on reducing the number of postponed elective
admissions. By including both the decision
postponements and the look-ahead in the BM rules
(Scenario 3) the number of patients misallocated and
the number of elective patients postponements is
reduced of about 40%.
Looking at the detailed slot time results a major
problem is shown in some shifts where the number
of patients to be admitted grows since no bed are
available in the inpatient wards, for example on the
afternoon slots of Monday (Figure 5). Moving o this
direction, Scenario 4 and Scenario 5 are directed to
manage the flow of elective admissions and
discharges, respectively, in order of smoothing the
flow of emergent patients coming from the ED and
better synchronize them with the inpatient ward
flows.
The first strategy (i.e. reducing the elective
admissions of the slots where peaks in the emergent
admissions are observed) shows to be more effective
in reducing the number of misallocations and the
number f elective patients postponements, while the
ADiscreteEventSimulationModeltoSupportBedManagement
909
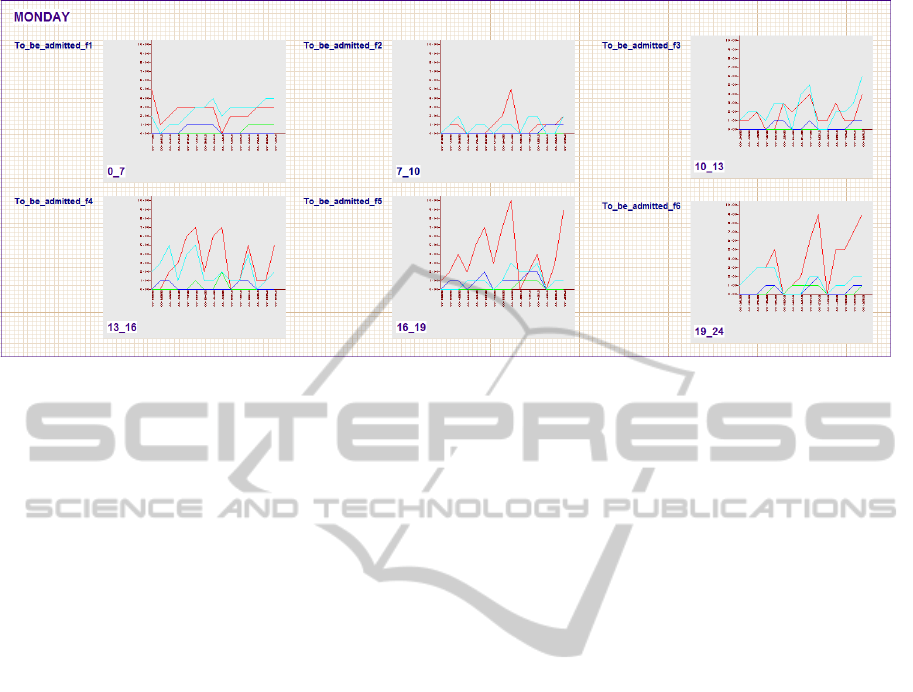
Figure 5: Number of ED waiting patients to be admitted on Monday for each time slot.
second performs better in reducing the number of
patients waiting in ED to be admitted and their
waiting time.
Finally, it must be noticed a problem related to
the bed capacity of ward group 1 and 4. The
utilization rate of those ward group are more than
90% and all the scenarios tested little impact on
these performance metrics.
Future direction of the research will be also
devoted to verify the impact of an alternative
assignment of the beds among the ward groups on
the system performance.
Note that the three kinds of analysis entail
different tactical and organizational decisions to be
taken from the hospital management.
There are, of course, many other possibilities, not
herein taken into consideration, which imply
strategic decisions. For example, facilitating the
discharge of elderly patients by improving the
continuity of care and linking the discharge
coordinator with the social services; extending the
hours of community nurse team by increasing the
home assistance and the transferrals to the
intermediate care ward, i.e. lower intensity ward,
(Boaden et al, 1999).
It should be pointed out that the second and third
groups of scenarios entail additional costs, even not
necessarily financial costs. Blocking the elective
admissions in some days, for instance, generates a
lengthening of waiting lists for elective patients
(social cost) or cancelations (financial cost); the
supply side scenarios assume to set up a dedicated
room (organizational cost) and/or requires higher
staff costs to manage the discharges in different and
enlarged time periods.
Besides determining the impact and benefits of
alternative scenarios by means of the chosen set of
performance metrics, costs should also be estimated
and taken into account.
6 CONCLUSIONS AND FUTURE
WORKS
In this paper we developed a decision support
framework for analysing the patient flows between
an hospital Emergency Department and the inpatient
stay wards of the same hospital.
The framework has been applied to a real case
study of the teaching hospital San Martino sited in
the city of Genova Surgery (Italy).
The main conclusion is that, in principle, a
decision tool cannot individuate the best solution,
but rather can help in assessing the direct and
indirect impact of different BM working rules as
well as of alternative organizations of the stay wards
aimed at facilitating the integration and
synchronization of the flows between ED and
inpatient wards.
The model underlying the bed manager decisions
affects how other hospital resources, such as
operating theatres and elective inpatients wards
perform since all hospital services are dependent on
bed availability. In turn, other hospital department
inefficient performance, mainly lengthening hospital
stays, can impact, upon ED crowding. This study has
recognised this effect in line with the literature
findings.
The so-called "bed management" is a business
function that allows increasing the efficient use of
beds, in order to optimize the flow of patients within
SIMULTECH2014-4thInternationalConferenceonSimulationandModelingMethodologies,Technologiesand
Applications
910

the hospital. It is a crucial function within an
organization based on process activities. Improving
patient flow is a way of improving health services.
The model herein developed could be used as a
decision support tool for a priori verifying the
effects of different bed management rules both by a
patient and hospital point of view.
Of course the model could include other patient
characteristics and patient flows also versus other
hospital facilities and can easily be adapted to
simulate other case studies, changing the system
constraints and the organizational models of the ED
and hospital wards.
Future work will be directed to perform an
extensive scenario analysis and compare the results
with a larger amount of real data and performance
indexes.
Moreover, future research are going to explore
the potentiality of applying the optimization module
integrated in the simulation software environment, in
order to determine the optimal decision pertaining
the number of beds to be assigned to each ward
group, able to optimize ad hoc chosen objective
functions, such as maximizing the bed utilization
rate, minimizing the number of postponed patients
or the overall misallocation index.
ACKNOWLEDGEMENTS
The authors acknowledge support from the Italian
Ministry of Education, University and Research
(MIUR), under the grand FIRB n. RBFR081KSB.
Data have been made available thanks to a
collaboration between ARS Liguria (Dr. Francesco
Quaglia and Domenico Gallo) and the Department
of Economics and Business, University of Genova.
REFERENCES
Agenas (National Agency for Health Care Services), 2012.
Monitor, Special Issue on the Emergency System.
Roma, http://www.agenas.it/pubblicazioni/monitor-
rivista-agenas.
Audit Commission, 1992. Lying in Wait: the Use of
Medical Beds, in Acute Hospitals. HMSO. London.
Audit Commission, 1993. Bed Management. HMSO.
London.
Bagust, A., Place, M., Posnett, J., 2003. Dynamics of bed
use in accommodating emergency admissions:
stochastic simulation model. British Medical Journal,
310 (7203), 155-158.
Boaden, R., Proudlove, N., Wilson, M., 1999. An
exploratory study of bed management. Journal of
Management in Medicine, 13 (4), 234-250.
Evans, B., Potvin, C., Johnson, G., Henderson, N., Yuen,
I., Smith, T., Metham, S., Taylor, S., Sniekers, D.,
2011. Enhancing Patient Flow in Acute Care Hospital:
Successful Strategies at the Juravinski Hospital.
Healthcare Quarterly, 14 (3), 66-75.
Green, J,. Armstrong, D,. 1994. The views of service
providers. In Morrell, D., Green, J., Armstrong, D.,
Bartholomew, J., Gelder, F., Jenkins, C., Jankowski,
R., Mandalia, S., Britten, N., Shaw, A., Savill, R. (eds)
Five Essays on Emergency Pathways, Institute, for the
Kings Fund Commission on the future of Acute
Services in London, Kings Fund, London.
Haraden, C., Resar, R., Horton, S.S., Henderson, D.,
Dempsey, C., Appleby, D., 2004. Capacity
Management: Breakthrough Strategies for Improving
Patient Flow. Frontiers of Health Services
Management, 20 (4), 3-15.
Harper, P.R., Shahani, A.K., 2002. Modelling for the
planning and management of bed capacities in
hospitals. Journal of the Operational Research
Society, 53, 11–18.
Health Foundation, 2013. Improving patient flow across
organisations and pathways. (retrived from
http://www.health.org.uk/public/cms/75/76/313/4196/I
mproving%20patient%20flow.pdf?realName=TxPs1T.
pdf).
Howell, E., Bessman, E., Kravet, S., Kolodne,r K.,
Marshall, R., Wright, S., 2008. Active Bed
Management by Hospitalists and Emergent
Department Throughput. Annals of Internal Medicine,
149; 804-810.
Howell, E., Bessman, E., Marshall, R. Wright, S., 2010.
Hospitalist bed management effecting throughput from
the emergency department to the intensive care unit,
Journal of Critical Care, 7(2); 184-189.
IHI, Institute for Healthcare Improvement, 2003.
Optimizing Patient Flow. Moving Patients Smoothly
Through Acute Care Settings. Innovation Series 2003
paper, online article, retrieved June 14th 2014,
http://hospitalmedicine.ucsf.edu/improve/optimizing_
pt_flow_white_paper2003.pdf .
Jensen, A1, Boyle, J, Khanna, S., 2013. Visualising patient
flow. Health Technology Information, 178, 77-82.
Istat (National Institute Statistics in Italy), 2011. http://noi-
italia2011.istat.it/index.php?id=7&user_100ind_pi1%
5Bid_pagina%5D=88&cHash=b52e8996296b53cd14c
5ef201bda574a.
Law M.A., 2007. Simulation Modeling & Analysis.
McGraw-Hill, 4th ed.
Simeu, 2011. Standard organizzativi delle strutture di
emergenza e urgenza. Organizational standards of
A&E facilities, http://www.comesemergenza.it/files/
Standard_FIMEUC-SIMEU_2011.pdf (retrieved June
24th, 2014).
Proudlove, N., Gordon, K., Boaden, R., 2003. Can good
bed management solve the overcrowding in A&E?.
Emergency Medicine Journal, 20 (2), 149-155.
ADiscreteEventSimulationModeltoSupportBedManagement
911

Proudlove, N., Boaden, R., Jorgensen, J., 2007.
Developing bed managers: the why and the how.
Journal of Nursing Management, 15, 34-42.
Tortorella, F., Ukanowicz, D., Douglas-Ntagha, P., Ray,
R., Triller, M., 2013. Improving bed turnover time
with a bed management system. J Nurs Adm;43 (1),
37-43.
Young, T., Brailsford, S., Connell, C., Davies, R., Harper,
P., Klein, J.K., 2004. Using industrial processes to
improve patient care. British Medical Journal, 328,
162–4.
Vissers, J., Beech, R., 2005. Health Operations
Management: Patient Flow Logistics in Health Care.
Routledge, Oxon.
Vanberkel, P.T., Boucherie, R.J., Hans, E.W., Hurink,
J.L., Litvak, N., 2009. A Survey of Health Care
Models that Encompass Multiple Departments,
http://eprints.eemcs.utwente.nl/15762/01/memo1903.p
df.
Witness (2013). User guide. Lanner Group, London, U.K.
SIMULTECH2014-4thInternationalConferenceonSimulationandModelingMethodologies,Technologiesand
Applications
912
