
Stereo Vision-based Visual Tracking using 3D Feature Clustering for
Robust Vehicle Tracking
Young-Chul Lim and Minsung Kang
Division of Advanced Industrial Science and Technology, Daegu Gyeongbuk Institute of Science & Technology, Room 511,
5th floor, 3rd Research Center, 333, Techno Jungang Daero, Hyeonpung-myeon, Dalseong-gun,
Daegu, 711-873, Republic of Korea
Keywords: Object Tracking, Feature Tracking, Feature Clustering, Stereo Vision.
Abstract: In order to detect vehicles on the road reliably, a vehicle detector and tracker should be integrated to work in
unison. In real applications, some of the ROIs generated from a vehicle detector are often ill-fitting due to
imperfect detector outputs. The ill-fitting ROIs make it difficult for tracker to estimate a target vehicle
correctly due to outliers. In this paper, we propose a stereo-based visual tracking method using a 3D feature
clustering scheme to overcome this problem. Our method selects reliable features using feature matching
and a 3D feature clustering method and estimates an accurate transform model using a modified RANSAC
algorithm. Our experimental results demonstrate that the proposed method offers better performance
compared with previous feature-based tracking methods.
1 INTRODUCTION
Robust object detection and tracking are very
important for driving assistance systems and safe
driving. Recognizing a vehicle’s surroundings can
reduce the number of traffic accidents caused by
careless driving. In the field of intelligent vehicles,
many researchers have worked on detecting and
tracking various objects, such as vehicles,
pedestrians, and traffic signs. Many researchers have
made their best efforts to improve the reliability of
object detection methods (Sivaraman and Trivedi,
2013). However, no state-of-the-art detection
method can detect all objects on the road without
false detections. In order to enhance the detection
performance, the best way is to integrate detection
and tracking algorithms. Even if the detector misses
a target object in the current frame, visual tracking
can localize the target object using the motion
information in the previous frames.
In visual tracking methods, the traditional and
fundamental approach is template matching, but its
limitation is a high computational cost due to its
repetitive comparison process. A mean shift (MS) is
a simple iterative nonparametric density analysis
that is essentially a gradient ascent algorithm with an
adaptive step size (Cheng, 1995). The kernel-based
tracking method uses a spatially smoothing
similarity function with a Bhattacharyya coefficient
and a gradient optimization method with mean shift
for target localization (Comaniciu et al., 2008). A
combined method with an adaptive Kalman filter
(KF) and a mean shift was proposed to localize the
target position accurately when the object undergoes
a large degree of displacement or occlusion (Xiaohe
et al., 2010). Particle filter-based tracking
approaches compare appearance similarities such as
color, edge, and texture within candidate regions and
select the most likely ROI (Adam et al., 2010).
Feature-based tracking methods estimate the
state of a target while calculating the displacement
of distinctive features and estimating a transform
model using the random sample consensus
(RANSAC) algorithm (Rodrigo et al., 2010). The
Kanade-Lucas-Tomasi (KLT) method (Jianbo and
Tomasi, 1994) employs an iterative optimization
scheme that finds distinct features in the current
frame and then attempts to find a correspondence in
the next frame. In order to handle any large
displacement due to abrupt motion, a pyramidal
KLT method estimates the motion vector by
computing the iterative optical flow (Bouguet,
2010). A modified KLT method uses conventional
KLT in conjunction with a symmetric-based tracker
for tracking bilaterally symmetric planar objects
such as pedestrians and vehicles on the road
788
Lim Y. and Kang M..
Stereo Vision-based Visual Tracking using 3D Feature Clustering for Robust Vehicle Tracking.
DOI: 10.5220/0005147807880793
In Proceedings of the 11th International Conference on Informatics in Control, Automation and Robotics (IVC&ITS-2014), pages 788-793
ISBN: 978-989-758-040-6
Copyright
c
2014 SCITEPRESS (Science and Technology Publications, Lda.)
(Schreiber, 2009). Feature based-tracking methods
deteriorate the matching accuracy due to intensity
ambiguities in pixels, and some researchers have
introduced a combined method which utilizes the
advantages of appearance and feature matching
(Khan and Gu, 2010).
Visual tracking aims to find the movement of an
object onto a current image from a previous image.
Recent feature-based visual tracking methods have
focused on enhancing robustness against very poor
conditions, as characterized by abrupt motions,
appearance and rotation changes, illumination
changes, and partial occlusion, for instance. The way
to evaluate these approaches is to determine how
well the tracker estimates the ROI after the first
image is manually annotated by a well-fitting ROI.
In real applications, the ROI is generally generated
by a detector, and the ROI is often ill-fitting due to
noisy detector outputs. There may be many outliers
in an ill-fitting ROI, which cause a track drifting
problem. In order to track an ill-fitting target object
robustly, it is necessary to remove the outliers. In
this paper, a feature-based visual tracking method
using 3D feature clustering is proposed and shown
to be robust against an ill-fitting ROI.
The rest of our paper is organized as follows. In
Section 2, we give an overview of our feature-based
tracking method. Section 3 explains the 3D feature
clustering scheme using position and motion
displacement in global coordinates. Experimental
results and analyses of real-world image sequences
are presented in Section 4. Finally, Section 5
concludes this paper with suggestions for future
works.
2 OVERVIEW OF OUR VISUAL
TRACKING METHOD
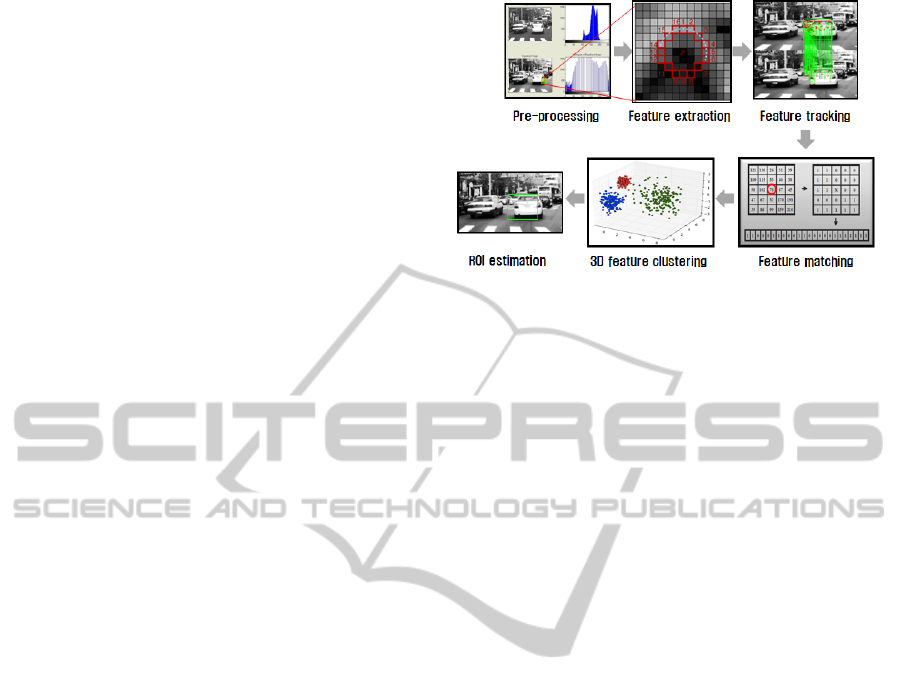
Our feature-based visual tracking method is
proposed to be robust against an ill-fitting ROI. The
method consists of pre-processing, feature extraction,
feature tracking, feature matching, 3D feature
clustering, and ROI estimation, as shown in Figure 1.
The feature matching and 3D feature clustering steps
are used to select reliable inlier features.
In real road environments, the illumination
condition is very poor. Pre-processing methods such
as Gaussian smoothing and histogram equalization
are very efficient to ensure robustness against a poor
illumination condition. A features from accelerated
segment test (FAST) detector (Rosten et al., 2010) is
used to extract distinctive features due to its good
Figure 1: Architecture of the proposed feature tracking
method.
speed and high level of accuracy. The FAST
detector determines a point as a distinctive feature if
n contiguous pixels exist in the circle of the point.
The n pixels should all be brighter or darker than the
intensity of the point. Each of the 16 surrounding
pixels has one of three states which are represented
by darker (d), brighter (b), and similar (s) pixels. In
the feature tracking module, the KLT tracker
localizes the correspondences of features extracted
from the previous image. Erroneous corresponding
feature pairs are removed by a feature matching
method which utilizes binary feature matching. The
census transform method (Zabih and Woodfill, 1994)
and the Hamming distance are used to measure the
similarity between the feature pairs which are
estimated by the feature tracker. Census transform
converts the pixel intensity to a binary pattern using
the relative order of the local intensity. The
similarity between binary patterns of the feature
pairs are measured by the Hamming distance. This
matching method is much more robust than the
normalized cross-correlation (NCC) matching
method near object boundaries (Zabih and Woodfill,
1994). Many features extracted from the FAST
detector exist in the object boundaries. The feature
matching algorithm is executed in the intensity
image to remove incorrectly estimated feature pairs.
,
~
,
,
(1)
where T
c
(x) denotes the census transform function of
feature x, and D
H
(a,b) indicates the Hamming
distance between the a and b vectors.
and
~
denote the i
th
feature in the previous frame and the
paring feature in the current frame, respectively. is
a fixed threshold value for selecting the features. In
order to find outlier features, the 3D feature
clustering module selects features corresponding to
only the target object among selected features. The
StereoVision-basedVisualTrackingusing3DFeatureClusteringforRobustVehicleTracking
789
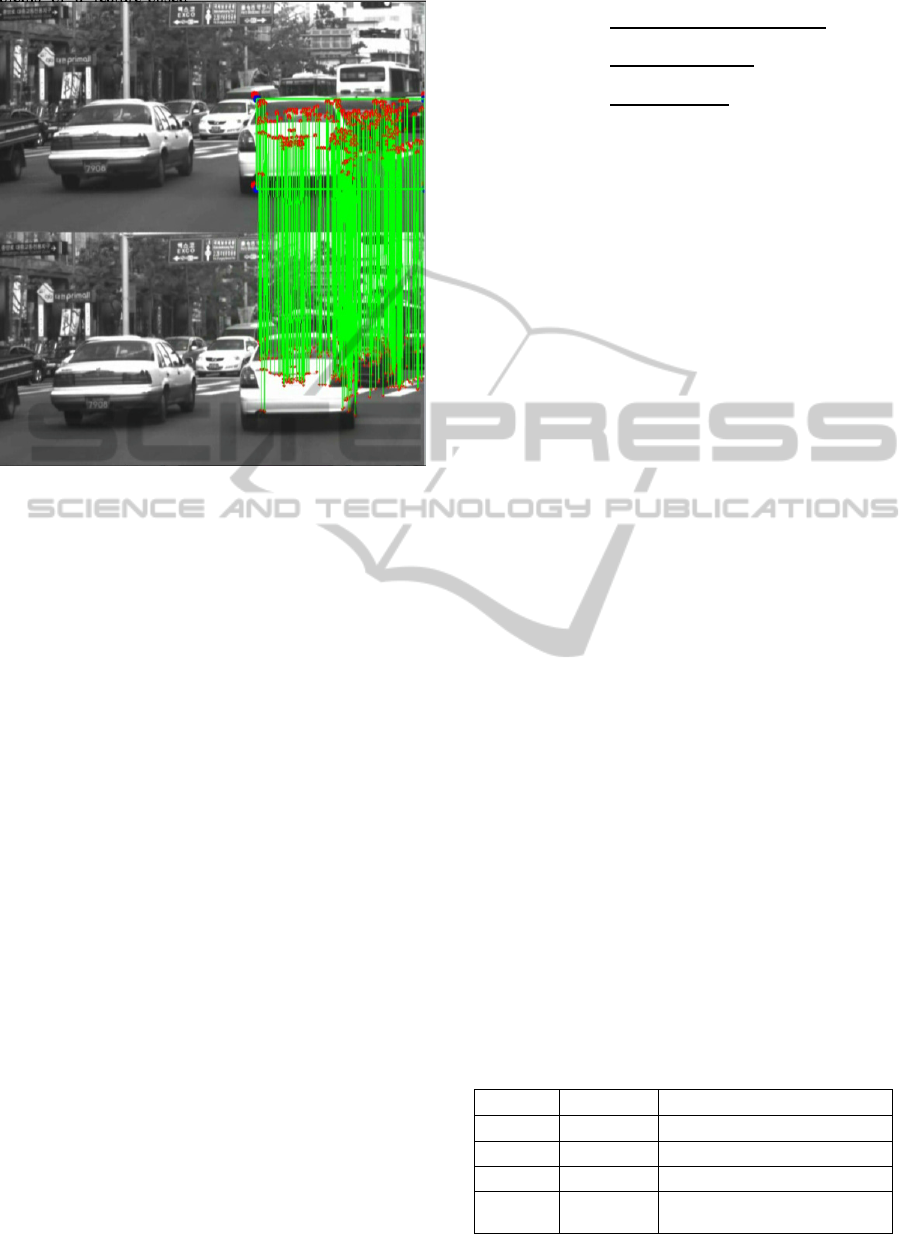
Figure 2: Outliers in an ill-fitting ROI.
mean and covariance of the features in terms of the
global position and motion are iteratively updated by
the Mahalanobis distance. The feature clustering
step is finished when the mean of the feature
position converge. The clustering features are used
to estimate a transform model parameter. An affine
transform is used for motion estimation of the target
object in this work. Finally, the current ROI is
estimated by the transform model and the previous
ROI position.
3 3D FEATURE CLUSTERING
One of the difficult problems with feature-based
visual tracking involves selecting the features
corresponding to the target object. When a target
object is estimated by an ill-fitting ROI from an
object detector, there may be many outliers that
correspond to background or other objects in the
ROI, as shown in Figure 2. Consequently, the
outliers make it difficult to estimate the transform
model parameters accurately. The 3D feature
clustering method tackles this problem while
minimizing the number of these outliers. The
features are clustered in a 3D global position and
motion spaces using an iterative scheme. In this
clustering method, the features are projected onto
the 3D global coordinate using an inverse
perspective mapping (IPM) model (Lim et al, 2010),
where
denotes the 3D global position of the i
th
,
(2)
feature. X
g
, Y
g
, and Z
g
are feature positions on the
global coordinates. x
dl
and x
dr
are horizontal
positions on the left and right image coordinates. y
d
indicates the vertical position in both image
coordinates. d is the integer disparity of the feature.
and b are the focal distance expressed in units of
pixels and a baseline that denotes the distance
between the stereo cameras, respectively. h and
denote the height of the cameras above the ground
and the angle between the Z direction and the optical
axis of the cameras, respectively. The Mahalanobis
distance (d
m
) is used for clustering the features in the
3D global coordinates.
, ,
, ,
,
(3)
where
and
denote the mean and covariance
of the features in the 3D global position. T
p
is a
threshold value for discarding the outliers. The
displacement of selected features is calculated for
3D global motion clustering in the global
coordinates.
, ,
, ,
,
(4)
where
indicates the motion vector of the i
th
feature in the global coordinate,
and
are the
mean and covariance of the motion vectors in the
global coordinate. T
M
is a threshold value related to
the motion vector. The mean and covariance of
features are updated by the clustered features at each
iterative epoch. The features are iteratively selected
and rejected until the mean of the motion vector
converges to the global coordinate. The finally
selected features are used to estimate an optimal
transform matrix
with the modified RANSAC
method.
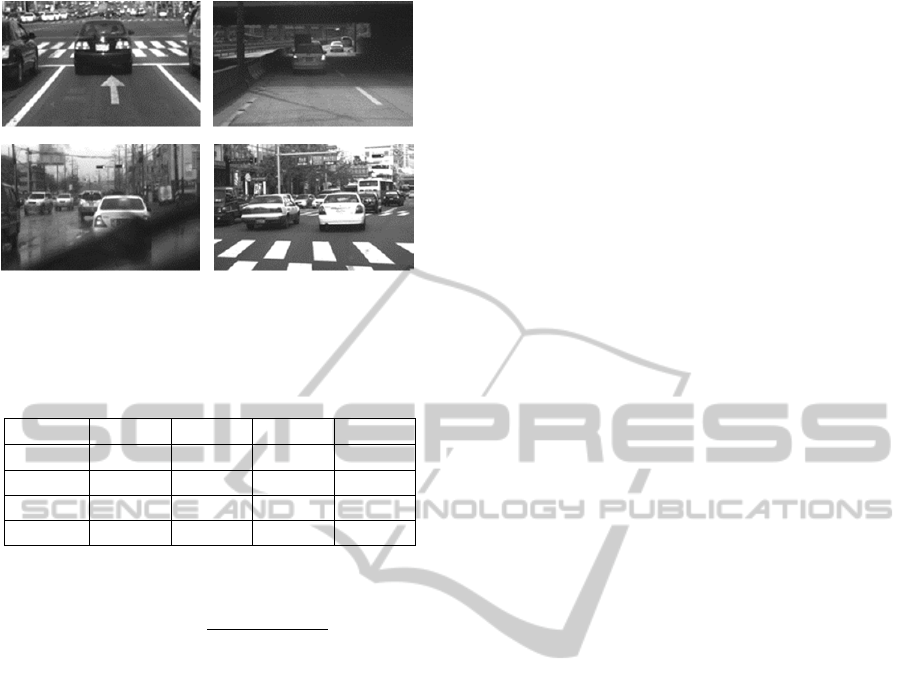
Table 1: Summary of the test datasets.
# of frame characteristics
Scene 1 101 Size change
Scene 2 177 Poor illumination condition
Scene 3 100 Partial occlusion on a rainy day
Scene 4 200
Pose change in a cluttered
environment
ICINCO2014-11thInternationalConferenceonInformaticsinControl,AutomationandRobotics
790
(a) (b)
(b) (d)
Figure 3: Test datasets for feature-based visual tracking. (a)
Size change, (b) Illumination change, (c) Partial occlusion
on a rainy day, (d) Pose change in a cluttered environment.
Table 2: Processing time (ms) of visual trackers.
KLT 2D-SFVT SURF 3D-SFVT
Scene 1 7.5
7.3
216.4 7.8
Scene 2 7.7 7.4 122.4
7.2
Scene 3 7.0 10.2 216.5
6.5
Scene 4 8.3 7.8 204.5
6.9
argmax
,
,
,
(5)
where P is the number of selected features,
is the
k
th
feature position in t frame, and
has a constant
value. The current ROI is estimated by the transform
matrix
and the previous ROI.
4 EXPERIMENTAL RESULTS
Our feature-based visual tracking method was
implemented with Visual C++ 9.0 and the OPENCV
2.2 library. Four test datasets were used for a
quantitative evaluation and a qualitative analysis.
They were captured from real road environments, as
shown in Figure 3.
In Scene 1, the vehicle size grows steadily in the
image while a distant vehicle is gradually
approaching. In Scene 2, a target vehicle passes
through a tunnel. An abrupt illumination change
occurs when entering and exiting the tunnel. The test
dataset contains a very dark lighting condition when
the vehicle passes in the tunnel. In Scene 3, the test
dataset was captured on a rainy day. The target
vehicle was often occluded by the windshield wiper,
and the target vehicle contains noisy regions due to
raindrops. In Scene 4, the pose of the target vehicle
changes in a road environment with heavy traffic,
and many outliers exists in the ROI. A summary of
test scenes is described in Table 1.
The target vehicle is manually annotated in the
first frame, after which the trackers estimate the ROI
of the target vehicle from the next frame. The
annotated ROIs are ill-fitting while shifting the ROIs
to the left and right to verify robustness against an
ill-fitting ROI. The performances of the KLT tracker
(Jianbo and Tomasi, 1994), SURF tracker (Bay et al.,
2010), 2D selected-feature-based visual tracker (2D-
SFVT) (Lim et al., 2010), and 3D selected feature-
based tracker (3D-SFVT) are measured by the
overlap ratio between ground truth regions and
estimated regions.
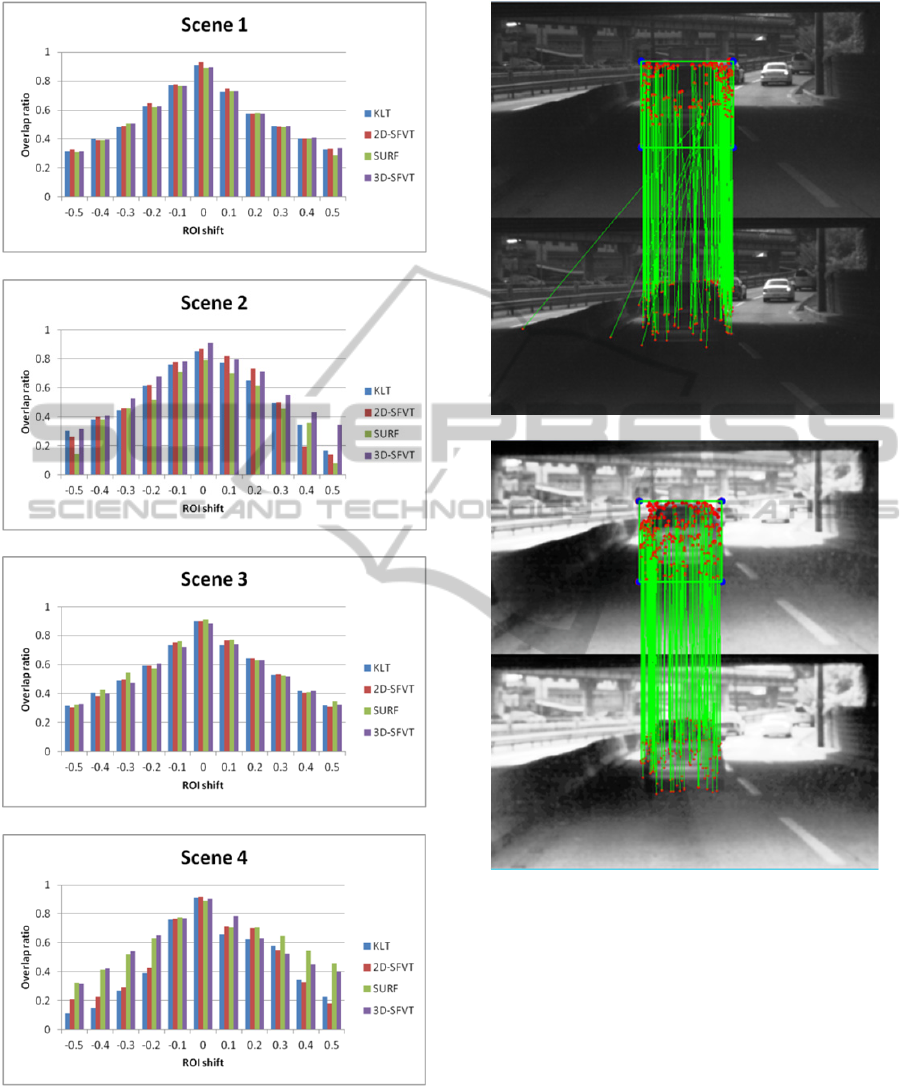
As shown in Figure 4, the experimental results
show that all trackers can estimate the ROIs well
without errors when the ROI is initially well-fitting.
However, most vehicle detectors often provide an
inaccurate ROI. When the ROI is ill-fitting, previous
tracking methods often provide poor tracking
performance.
The tracking performances of all of the methods
are similar in Scene 1. The 2D-SFVT method
provides slightly better tracking performance when
the ROI is well-fitting. In experimental results for
Scene 2, the 3D-SFVT method provides the best
tracking performance, especially when the ROIs are
ill-fitting. In Scene 2, the pre-processing methods of
a Gaussian smoothing filter and histogram
equalization make the trackers robust against the
poor illumination condition in the tunnel, as shown
in Figure 5. Similar performances for all the trackers
resulted for Scene 3. Although there are many
feature matching errors occur due to occlusion and
noisy pixel intensity in Scene 3, a modified
RANSAC algorithm can estimate the correct
transform matrix using only part of the selected
features. When the ROI is ill-fitting in Scene 4,
previous tracking methods generate track-drifting
problems due to outliers. However, the 3D-SFVT
method removes the outliers using feature matching
and the 3D clustering method, and reliable tracking
results can be achieved (Figure 6). In the test of the
SURF tracker in Scene 4, track drifting problems
occur, but the ROIs are fortunately readjusted to the
target vehicle due to the field of view (FOV) of the
camera. Table 2 shows the processing time of each
visual tracker. The processing time of the SURF
tracker is high, and the other visual trackers achieve
similar runtimes.
StereoVision-basedVisualTrackingusing3DFeatureClusteringforRobustVehicleTracking
791
(a)
(b)
(c)
(d)
Figure 4: Experiment results of feature-based visual
trackers. The ROI shift indicates that the ROI moves to the
left (negative) and right (positive) directions, and the value
denotes the shift proportion with regard to the width of
ROI. (a) Scene 1, (b) Scene 2, (c) Scene 3, and (d) Scene 4.
(a)
(b)
Figure 5: Feature matching results in Scene 2. (a) before
pre-processing, and (b) after pre- processing.
5 CONCLUSIONS
In this paper, we proposed a stereo-based visual
tracking method using 3D feature clustering. The
features are projected onto a 3D global coordinate
and reliable feature pairs are selected by feature
matching and iterative 3D clustering schemes.
Model parameters and the ROI are estimated
using the selected features and a modified RANSAC
algorithm. The experimental results demonstrate that
our method outperforms previous methods in the
ICINCO2014-11thInternationalConferenceonInformaticsinControl,AutomationandRobotics
792
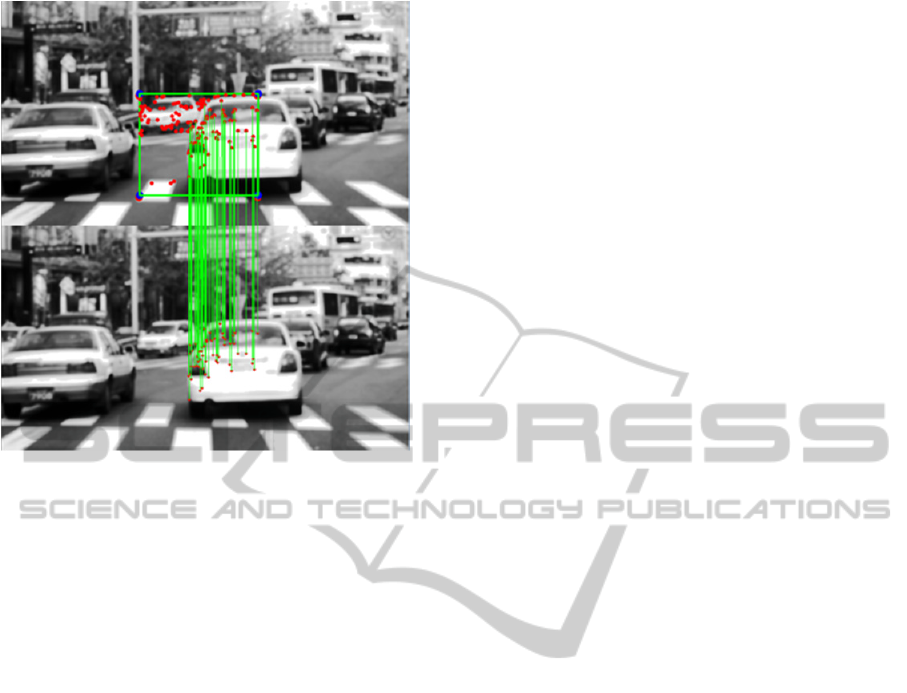
Figure 6: Feature matching results when the ROI shift is -
0.4 in Scene 4.
presence of an ill-fitting ROI with reasonable
processing times. In the future, we will combine the
proposed tracker with a vehicle detector to enhance
its vehicle detection performance.
ACKNOWLEDGEMENTS
This work was supported by the DGIST R&D
Program of the Ministry of Science, ICT, and Future
Planning of Korea.
REFERENCES
Adam, A., Rivlin, E., and Shimshoni, I., 2006. Robust
fragments-based tracking using the integral histogram.
Proceedings of IEEE Conference Computer Vision
and Pattern Recognition, pp. 798-805.
Bay, H., Ess, A., Tuytelaars, T., and Gool, L. V., 2008.
SURF: Speeded Up Robust Features. Computer Vision
and Image Understanding, Vol. 110, no. 3, pp. 346-
359.
Bouguet, J. -Y., 2010. Pyramidal implementation of the
Lucas-Kanade feature tracker. http://robots.stanford.
edu/cs223b04/algo_tracking.pdf.
Cheng, Y., 1995. Mean shift, mode seeking, and clustering.
IEEE Transactions on Pattern Analysis and Machine
Intelligence. Vol. 17, no. 8, pp. 790-799.
Comaniciu, D., Ramesh, V., and Meer, P., 2003. Kernel-
based object tracking. IEEE Transactions on Pattern
Analysis and Machine Intelligence. Vol. 25, no. 5, pp.
564-577.
Jianbo, S. and Tomasi, C., 1994. Good features to track.
Proceedings of IEEE Conference Computer Vision
and Pattern Recognition, pp. 593-600.
Khan, Z. H. and Gu, I. Y. -H., 2010. Joint feature
correspondences and appearance similarity for robust
visual object tracking. IEEE Transactions on
Information Forensics and Security, Vol. 5, no. 3, pp.
591-606.
Lim, Y. -C., Lee, M., Lee, C. -H., Kwon, S., and Lee, J. -
H., 2010. Improvement of stereo vision-based position
and velocity estimation and tracking using a stripe-
based disparity estimation and inverse perspective
map-based extended Kalman filter. Optics and Lasers
in Engineering, Vol. 48, no. 9, pp. 859-868.
Lim, Y. -C., Lee, M., Lee, C. -H., Kwon, S., and Lee, J.-
H., 2011. Integrated position and motion tracking
method for online multi-vehicle tracking-by-detection.
Optical Engineering, Vol. 50, no. 7, 077203.
Rodrigo, R., Zouqi, M., Zhenhe, C., and Samarabandu, J.,
2009. Robust and efficient feature tracking for indoor
navigation. IEEE Transactions on Systems, Man, and
Cybernetics, Part B: Cybernetics, Vol. 39, no. 3, pp.
658-671.
Rosten, E., Porter, R., and Drummond, T., 2010. Faster
and better: a machine learning approach to corner
detection. IEEE Transactions on Pattern Analysis and
Machine Intelligence, Vol. 32, no. 1, pp. 105-119.
Schreiber, D., 2009. Incorporating symmetry into the
Lucas-Kanade framework. Pattern Recognition Letters,
Vol. 30, no. 7, pp. 690-698.
Sivaraman, S. and Trivedi, M.M., 2013. A Review of
Recent Developments in Vision-Based Vehicle
Detection. Proceedings of IEEE Intelligent Vehicle
Symposium, pp. 310-315.
Xiaohe, L., Taiyi, Z. Xiaodong, S. and Jiancheng, S., 2010.
Object tracking using an adaptive Kalman filter
combined with mean shift. Optical Engineering Letters,
Vol. 49, no. 2, 020503.
Zabih, R. and Woodfill, J., 1994. Non-parametric local
transforms for computing visual correspondence.
Proceedings of European Conference on Computer
Vision, Vol. 2, pp. 151-158.
StereoVision-basedVisualTrackingusing3DFeatureClusteringforRobustVehicleTracking
793
