
A Comparison of Two Fitting Functions for Sacadic
Pulse Component Mathematical Modelling
Rodolfo Garc´ıa-Berm´udez
1
, Camilo Vel´azquez
1
, Fernando Rojas
2
,
Roberto Becerra
1
, Michel Vel´azquez
1
, Liliana L´opez
1
and Luis Vel´azquez
3
1
University of Holgu´ın, Biomedical Data Processing Research Group (GPDB),
80100, Holgu´ın, Cuba
2
University of Granada, Department of Computer Architecture and Technology, ETS Ing.
Inform´atica y de Telecomunicaci´on, 18071 Granada, Spain
3
Centre for the Research and Rehabilitation of Hereditary Ataxias “Carlos J. Finlay”,
80100, Holgu´ın, Cuba
Abstract. An accepted model for the saccade signal of ocular motor neurons
comprises two components in the form of a pulse and a step. In this contribution,
an assessment of two fitting functions for the saccadic pulse component is made,
in order to obtain a reduced set of descriptors that could be used for the early
diagnosis of ataxia. Results show that both models have achieved to describe the
waveform of the saccadic pulse signal, revealing higher performance of Gauss
series over the gamma function.
1 Introduction
Ocular movements are affected by inherited spinocerebellar ataxias [3, 1,2,4], spe-
cially the behavior of saccadic system is modified, patients show increased latencies
to respond to visual stimulation with slower saccades among other impairments of this
system [5].
An accepted model for saccades generation involves two components, oculomotor
plant is driven by a pulse-step to produce a saccade [6]. Several works have been using
independent component analysis to isolates pulse and step components in saccadic and
vergence ocular movements [7, 9, 8]. Based in these results in a precedent work we
have applied independent component analysis to noisy electro-oculographic records of
patients, of ataxia SCA2, characterized by severely deformed saccades and the pulse
and step components were obtained [10]. In order to evaluate the pulse component
several of its parameters has been used, as duration, amplitude, the time to reach a
determined percent of the final value (not including the latent period) [12,9,11] among
others. An important limitation common in the estimation of these variables is the need
to use thresholds to identify onset and offset of the pulse.
In the present work an evaluation of two fitting functions for the pulse component is
made in order to obtain a reduced set of descriptors to be used for classification purposes
of ataxia patients and presymptomatics with respect to healthy subjects.
García-Bermúdez R., Velázquez C., Rojas F., Becerra R., Velazquez M., López L. and Velázquez L..
A Comparison of Two Fitting Functions for Sacadic Pulse Component Mathematical Modelling.
DOI: 10.5220/0005136800880094
In Proceedings of the International Workshop on Artificial Neural Networks and Intelligent Information Processing (ANNIIP-2014), pages 88-94
ISBN: 978-989-758-041-3
Copyright
c
2014 SCITEPRESS (Science and Technology Publications, Lda.)

2 Materials and Methods
All the experiments and material were handled by the medical staff of the Centre for the
Research and Rehabilitation of Hereditary Ataxias (CIRAH) at Holgu´ın (Cuba). A two-
channel electronystagmograph (Otoscreen, Jaeger-Toennies, Hochberg, Germany) was
used to record saccadic ocular movements. Subjects were seated on chair with special
fixation accessory to avoid head movements, and asked to follow a divergence stimuli
conformed by a white circular target in a blank screen. The target appeared suddenly
at each side of the screen at random time slots between 1s and 3 s, the distance from
subject to screen was adjusted to obtain an angular distance of 30 degrees.
A group of 19 records of patients of ataxia was collected and the 29 records of
presymptomatic individuals with genetic evidence of the disease but without detected
symptoms and a third group of 23 records of healthy subjects. Saccades were identified
using an automated algorithm based in a velocity threshold of 10 degrees per second,
after this step a manual process of visual inspection was made to eliminate saccades
considered anticipatory (latencies lower than 100 ms) or with artifacts like blinkings,
excessive noise, muscle or extra ocular movements in the close time before onset, or
in the next fixation. In the next step the mean of amplitude, duration and latency were
calculated and saccades with deviations higher than 20% were excluded, in similar way
as it is described in [10].
2.1 Obtaining Pulse and Step Components
Independent component analysis (ICA) is a well knownmethod for estimation of under-
lying components in mixtures of non gaussian and statistically independent variables.
The aim of ICA is to find the linear matrix W which mixes the x independent compo-
nents to produce a set of y observed signals, as it is shown in the equation 1:
y = W × x. (1)
To apply ICA as observations are considered an ensemble of saccades after the
process of identification and exclusion of non valid saccades, where each row is a vector
containing a saccade:
S =
s
11
s
12
. . . s
1n
.
.
.
.
.
. . . .
.
.
.
s
m1
s
m2
. . . s
mn
(2)
An Infomax ICA [13] algorithm implemented in matlab [14] was used accordingly
to the procedure described in [10]. Figure 1 shows the pulse and step obtained for a
patient of ataxia.
2.2 Pulse Component Fitting
The fitting of step component using a sigmoid function was treated in a precedent work
[10], four coefficients were estimated and used in conjunction with the value and latency
89

0 100 200 300 400 500 600
0
5
10
15
20
25
30
35
Time (ms)
Component value (degrees)
Fig.1. Pulse and step components.
of the maximum of the pulse component for classification purposes. The best results of
experimental tests with several functions to fit the pulse components were achieved
with the gamma function, previously used to model the velocity behavior of saccadic
movements [15], and gaussian series with diferent numbers of terms. The equation of
the gamma function is the following:
f(x) = a
h
x
b
i
c−1
e
−
x
b
(3)
Where a, b, c and d are the coeficients to be adjusted.
While the gaussian series is expressed by:
f(x) =
n
X
i=1
a
i
e
−
x−b
i
c
i
2
(4)
Where the coefficients for each term are a
i
, b
i
, c
i
The function fitting procedure was made by means of the fit function implemented
in matlab. Prior to the fitting process the active pulse segment was identified, in order to
consider only this part of the signal. The onset and offset points were marked examining
the first derivative of the signal at left (onset point) and right (offset point) sides of the
central maximum value, until a value of 0 was found. Figure 2 shows a segmented pulse
fitted by gamma function (left) and using a two terms Gauss series (right).
0 20 40 60 80 100 120 140
−1
0
1
2
3
4
5
Time (ms)
Component value (degrees)
data
fitted curve
prediction bounds
0 20 40 60 80 100 120 140
−1
0
1
2
3
4
5
Time (ms)
Component value (degrees)
data
fitted curve
prediction bounds
Fig.2. Pulse component fitted using a gamma (left) and Gauss1 (right) function.
3 Results
The fitting was applied to all the records, using gamma function and Gauss series from
one up to five terms. A visual inspection of the graphics for every record and fitting
function was done to rank the results, when no differences were seen among several
90
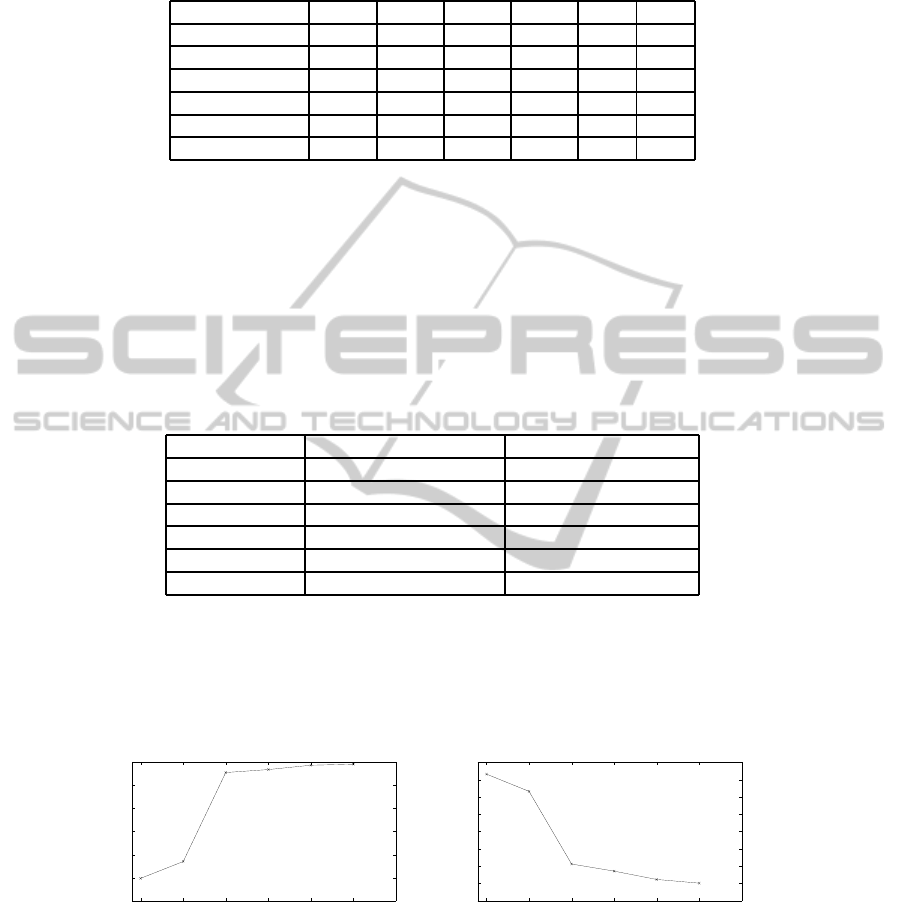
Table 1. Ranking of fitting functions.
Fitting functions 1 2 3 4 5 6
Gamma 0.97% 28.64% 49.51% 11.65% 1.94% 0.49%
Gauss1 3.88% 38.83% 32.04% 19.9% 5.34% 0%
Gauss2 62.14% 28.16% 6.8% 2.43 % 0% 0%
Gauss3 80.01% 7.28% 2.43% 0% 0% 0%
Gauss4 82.04% 1.46% 0% 0% 0% 0%
Gauss5 73.79% 1.46% 0.49% 0% 0% 0%
functions, same rank was assigned to them for this record. This is summarized in Table
1.
Results from Table 1 reveal gamma function worse performance when compared
with the Gauss series. Best results are achievedby Gauss2 and highers. Table 2 shows an
analysis of the success in fitting of each function, gamma function is below Gausss1 and
Gauss2, from Gauss3 this indicator deteriorates. An overall evaluation of both tables
points to Gauss2 as the best, with a very low percent of failed fittings and ranked first
or second about 80% of the cases, while gamma is in general sense worst than Gauss
series.
Table 2. Failures of fitting functions.
Fitting functions Number of failed fittings Percent of failed fittings
Gamma 14 6.8%
Gauss1 0 0%
Gauss2 1 0.49%
Gauss3 21 10.19%
Gauss4 34 16.5%
Gauss5 50 24.27%
Gauss series of higher order has the inconvenience of the increased number of coef-
ficients (three per term), otherwise gamma and Gauss1 with only three coefficients. An
analysis of the correlation coefficient of Pearson (Figure 3 left) and root medium square
error (Figure 3 right) as metrics for the goodness of th fit accounts for gamma as the
worst function, while the Gauss series has sustained improvements with the increment
in the number of terms.
0.97
0.975
0.98
0.985
0.99
0.995
1
Gamma
Gauss1
Gauss2
Gauss3
Gauss4
Gauss5
0
0.1
0.2
0.3
0.4
0.5
0.6
0.7
0.8
Gamma
Gauss1
Gauss2
Gauss3
Gauss4
Gauss5
Fig.3. Pearson’s correlation coefficients (left) and RMSE (right) results of fitting functions.
3.1 Analysis of Fitting Coefficients
The fitting procedure for gamma functions failed for 5 records of patients of ataxia (14
well fitted), six presymtomatics (23 well fitted) and 3 healthy subjects (20 well fitted),
91

Gauss1 showed no failures and Gauss2 failed for one patient (not coincident with those
ones failed by gamma). Given the limited quantity of available records it was decided
to compare gamma and Gauss1 fitting functions. A random selection of the resultant
records of presymtomatics and healthy subjects was made to obtain fourteen records
in each class of subjects for this preliminary analysis of the relationships among fitting
coefficients and classes of subjects.
Figure 4 represents the coefficients of gamma function versus the category of the
subjects, it can be seen overlapping among categories for the three variables. Otherwise,
in Figure 5 is possible to observe better defined clusters in the categories of healthy sub-
jects and patients of ataxia for coefficients b and c, while presymptomatics are located
between these categories, probably depending on their progression in the disease. It
must be noticed the bigger separation between means and similar dispersion observed
for coefficient b, this is confirmed by the values of the mean and standard deviation of
each coefficient (Table 3).
Healthy Presymptomatics Patients
0
5
10
15
20
Healthy Presymptomatics Patients
0
5
10
15
20
25
Healthy Presymptomatics Patients
2
4
6
8
10
12
14
Fig.4. Coefficients a (left), b (center) and c (right) of gamma fitting function vs category.
Healthy Presymptomatics Patients
8
10
12
14
16
18
20
22
Healthy Presymptomatics Patients
10
20
30
40
50
60
70
80
Healthy Presymptomatics Patients
0
10
20
30
40
50
60
Fig.5. Coefficients a (left), b (center) and c (right) of Gauss1 fitting function vs category.
Table 3. Means and standard deviations of coefficients of Gauss1 fitting function.
Category Coefficients
a b c
mean std mean std mean std
Healthy 14,1 3,1 22,8 6,0 11,8 4,2
Presimptomatics 14,2 2,5 30,6 8,3 18,3 6,3
Patient 15,8 2,4 57,9 10,2 36,4 9,1
4 Discussion
Simple visual inspection reveals higher performance of Gauss series over gamma func-
tion. Regardless of the number of terms, Gauss series are better valued in terms of the
92

fitting performance. Additionally Gauss1 and Gauss2 have very low failing rates, as
compared to gamma function or Gauss series of higher orders, an appropriate selection
of initial is very difficult when the number of coefficients increases.
This superiority is consistent with the numerical results of two of the most used
parameters to assess the goodness of fit: the Pearson’s correlation coefficient and the
RMSE value. For both parameters gamma function has a poorer performance with
respect to Gauss series. Although the Pearson’s correlation coefficient is above 0.95,
which can be considered an expression of a good fitness for all the functions, there exist
an considerable difference of gamma and one term Gauss series with respect to Gauss
of 2 terms or higher. The lack of an enough number of records inhibits to do a consistent
analysis of the behaviour of the fitting coefficients for the studied functions, this is more
evident for Gauss series with a higher number of terms. However a comparison with a
limited set of register for Gauss1 and gamma could be made, in order to evaluate the
clustering ability of the coefficients taken separately. For gamma function only b seems
to be able to identify between healthy subjects and patients of ataxia, presymptomatics
are located in a middle overlap zone with respect to the two extreme groups.
Similar results were found for coefficients b and c of the Gauss1 series. The vi-
sual inspection and the analysis of mean and standard deviation were in coincidence to
identify coefficient b of Gauss1 as the best to classify subjects. No data was available
concerning other significant medical variables to correlates the condition of presymp-
tomatics with the value of b, but it is reasonably to believe that b could be a significant
marker of the progression of the disease, even before other symptoms are to be present.
These results were not improved when more than one coefficient was used for cluster-
ing, in fact visual inspection revealed the presence of linear correlation between b and
c for Gauss1.
5 Conclusions
In this contribution two fitting function has been evaluated for modelling of saccadic
pulse component obtained by the application of ICA to electro-oculographic records,
gamma function and Gauss series. Both models have achieved to describe the wave-
form of the signal in its active area, confirmed by the analytical results. Accordingly to
the trade off between successful fittings and quality Gauss2 could be considered as the
best choice, although the presence of two terms implies the need of 6 coefficients. On
the other hand the use of only one of the coefficients of Gauss1 proved to be a good
feature to classify subjects in the extreme categories of patients and healthy subjects,
and as a probable indicator of the condition of presymptomatics, however these results
must be considered preliminaries and further research is necessary to explain relation-
ships between the condition of the subjects and the coefficients derived from modelling.
References
1. Fahey M. C., Cremer P. D., Aw S. T., Millist L., Todd M. J., White O. B., et al. Vestibular,
saccadic and fixation abnormalities in genetically confirmed Friedreich ataxia. Brain. 1 de
93

abril de 2008;131(4):1035-45.
2. Hutton J. T., Albrecht J. W., Kuskowski M, Schut L. J. Abnormal ocular motor function
predicts clinical diagnosis of familial ataxia. Neurology. 1987;37(4):698-701.
3. B¨urk K., Fetter M., Abele M., Laccone F., Brice A., Dichgans J., et al. Autosomal dominant
cerebellar ataxia type I: oculomotor abnormalities in families with SCA1, SCA2, and SCA3.
J Neurol. 1999;246(9):789-97.
4. Moschner C., Perlman S., Baloh R. W. Comparison of oculomotor findings in the progressive
ataxia syndromes. Brain. 1994;117(1):15-25.
5. Vel´azquez P´erez L., S´anchez Cruz G., Canales Ochoa N., Rodr´ıguez Labrada R., Rodr´ıguez
D´ıaz J., Almaguer Mederos L., et al. Electrophysiological features in patients and presymp-
tomatic relatives with spinocerebellar ataxia type 2. J Neurol Sci. 15 de diciembre de
2007;263(1-2):158-64.
6. Robinson D. A. Models of the saccadic eye movement control system. Biol Cybern. 1 de
junio de 1973;14(2):71-83.
7. Chen Y-F., Chen T., Semmlow J. L. Decomposition of Control Signals for Saccade and
Vergence Eye Movements Using Independent Component Analysis. J Med Biol Eng.
2004;24(1):23-8.
8. Lin H-H., Chen Y-F, Chen T., Lee Y-Y. Decomposition of saccadic pulse and step com-
ponents by independent component analysis. Proceedings of the International Confer-
ence on Mathematics and Engineering Techniques in Medicine and Biological Sciences,
METMBS’04 [Internet]. 2004 [citado 3 de diciembre de 2008]. p. 124-8.
9. Chen Y-F., Lee Y-Y., Huang M-W., Du Y-C., Chen T. Analysis of decomposed saccadic
pulses and steps by independent component analysis for patients with brain stem lesions.
Proceedings of the 2005 International Conference on Mathematics and Engineering Tech-
niques in Medicine and Biological Sciences, METMBS’05 [Internet]. 2005.
10. Rojas F., Garc´ıa R. V., Gonz´alez J., Vel´azquez L., Becerra R., Valenzuela O., et al. Identifi-
cation of saccadic components in spinocerebellar ataxia applying an independent component
analysis algorithm. Neurocomputing. 9 de diciembre de 2013;121:53-63.
11. Semmlow J. L., Yuan W. Adaptive Modification of Disparity Vergence Components:
An Independent Component Analysis Study. Invest Ophthalmol Vis Sci. 1 de julio de
2002;43(7):2189-95.
12. Alvarez T. L., Daftari A., Semmlow J. L. Independent Component Analysis of Divergence
Eye Movements. Neural Engineering, 2005 Conference Proceedings 2nd International IEEE
EMBS Conference on. 2005. p. 608-11.
13. Bell A. J, Sejnowski T. J. An information-maximization approach to blind separation and
blind deconvolution. NEURAL Comput. 1995;7:1129-59.
14. Kolenda T. ICA Infomax Matlab implementation. 2003.
15. Van Opstal A. J., Van Gisbergen J. A. M. Skewness of saccadic velocity profiles: A unifying
parameter for normal and slow saccades. Vision Res. 1987;27(5):731-45.
94
