
Swarm Behavioral Sorting based on Robotic Hardware Variation
Beining Shang, Richard Crowder and Klaus-Peter Zauner
Electronics and Computer Science, Faculty of Physical Sciences and Engineering,
University of Southampton, Southampton, SO17 1BJ, U.K.
Keywords:
Swarm Robot Simulation, Hardware Variation, Sorting, Behavioral Heterogeneity.
Abstract:
Swarm robotic systems can offer advantages of robustness, flexibility and scalability, just like social insects.
One of the issues that researchers are facing is the hardware variation when implementing real robotic swarms.
Identical software can not guarantee identical behaviors among all robots due to hardware differences between
swarm members. We propose a novel approach for sorting swarm robots according to their hardware differ-
ences. This method is based on the large number of interactions between robots and the environment. Indi-
vidual robot’s unique hardware circumstance determines its unique decision and reaction during each robotic
controlling step, and these unique local reactions accumulate and contribute to the robot’s global behavior.
Accordingly by separating these hardware-triggered global behaviors, swarm robots can be sorted according
to their hardware variations.
1 INTRODUCTION
Swarm robotic research is either simulation–based or
hardware–based. In hardware–based swarm robotics,
one of the issues’ researchers face is the hardware dif-
ferences between swarm members. Although such
differences are very small, identical software in ev-
ery member of the swarm, does not necessarily re-
sult in identical behavior due to the amplification by
the non-linear controller, and interactions between the
robots and environment.
It has been argued that behaviors of identically
trained robots in the same environment are subject
to divergence due to hardware variations generated
by component manufacture, the assembly process
and wear–and–tear (Shang et al., 2013). It was
found out through simulated obstacle avoidance ex-
periments (Pugh and Martinoli, 2007) that both ge-
netic algorithms and particle swarm optimization can
not withstand different types of sensor variations in-
cluding offsets and scaling factors. It was further (El-
liott and Shadbolt, 2003) argued that although it is
very difficult and not cost-effective, identical behav-
iors of hardware-based robots in a swarm is still pos-
sible, where the software is fine-tuned to compen-
sate the inherent hardware differences. The retun-
ing process has to be repeated at regular intervals
due to constant wear–and–tear (Roth et al., 1987).
Although some researchers have focused on utiliz-
ing different hardware equipments to develop swarm
robotic systems which are heterogeneous on the hard-
ware level (Dorigo et al., 2013; Parker, 1994), still
it can not be ignored that hardware variation always
exist and influence robotic behaviors.
In this paper, we propose a novel approach to sort
swarm robots based on their behavioral differences
which are caused by hardware variations. The sort-
ing of robots is useful in two ways: the efficiency
of swarm can be increased by allocating tasks to
sorted robots, and expensive calibration process can
be avoided for low cost swarm robots by using this
self-sorting method.
To achieve the required sorting, we consider the
performance characteristics of a large number of sim-
ple robots suitable for operating in a swarm, that con-
tain variations of their component parameters. After a
large number of interactions with the environment, in-
dividual robots shows difference behaviors, it is found
that robots with similar behaviors have similar hard-
ware differences.
In Section 2, we discuss the source of hardware
variations, and presenting our argument that it is fea-
sible to separating robots against their hardware vari-
ations according to their behavioral differences. Fol-
lowing this discussion, we describe the design of the
simulation in Section 3 including modeling the robots
and testing methods. The results are presented and
discussed in Section 4, with the conclusions in Sec-
tion 5.
631
Shang B., Crowder R. and Zauner K..
Swarm Behavioral Sorting based on Robotic Hardware Variation.
DOI: 10.5220/0005111006310636
In Proceedings of the 4th International Conference on Simulation and Modeling Methodologies, Technologies and Applications (SIMULTECH-2014),
pages 631-636
ISBN: 978-989-758-038-3
Copyright
c
2014 SCITEPRESS (Science and Technology Publications, Lda.)

2 PROBLEM DESCRIPTION
Irrespective of the manufacturing and assemble pro-
cesses, real swarm robots come with hardware varia-
tions. even if they are built to the same design. Fig 1
illustrated some of the reasons which cause variations
at hardware level in in a swarm robot.
An example of components variation would be
that the same type of sensors on two robots have dif-
ferent sensitivity (Pugh and Martinoli, 2007). Actua-
tors and batteries can have individual characteristics.
For mobile robots, the tires of the wheels are often
made from rubber to improve traction, which makes
it rather difficult to manufacture with exactly the same
diameter (Borenstein, 1996). Furthermore asymmet-
ric load distribution will make tire compress differ-
ently, resulting different wheel diameters in practice.
In the assembly phase, positions of components and
soldering parameters vary. For instance, sensors can
be placed with slightly different orientations during
soldering, or the quality of soldering joints influence
the maximum current, thus the driving ability of the
motors varies. In addition, alignment of sensors or
wheels may have minor difference. In use, the robots
experience differences in wear and tear, including
sensor aging, battery draining, mechanic deteriora-
tion, or even damage.
manufacture
use
Assembly
Variation
Components
Variation
Wear
and Tear
sensitivity
accuracty
motor
characteristics
components
position
soldering
deterioration
damage
Figure 1: The causes of hardware differences: reasons
which can cause robots different in their hardware are listed.
They are categorized based on robot’s timeline: when robot
is manufactured and used. During manufacture, variations
exist in components’ sensitivity, accuracy, driving ability
etc. During assembly, components’ placement and solder-
ing parameters varies. When using swarm robots, differ-
ent damage and deterioration situations are encountered by
robots. All of these circumstances are applied to robots’
hardware, which differentiate them. This list is not ex-
hausted.
In practice, it is very difficult to get accurate val-
ues for each parameter within a complex robotic sys-
tem. In addition, all measurements have to be taken
on each of the robots within the swarm. Furthermore,
due to the constant wear and tear, this has to be re-
peated at regular intervals. Therefore it is not feasi-
ble to modify the performance manually according to
their hardware variations. Although it is difficult to
get the values for all parameters, the behaviors of the
robot is related with its hardware circumstance. Both
the decisions and reactions of the robot are always de-
termined by its hardware circumstance. And these de-
cisions and reactions contributes to the robot’s global
behaviors. Therefore by categorizing robots’ behav-
iors, the sorting of robots according to their hardware
variations can be achieved.
3 SYSTEM MODELING
As discussed in the previous section, we consider a
conventional swarm robot prototype which can follow
a reflective line using two IR photoelectric sensors.
The modelling of this robot comprises two parts: a
model of the abstracted robot hardware and a model
of the expected deviation from the ideal prototype.
3.1 Modeling of the Robot
The basic features of the robot being simulated are
shown in Fig 2, it is a differentially steered, two
wheeled robot fitted with casters to the front and rear.
leftwheel
Wheel
rmotor
Motor
lsensor
Sensor
PI
V
0
Figure 2: Plan view of the robot and its controller arrange-
ment, showing two sensors in the front and two wheels on
each side. The diagram on the robot explains its control
mechanism: Voltage difference between outputs of the two
IR sensors are amplified by a PI amplifier and then fed to
the motors after adding a constant voltage V
0
which keeps
the robot moving forward.
3.1.1 IR Sensor
The two IR sensors located at the front of the robot
point downwards to measure the reflected light from
the surface beneath the robot, including any reflective
track. The sensor’s response (Benet et al., 2002) as
SIMULTECH2014-4thInternationalConferenceonSimulationandModelingMethodologies,Technologiesand
Applications
632

voltage is modeled using Eq. 1,
V = β + α
Z
]v
0
1
x
2
cosθdθ (1)
where α is the sensitivity of the sensor, and β mod-
els the sensor’s offset and the effect of ambient light.
The sensors response to individual reflective elements
within the sensor’s viewing angle ]v is a function of
the incidence angle of the reflective light θ and the
distance x between the sensor and the reflecting point
(Shang et al., 2013).
3.1.2 Controller
The robot uses a conventional PI (proportional and
integral) controller to control the robot position along
the reflective line. The control algorithm of the robot
can be expressed using Eq. 2. The schematic diagram
of the controller is illustrated in Fig 2.
δ(t) = V
Ls
(t) −V
Rs
(t)
V
out
(t) = p δ(t) + i
Z
t
−∞
δ(t)dt
V
Lm
(t) = V
0
−V
out
(t)
V
Rm
(t) = V
0
+V
out
(t)
(2)
The voltage difference δ between the left and right IR
sensor V
Ls
, V
Rs
is fed to the PI amplifier, the result V
out
is used to offset the driving voltages for the left and
right motors.
3.1.3 Drivetrain
A conventional differential drivetrain system is used.
Output voltages from the controller power the left and
right motors. Eq. 3 shows the motor model used,
which includes any gearbox used.
ω
L
=V
Lm
m
L
ω
R
=V
Rm
m
R
(3)
where ω is the angular speed of the wheels. The mo-
tors are modeled as pure gain, m between the output
of the controller and the wheel speed to simplify the
model of the motor and any gearbox, hence.
˙x
˙y
˙
φ
=
−
r
L
sinφ
2
−
r
R
sinφ
2
r
L
cosφ
2
r
L
cosφ
2
−
r
L
d
r
R
d
ω
L
ω
R
(4)
where d is the distance between the wheels, and r
L
and r
R
are the individual wheel’s radius. Based on the
wheels’ angular speed, the linear change of robotic
position (˙x and ˙y) and orientation (
˙
φ) can be calcu-
lated.
3.2 Modeling of Hardware Variations
Sensors and actuators can remarkably influence the
performance of the swarm robots behavior. Consider-
ing each robot as an continuous robotic system, sen-
sors and actuators functions as its input and output.
Any tiny difference on these components propagated
through each of robot. Thus the robotic behaviors are
influenced, and was confirmed in our earlier paper
(Shang et al., 2013). Therefore variations simulated
in this work are the robot’s IR sensors, motor gear
boxes and the two wheels.
Variation on IR sensor can normally be found on
its performance parameters including sensitivity α,
viewing angle ]v. In addition, when fitting sensors
to the robot, variation can occurs due to misalignment
of sensor orientation. In general parameters on which
the assembly variation include sensor height (h), sen-
sor lateral offset (O
l
) and sensor sagittal offset (O
s
).
To effectively model the variation found on the motor
gearbox and wheel, the following parameters are con-
sidered: motor gearbox gain (m), wheel radius (r) and
the distance between two wheels (d). In total there
are 13 parameters. Apart from wheel separation, the
rest of the parameters appear twice as there are two
IR sensor and two drive train systems on one robot.
Hardware variation across individual robot in a
swarm are different, the values of the same parame-
ter on all the robots follow a Gaussian distribution.
In this case, a standard robot was firstly generated
with all its parameters values measured according to a
real robot. By varying the parameter values for a ran-
domly generated percentage, the rest of its kind were
then modeled.
Table 1: The parameters of the robot are varied with
Gaussian-distributed random numbers which have different
distributions. ‘L’, ‘M’, ‘S’ denote for large, medium, small
sigma values.
Component Parameter Description Sigma
IR sensor
α gain S
]v view angle S
h height M
O
l
lateral M
O
s
sagittal M
Drivetrain m gain L
Wheel d separation L
In reality the deviations for the values of the
robots’ parameters can be different. Therefore three
sigma values (large deviation σ = 0.05, medium de-
viation σ = 0.03, small deviation σ = 0.01) are used
to generate random number sequences with different
distributions. Sensor gain and viewing angle are mod-
eled with small sigma value due to more strict quality
SwarmBehavioralSortingbasedonRoboticHardwareVariation
633

control during manufacture. Sensor assembly varia-
tion (sensor height, lateral offset and sagittal offset)
are comparably small comparing with variations on
the motor and gearbox gain, and wheel separation.
Details of robotic parameters and the sigma values for
Gaussian process are summarized in Table 1.
3.3 Training
A total of approximately 210 different robots were
generated and then individually trained using a sim-
ple line-following task for the optimal coefficients of
the PI controller using exhausted search method. A
single period sinusoid reflective line was used, as the
robot’s ability of both turning right and left would be
trained without any bias. During training all robots
have the same initial training condition: they all starts
with exactly the same position located at the begin-
ning of the sinusoid line with exactly the same orien-
tation. For every robot, this task will be repeated for a
number of times to test different sets of controller co-
efficients. The controller parameters which help the
robot achieve the best accuracy in terms of following
the target line will be chosen as the optimal parame-
ters.
To evaluate the training results, the trajectory of
each robot which is achieved with the optimal param-
eters is nearly the same with the shape of one period
of sinusoid. Therefore, the uniform training method
has helps the robots to achieve almost the same trajec-
tories. In other words, the optimal parameters com-
pensate the hardware difference among robots and
similar behaviors have been generated.
3.4 Testing
After training, robots were then tested in the testing
arena illustrated in Fig 3. The testing arena is a long
rectangle shaped area. A large number of short re-
flective lines are drawn in the arena with randomized
orientations. All lines sit on the grid, so that they do
not overlap each other. The initial condition for all
robots are the same: they all start on the left hand side
of the arena with the same location, same orientation.
While robots were doing the line-following task and
interacting with the reflective lines in the arena, the
following assumption was made. In the simulation we
consider that there is a constant “wind” from the left
to the right of the arena, which can influence a robot’s
speed and orientation. This is analogous to a small
sail on top of each robot. If there exists difference be-
tween the direction of the wind and orientation of the
robot, a force will be applied to the robot by the sail
so that the orientation of the robot will change to con-
form to the wind direction and also a subcomponent
of speed to the right will be applied to the robot.
Figure 3: A small square-shape region has been magnified,
allowing the length of the line and robot compared. The
starting point of each robots and their orientation is denoted
by the arrow. The size of the robot is 10×10 in arbitrary
unit. The arenas dimension is in the same unit.
Within the model, if the orientation of the robot
and direction of the wind is different, the speed of
each robot at each simulation step is the vector addi-
tion of the robotic autonomous speed and a subcom-
ponent of speed which is due to the blowing wind, and
an angular speed is added to the robot which force the
robot to orientate to the right. The reason of making
this assumption is that in order to separate all robot as
loosely as possible, a tendency of moving to the right
of the arena for all robots has to be enforced.
To further reduce the complexity of the problem,
all robots will be separated based only on their po-
sition on the arena’s x axis. Therefore when the
robots go beyond either upper or lower boundary of
the arena, it is assumed that they will be picked up
and put into the arena from the other side which is
the lower or upper boundary accordingly with main-
tained orientation. In this case, the position of robots
with reference to the arena y axis will not matter any
more.
Given the size of the arena, robots are able to run
in the arena for extended periods of time, thus robots
can be separated along the x axis as loosely as possi-
ble.
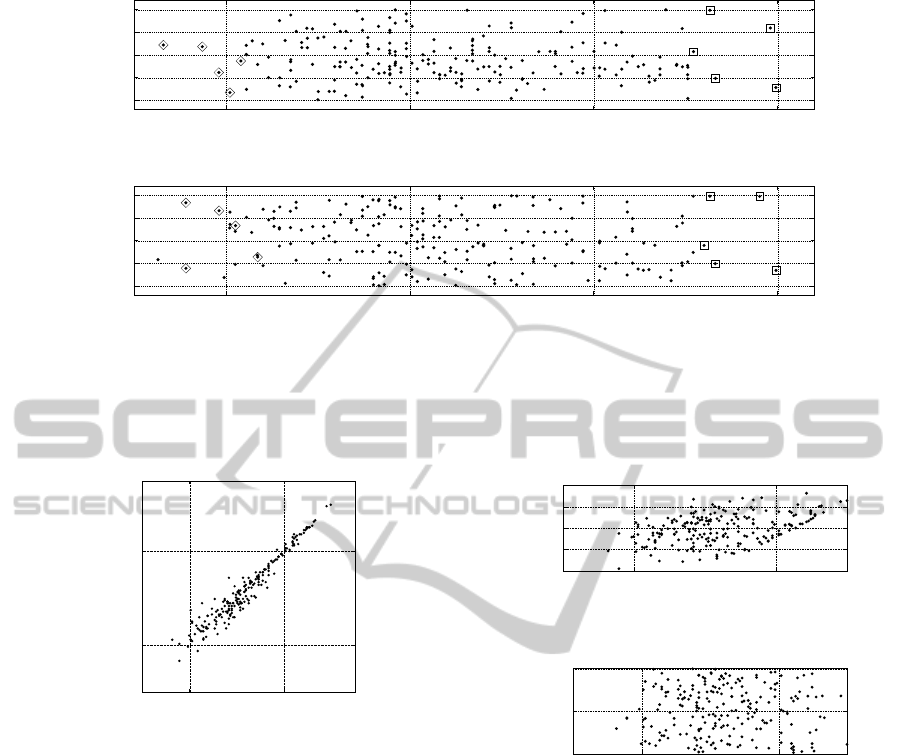
4 RESULTS AND DISCUSSION
Approximately 210 robots have been simulated in two
arenas (Arena1 and Arena2). Results are shown in
Fig 4 and 5. The only difference between Arena1
and Arena2 is the orientation of the reflective patterns.
According to the results from both arenas, it is found
out that some robots consistently led in the front or
left behind in both arenas.
As shown in Fig 5, the rank of robots in terms of
x coordinates for their end points after a fixed sim-
ulation period are almost consistent in both arenas.
SIMULTECH2014-4thInternationalConferenceonSimulationandModelingMethodologies,Technologiesand
Applications
634
0
250
500
750
1000
1e+07 1.1e+07 1.2e+07 1.3e+07
Arena1 y
Arena1 x
(a) Farthest and Nearest 5 Robots Location in Arena2
0
250
500
750
1000
1e+07 1.1e+07 1.2e+07 1.3e+07
Arena2 y
Arena2 x
(b) These Robots Location in Arena2
Figure 4: The size of the arenas is in arbitrary unit. Dots in both figures denote the location of robots after the same time. In
Fig 4(a), dots with square markers are the fastest five robots in Arena1. These robots also ranked in the top five in Arena2
(square markers) in terms of their end point distance to the starting point. Robots which are near to the starting point in
Arena1(marked with diamond) also trail in Arena2(diamond markers).
1e+07
1.2e+07
1e+07 1.2e+07
Arena2 End Points x Value
Arena1 End Points x Value
Figure 5: The x axis values (in arbitrary unit) of the robots’
end points in Arena1 compared to those in Arena2. Robots
which were left behind in Arena1 were also left behind in
Arena2. It is the same for robots which run the fastest.
Therefore this approach is able to separate hardware-
varied robots according to their behavioral differences
regardless of the orientations of reflective elements in
the arenas.
After analysing the data, it is found out that all
robots which have travelled far had both strong drive
train system on the left and right, in Fig 6. This is
consistent with the experiment set-up that the wind
blowing effect applied on robots’ sail will force robot
to orientation to the right. In this case robots with
strong left and right motors finish their run the farthest
from the starting point.
However strong drive train system is only the nec-
essary condition for large distance between robots’
end points and the starting point: not all robots which
have large gain on their drive train system travelled
far. After analysing the hardware variation factors of
all robots with high gain on both their left and right
1.8
1.9
2
2.1
2.2
1e+07 1.2e+07
Sum[%]
Arena X
(a) Left and Right Motor Gain Sum
-0.01
0
0.01
1e+07 1.2e+07
Difference[%]
Arena X
(b) Left and Right Motor Gain Difference
Figure 6: The x axises of the two figures are in arbitrary
unit, the x coordinates of robots’ end points in the Arena1
is compared with robots’ motor gain variation factor (in per-
centage). It can be seen from the second figure that for all
robots, the gain difference between left and right drivetrain
system are very small. From the first figure, all robots which
travelled far have large gain on both left and right drive train
system.
drive train system, there is no clear pattern on other
robotic parameters. In other words, the distance be-
tween robotic end points and the starting point does
not depend on one or two parameters of the robots,
instead it is determined by the combination of multi-
ple parameters of each robot. To prove this, the robots
which end up at both far and near locations have been
clustered in the multiple dimensional space of their
parameters. In total, each robot has 13 parameters:
eight sensor related parameters, three drivetrain sys-
SwarmBehavioralSortingbasedonRoboticHardwareVariation
635

tem parameters and two parameters for PI controller
coefficients. Examples of clustering results are shown
in Fig 7. The sorting result shows that there are differ-
ent parameter settings for robots to travel either far or
near from the starting point. The x values of robotic
end points depend on the combination of all parame-
ters instead of individual parameter.
0.95 1 1.05 1.1 1.15 1.2 1.25 1.3
x 10
7
0
200
400
600
800
1000
4 Clusters of Robots in Arena1
Figure 7: The size of the arena is in arbitrary unit. The
end points of the three robots with left-oriented triangles
are all very far from the starting point. They are also near
to each other in their parameter space. It is the same for
robots with circle and square markers. However the end
point for the robot marked with upper triangle is near to the
starting points and it is not near to any other robots in the
parameter space, its unique parameter setting makes it have
this behavior.
5 CONCLUSION
In this work, we propose a novel approach for sorting
swarm robot according to their hardware variations.
A set of robots is derived from a standard robot by
adding minor variations in their parameters to model
the intrinsic hardware difference that exists in real
robotic swarms and they are then simulated in per-
forming a line following task in the arenas covered
with randomly oriented IR-reflective patterns. Results
show that this approach is able to sort the group of
robots according to their hardware differences. The
method of differentiating the robots through the accu-
mulated effect of numerous interactions with the en-
vironment is analogous to separating chemical mix-
tures by chromatography. This method is robust that
the sorting of the robots does not depend on the ori-
entations of the reflective patterns in the arena, but
on the hardware characteristics of individual robots.
Furthermore it is found out that the behaviors of indi-
vidual robot is not determined by a single parameter
but by the combinations of multiple hardware factors.
Different combinations of hardware parameters can
help robots achieve similar behaviors.
We view the model system explore the possibil-
ity of sorting swarm robots according to their hard-
ware variations in order to tackle the inequality exists
in real homogeneous robotic swarms. Future work
will focus on improving swarm efficiency by auto-
matically assigning tasks according to their hardware-
variation-triggered behaviors.
ACKNOWLEDGEMENT
This work was supported by Panzhihua ChangNing
Co., Ltd. The authors also acknowledge the use of
the IRIDIS High Performance Computing Facility,
and associated support services at the University of
Southampton, in the completion of this work.
REFERENCES
Benet, G., Blanes, F., Sim
´
o, J., and P
´
erez, P. (2002). Using
Infrared Sensor for Distance Measurement in Mobile
Robots. Robotics and Autonomous Systems, 40:255–
266.
Borenstein, J. (1996). Measurement and Correction of Sys-
tematic Odometry Errors in Mobile Robots. IEEE
Transactions on Robotics and Automation, 12:6.
Dorigo, M. et al. (2013). Swarmanoid: a novel concept for
the study of heterogeneous robotic swarms. In Robotic
& Automation Magazine, IEEE, volume 20, pages 60–
71.
Elliott, T. and Shadbolt, N. R. (2003). Developmental
robotics: Manifesto and application. Philosophical
Transactions of the Royal Society of London, Series
A, 361:2187–2206.
Parker, L. (1994). Heterogeneous multi-robot cooperation.
PhD thesis, MIT.
Pugh, J. and Martinoli, A. (2007). Parallel Learning in Het-
erogeneous Multi-Robot Swarms. In IEEE Congress
on Evolutionary Computation, pages 3839–3846, Sin-
gapore.
Roth, Z., Mooring, B., and Bavani, B. (1987). An Overview
of Robot Calibration. IEEE Journal of Robotics and
Automation, 3(5):377–385.
Shang, B., Crowder, R., and Zauner, K.-P. (2013). Simu-
lation of Hardware Variations in Swarm Robots. In
IEEE International Conference on Systems, Man, and
Cybernetics, pages 4066–4071, Manchester.
SIMULTECH2014-4thInternationalConferenceonSimulationandModelingMethodologies,Technologiesand
Applications
636
