
Development of a Practical Tool for
Exploring the Map of Technology
So Young Kim, June Young Lee, Hyesung Yoon and Hyuck Jai Lee
Korea Institute of Science and Technology Information, Hoegi-ro 66, Dongdaemun-gu, Seoul, Korea
Keywords: Map of Technology, Co-classification, Exploring the Map, Technology Search.
Abstract: This study suggests a way to utilize the map of technology as a guide to find new technology component.
Recent studies of mapping knowledge mainly focused on analyzing the map as a result of technological
innovation rather than utilizing the map for exploring the world of technological innovation. The
preliminary result of a case study suggests that a firm can find possible technology components that can be
combined with own technology component. The map of technology comprises the nodes of International
Patent Classification (IPC) main groups and the links presenting the co-assign relationship between the IPC
main groups.
1 INTRODUCTION
A well-defined strategy for research and
development (R&D) activity accelerates
technological innovation, resulting in developing
new products or streamlining processes.
Understanding the structure of knowledge
underlying technologies helps to set which a R&D
strategy is proper. The knowledge can be
represented as a network due to its own correlational
and retrieval-interpretative property (Saviotti, 2004).
The nodes of network represent knowledge
components and are connected by the links
representing the correlation or dependence of any
two connected nodes. For a decade, researchers have
tried to map not only the knowledge base of a
specific technology or science but also global
technologies or sciences.
Recent literatures of mapping science and
technology mainly have focused on analyzing the
structure and variation of the map as a result of
technological innovation rather than utilizing the
map for exploring the world of technological
innovation. One of basic functions of map is to
guide explorers. If the map of technology is
comprised of various technology components as
nodes and paths between the nodes, it can guide an
explorer from the starting point to the destination in
the view of technological innovation.
On the basis of the literature, this study suggests
a new way to utilize the map of technology as a
guide to find a new technology component. The new
technology component can be the innovation
opportunity in itself and also one of the materials for
recombination of technologies toward the
innovation. This study aims to develop a practical
tool to create and explore the map of technology. A
case study using our tool demonstrates the logical
basis of the tool.
2 RESEARCH BACKGROUND
2.1 Research Question
Two questions motivate us to start this study.
Is the map of technology able to guide a
researcher or a firm to the potential area of
technological innovation?
How can we find the best path to the target
technology from an existing one of a
researcher or a firm for recombination or
transition?
Creating the map of technology is the start point
to find the best path from one technology component
to another component. The map comprises a number
of nodes (technology components) and links
(relationship between them). We have to choose
what particular fact assigns the link between two
85
Kim S., Lee J., Yoon H. and Lee H..
Development of a Practical Tool for Exploring the Map of Technology.
DOI: 10.5220/0005107600850090
In Proceedings of 3rd International Conference on Data Management Technologies and Applications (DATA-2014), pages 85-90
ISBN: 978-989-758-035-2
Copyright
c
2014 SCITEPRESS (Science and Technology Publications, Lda.)

technology components. Previous studies have dealt
with the map of technology and its rationale in
related literature for decades. The next subsection
reviews those studies.
2.2 Related Literatures
In the last decade, several studies introducing the
global map of knowledge have come into the
spotlight. Schoen and his colleagues (Schoen et al.,
2012) created the global map of technology using
the 389 technological fields extended from the
WIPO’s 35 classes of technology. Leydesdorff and
Rafols later suggested the global map of science
using the subject categories of journals (Leydesdorff
and Rafols, 2009). Approaches to map the
technological or scientific knowledge base were
fulfilled from macro to micro level, such as
investigating a particular domain of technology
(Krafft et al., 2011), analyzing a knowledge base of
a particular firm or an organization (Özman, 2007),
and further illustrating characteristics of a firm’s
R&D activity or strategy using the firm’s knowledge
base (Sakata et al., 2009).
Although a handful of studies tried to utilize the
map of technological knowledge, the interests of the
studies were restricted to the structure and variation
of the map. They suggested that the technological
innovation may emerge from the recombination of
existing technology components (Fleming and
Sorenson 2004). The map of technology of a
particular firm was created using the classification
system of patent documents and the citation
relationship between the documents. The map was
used to identify the elements of recombination and
evaluated with the innovation as a result from the
recombination.
What is assigned to the relationship between two
technologies is an interesting topic in the research
area of technology mapping. A citation relationship
is one of the common examples to connect two
technological nodes. Researchers utilized the
citation relationship between patents to measure the
technology spillover from an industrial sector to
another (Verspagen, 1997) or to trace the evolution
of technology (Verspagen, 2007). However, patent
citation may be inappropriate to illustrate the
relationship between technologies or the distance
between them (Hinze et al., 1997). A co-
classification relationship in patent classification
such as the International Patent Classification (IPC)
provided by WIPO is another example to connect
two nodes. Some researchers connect two
technologies represented by IPCs in which a patent
is co-classified (Krafft et al., 2011; Scheon et al.,
2012; Sakata et al., 2009).
3 MODEL FRAMEWORK
3.1 Map of Technology
In this paper, we regard IPC codes assigned a patent
as technology components comprising the invention
presented in a patent. These IPC codes are nodes of
the network in the map of technology. In the
hierarchical structure of IPC, this study uses a main
group to illustrate a particular technology
component whereas previous studies considering the
global map of technology uses class level (3-digit)
or subclass level (4-digit). Class and subclass levels
are too broad to describe a particular technology
component of a patent. Although subgroups are at
the most specific level, because of the differences in
the levels of technologies, IPC subgroups cannot be
compared each other on the same hierarchy.
Co-classification of IPCs in the same patent
assigns links between the two IPC nodes in the map
of technology. The weight of link can be calculated
by various methods such as a similarity between two
IPC codes (Leydesdorff, 2014), or a relatedness
between them (Nesta and Saviotti, 2005).
3.2 Search and Evaluation in the Map
The network of technology component with nodes of
IPC main group has a very complex structure
because a particular node of technology component
can be connected to several nodes among thousand
nodes in the map and each pair of nodes may have
multiple routes to connect them. To guide an
explorer on the technology map efficiently, multiple
routes have to be compared in terms of weight.
If the start and destination are determined, the
shortest path search algorithms can help the process
of comparing multiple routes and select the most
appropriate route. When the destination is not
decided, the explorer should consider multiple nodes
for the destination and compare the routes for each
candidate destination repeatedly.
Previous works have produced a number of
studies for searching nodes and evaluating attributes
of links in a complex network for decades (Newman,
2003). Social scientists have focused on searching
nodes and finding paths in the social network studies
including recommendation algorithm (Kautz et al.,
1997; Wu et al., 2013)
DATA2014-3rdInternationalConferenceonDataManagementTechnologiesandApplications
86
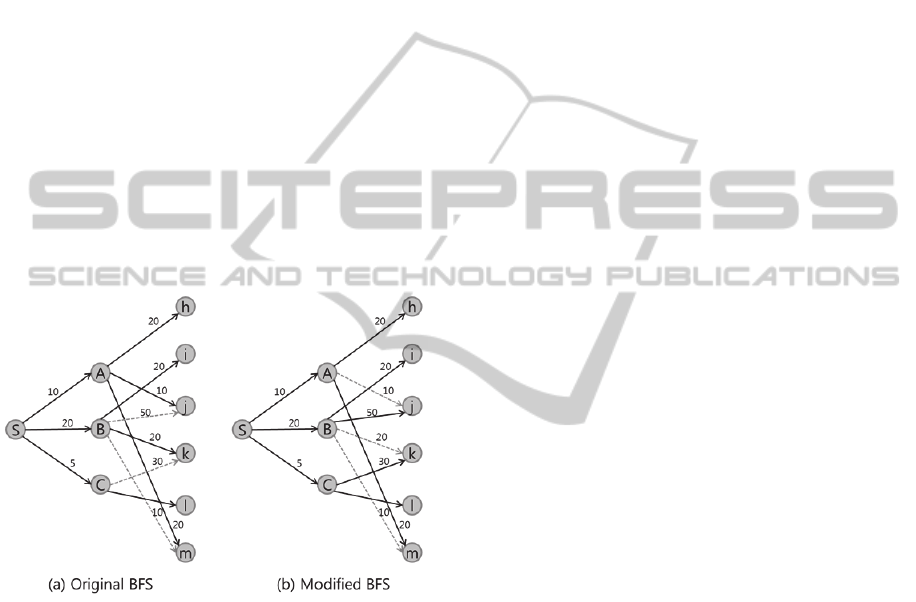
In this study, we modified the breadth first
search (BFS) algorithm to search the connected
nodes (technology components). The BFS is an
algorithm for searching nodes exhaustively in the
network or graph. The BFS provides one of the
shortest paths between nodes without considering
weights of paths. The modified BFS prioritizes the
node have a higher weight such as a co-assigned
frequency or a link-creation year with the start node.
The discovered nodes as a result of the modified
BFS form the tree of technology candidates to transit
from the start node or to be combined with the start
node.
Figure 1 compares the original and the modified
BFS algorithm. In original BFS (a) and modified
BFS (b), an explorer starts from node S can find
nodes A, B and C as the first destination in the first
step. However, node j in the second step is
connected with node B in modified BFS instead of
node A in original BFS because the weight of link
between node B and j is greater than it between node
A and j.
Figure 1: The original and modified BFS.
4 CASE STUDY
4.1 Data
We analyzed all patents granted by USPTO from
2007 to 2011. 10,054 IPC main groups are extracted
from total 1,052,974 patents granted. The number of
IPC main groups is around seven thousand in a
particular version of IPC according to the WIPO’s
announcement on their website. Ten thousand of
main groups of this study contain main groups
defined by different versions of IPC in order to
cover the main groups exhaustively during the time
period of analysis.
The number of unique links connecting two IPC
main group nodes directly is 3,017,065, and it means
that a particular IPC main group node has 6
connections to the other node on average per year. In
the case study, only 1,217,206 links are regards as
effective links created by which two IPC main
groups are co-assigned to the same patent at least 5
times for 5 years.
The global map of technology cannot be
presented in this study because of the huge number
of nodes and links. This paper, instead, shows a
local map of routes from the determined start to
multiple destinations. The case study illustrates the
process to search candidate destination nodes and to
compare their routes.
4.2 Preliminary Results
What technology components are good candidates
for a firm to combine with its existing technology
components? Let us assume that an imaginary
company “A” mainly producing fluoropolymer
coated films seeks new technology components that
can be combined with the existing one. Most of A’s
patents are classified as B32B 7/00 among the IPC
main group. Then, company A can explore the map
of technology from B32B 7/00 main group as the
start node.
WIPO defines the IPC main group B32B 7/00 as
follows:
Layered products characterised by the relation
between layers, i.e. products essentially
comprising layers having different physical
properties or products characterised by the
interconnection of layers
From 2007 to 2011, 977 granted patents have
been classified as B32B 7/00 by USPTO and the
compound average grow rate of the patents was
14.85%. Major assignees were Nitto Denko
Corporation, 3M Innovative Properties Company,
Avery Dennison Corporation, Lintec Corporation
and so on.
B32B 7/00 was co-assigned to the same patent
with 64 other main groups in the first step during
five years granted patent data. It means that 64
technology components have been combined with
the technology component described by B32B 7/00
main group at least five times within five years.
B32B 7/00 ranks top 15% in the number of co-
assigned main groups that have been combined with
it at least once.
From the second step, the process of finding
candidate destination nodes adopts the modified
BFS. In the second step search, 794 unique main
DevelopmentofaPracticalToolforExploringtheMapofTechnology
87
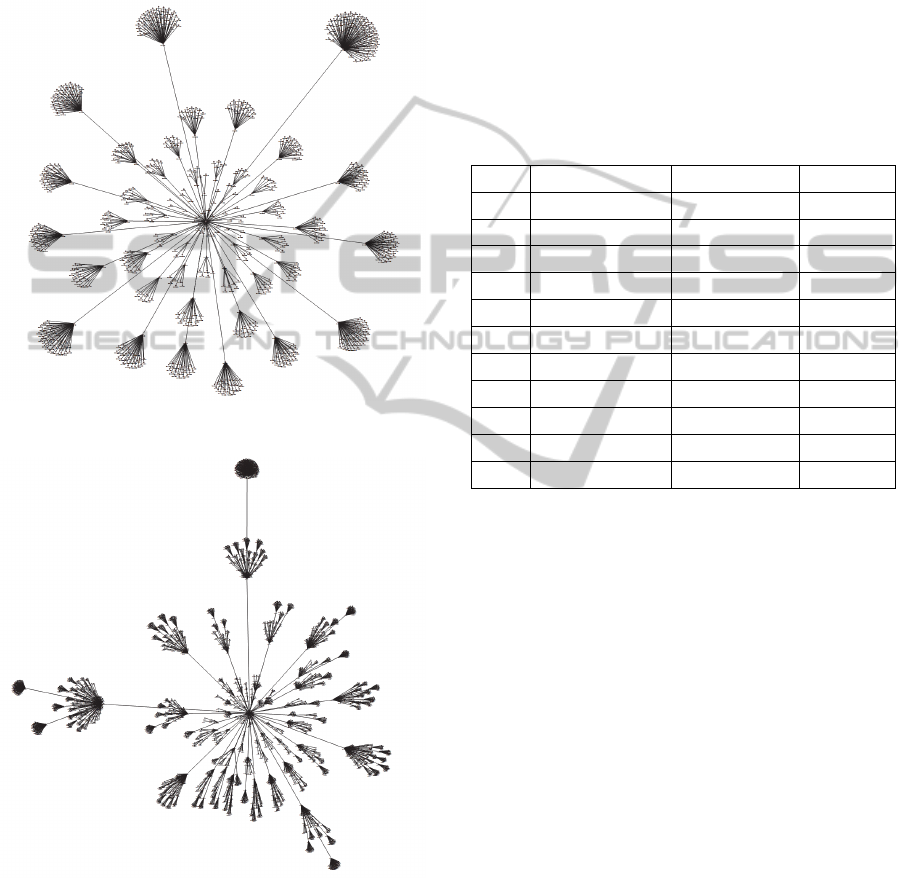
group nodes were discovered with 2,345 direct
routes from 64 main group nodes discovered in the
first step. 1,615 unique nodes were identified with
6,856 routes in the third step search. Figure 2
presents the global view of searching process in the
second and the third steps.
(a)
(b)
Figure 2: Searching trees from B32B 7/00 main group to
the second step (a) and the third step (b).
Table 1 shows highly ranked technology
components in the number of patent co-classified as
the start (B32B 7/00) and the first destination IPC
main groups (co-assigned frequency). It also
presents the average year of patents granted. The top
nine components are similar technology components
to the start main group. C08K 5/00 and B05B 5/00
are far from the start and belong to other subclasses
and classes. WIPO describe two main groups as
follow.
C08K 5/00: Use of organic ingredients
B05D 5/00: Processes for applying liquids or
other fluent materials to surfaces to obtain
special surface effects, finishes or structures
Table 1: Top 10 IPC main groups in the first step.
Rank 1
st
Destination Average year Frequency
1 B32B 27/00 2009.20 205
2 B32B 15/00 2009.33 140
3 B32B 3/00 2009.49 121
4 B32B 5/00 2009.25 107
5 B32B 9/00 2009.66 98
6 B32B 37/00 2009.48 58
7 B32B 33/00 2009.73 52
8 B29C 65/00 2009.89 35
9 B32B 17/00 2009.48 25
10 C08K 5/00 2010.22 23
10 B05D 5/00 2009.61 23
Table 2 shows highly ranked technology
components in the second step in the co-assigned
frequency. It presents the second destinations with
the average year (Av. year) and the number (Freq.)
of patent granted in the second step. Further, it also
presents the first destinations discovered by the first
step search and the sum of frequencies of the two
steps (Sum of freq.).
The result from the second step shows that the
start technology component can reach very
dissimilar technology components. In top 10
components, H01L 31/00 and 27/00 are combined
with the start recently. The following WIPO
descriptions illustrate these two main groups.
H01L 31/00: Semiconductor devices sensitive
to infra-red radiation, light, electromagnetic
radiation of shorter wavelength, or
corpuscular radiation and specially adapted
either for the conversion of the energy of such
radiation into electrical energy or for the
control of electrical energy by such radiation;
Processes or apparatus specially adapted for
the manufacture or treatment thereof or of
parts thereof; Details thereof
DATA2014-3rdInternationalConferenceonDataManagementTechnologiesandApplications
88

H01L 27/00: Devices consisting of a plurality
of semiconductor or other solid-state
components formed in or on a common
substrate
Table 2: Top 10 IPC main groups in the co-assigned
frequency in the second step.
Rank 2
nd
Destination Av. year Freq. 1
st
Destination.Sum of freq.
1 H01L 29/00 2009.37 1645 H01L 21/00 1654
2 C23C 16/00 2009.36 786 H01L 21/00 795
3 H01J 63/00 2009.29 649 H01J 1/00 654
4 H05K 7/00 2009.00 570 H01L 23/00 578
5 C23F 1/00 2009.36 546 H01L 21/00 555
6 G11B 21/00 2008.88 546 G11B 5/00 552
7 H01L 31/00 2009.44 500 H01L 21/00 509
8 H01L 27/00 2009.56 480 H01L 21/00 489
9 G02B 6/00 2008.83 391 G02F 1/00 400
10 C08L 63/00 2009.27 180 B32B 27/00 385
Table 3 shows highly ranked technology
components in the second step in the average link
creation year. B60K 15/00 and C08G 67/00 are in
the set of most recently combined with the start and
co-assigned frequently. The following WIPO
descriptions illustrate these two main groups.
Table 3: Top 10 IPC main groups in the average link
creating year in the second step.
Rank 2
nd
Destination Av.year Freq. 1
st
Destination. Sum of freq.
1 C07D 235/00 2010.60 5 C09B 67/00 10
2 C08L 29/00 2010.50 14 C08L 33/00 21
3 C09B 57/00 2010.20 5 C09B 67/00 10
4 C08L 55/00 2010.16 6 C08L 33/00 13
5 C08L 47/00 2010.00 5 C08L 33/00 12
6 A21C 3/00 2010.50 6 B29C 47/00 16
7 B60K 15/00 2011.00 5 C08K 5/00 28
8 C08G 67/00 2010.75 8 C08K 5/00 31
9 C08G 61/00 2010.15 13 C08G 73/00 18
9 C07F 1/00 2010.28 7 C07F 7/00 12
B60K 15/00: Arrangement in connection with
fuel supply of combustion engines; Mounting
or construction of fuel
C08G 67/00: Macromolecular compounds
obtained by reactions forming in the main
chain of the macromolecule a linkage
containing oxygen or oxygen and carbon, not
provided for in groups C08G 2/00-C08G
65/00
After exploring the map of technology, company
“A” producing coated films may consider the
technology component contributing to develop solar
cell represented by IPC main group H01L 31/00 and
other technology components represented by IPC
main groups discovered through exploring process.
5 DISCUSSION
This study mainly focuses on utilizing the map of
technology as well as creating it. The preliminary
result of the case study suggests that a firm can find
potential technology components that can be
combined with existing technology component by
creating and exploring the map of technology
comprising the nodes of IPC main groups and the
links that present the co-assign relationship between
the IPC main groups.
It is the limitation that the frequency and average
year of co-assign relationship is one of possible
criteria to assign links between two technology
components. If the future study considers various
and appropriate criteria such as similarity in terms of
patents or assignees and citation relationship
between IPC main groups to assign links between
technology components, the study can contribute to
the literature in the aspect of developing a practical
tool for utilizing the map of technology.
REFERENCES
Fleming, L., Sorenson, O., 2004. Science as a map in
technological search. Strategic Management Journal,
25(89), pp.909–928.
Hinze, S., Reiss, T., Schmoch, U., 1997. Statistical
Analysis on the Distance Between Fields of
Technology, FhG-ISI (Karlsruhe): ISE Working Paper
Kautz, H., Selman, B., and Shah, M., 1997. ReferralWeb:
Combining social networks and collaborative filtering,
Communications of the ACM, 40(3), pp.63–65.
Krafft, J., Quatraro, F., Saviotti, P., 2011. The knowledge-
base evolution in biotechnology: a social network
analysis. Economics of Innovation and New
Technology, 20(5), pp.445–475.
Leydesdorff, L., Rafols, I., 2009. A Global Map of
Science Based on the ISI Subject Categories, Journal
of the American Society for Information Science and
Technology, 60(2), pp.348–362.
Leydesdorff, L., Kushnir, D., and Rafols, I., 2014.
Interactive Overlay Maps for US Patent (USPTO)
Data Based on International Patent Classifications
(IPC). Scientometrics, 98(3), pp.1583–1599.
Nesta, L., Saviotti, P.P., 2005. Coherence of the
knowledge base and the firm’s innovative
DevelopmentofaPracticalToolforExploringtheMapofTechnology
89

performance: evidence from the US Pharmaceutical
Industry. The Journal of Industrial Economics, 52(1),
pp.123–142.
Newman, M., 2003. The structure and function of complex
networks. SIAM review, 45, pp.167–256,
Özman, M., 2007. Breadth and Depth of Main Technology
Fields: An Empirical Investigation Using Patent Data.
Working Paper Series 01/2007, Science and
Technology Policies Research Centre, Middle East
Technical University.
Sakata, J., Suzuki, K., Hosoya, J., 2009. The analysis of
research and development efficiency in Japanese
companies in the field of fuel cells using patent data.
R&D Management, 39(3), pp.291–304.
Saviotti, P.P., 2004. Considerations about the production
and utilization of knowledge. Journal of Institutional
and Theoretical Economics, 160, pp.100–121.
Schoen, A., Villard, L., Laurens, P., Cointet, J.-P.,
Heimeriks, G., Alkemade, F., 2012. The Network
Structure of Technological Developments;
Technological Distance as a Walk on the Technology
Map. Paper presented at the Science & Technology
Inidicators (STI) 2012 Montreal.
Verspagen, B., 1997. Measuring intersectoral technology
spillovers: estimates from the European and US patent
office databases. Economic Systems Research, 9(1),
pp.47–65.
Verspagen, B., 2007. Mapping technological trajectories
as patent citation networks: A study on the history of
fuel cell research. Advances in Complex Systems,
10(1), pp.93–115.
Wu, S., Sun, J., Tang, J., 2013. Patent partner
recommendation in enterprise social networks.
Proceedings of the sixth ACM international
conference on Web search and data mining - WSDM
’13, p.43.
DATA2014-3rdInternationalConferenceonDataManagementTechnologiesandApplications
90
