ConceptMix
Self-Service Analytical Data Integration based on the Concept-Oriented Model
Alexandr Savinov
Database Technology Group, Technische Universität Dresden, Dresden, Germany
Keywords: Data Wrangling, Data Integration, Self-Service Analytics, Agile Analytics, Unified Data Models.
Abstract: Data integration as well as other data wrangling tasks account for a great deal of the difficulties in data
analysis and frequently constitute the most tedious part of the overall analysis process. We describe a new
system, ConceptMix, which radically simplifies analytical data integration for a broad range of non-IT users
who do not possess deep knowledge in mathematics or statistics. ConceptMix relies on a novel unified data
model, called the concept-oriented model (COM), which provides formal background for its functionality.
1 INTRODUCTION
The existing approaches to data analysis have
been pushed to the limits of their ability to solve
more and more complex tasks especially in the
context of several significant modern trends over the
last few years which are shortly described below.
New Types of Users. There is a new large class
of users which includes such (overlapping)
categories as data enthusiasts, casual users, data
artisans and business users. They do not possess
deep knowledge in mathematics and statistics but
need some simple to use yet powerful tool to solve a
problem or answer a question by analyzing available
data (Hanrahan, 2012).
Self-service Tools. Self-service tools are
opposed to traditional corporate BI tools and are
aimed at giving users the ability to solve analytical
tasks with little or no help from IT. Examples of
self-service tools include Microsoft Excel,
QlikView, Tableau (Morton et al., 2012; Morton et
al., 2014), Many-Eyes (Viégas et al., 2007), Fusion
Tables (Gonzalez et al., 2010), Fusion Cubes
(Abelló et al., 2013).
Agile Analytics. Agile analytics goes beyond
standard OLAP analysis by facilitating ad-hoc
queries where the user can freely vary data
processing and/or visualization parameters and is not
restricted by predefined scenarios (Löser, Hueske &
Markl, 2008; Thiele & Lehner, 2012; Idreos &
Liarou, 2013).
Analytical Computations. Analysis is not
limited by querying data and standard operations
like grouping and aggregation. Analysts need to
embed complex computations in their analysis tasks.
Near Real Time Analytics. There is strong
demand in reducing the time between data
acquisition and making a business decision but
conventional systems cannot provide the necessary
response time and agility of decision making on
large volumes of data (Chaudhuri, Dayal &
Narasayya, 2011; Thiele & Lehner, 2012).
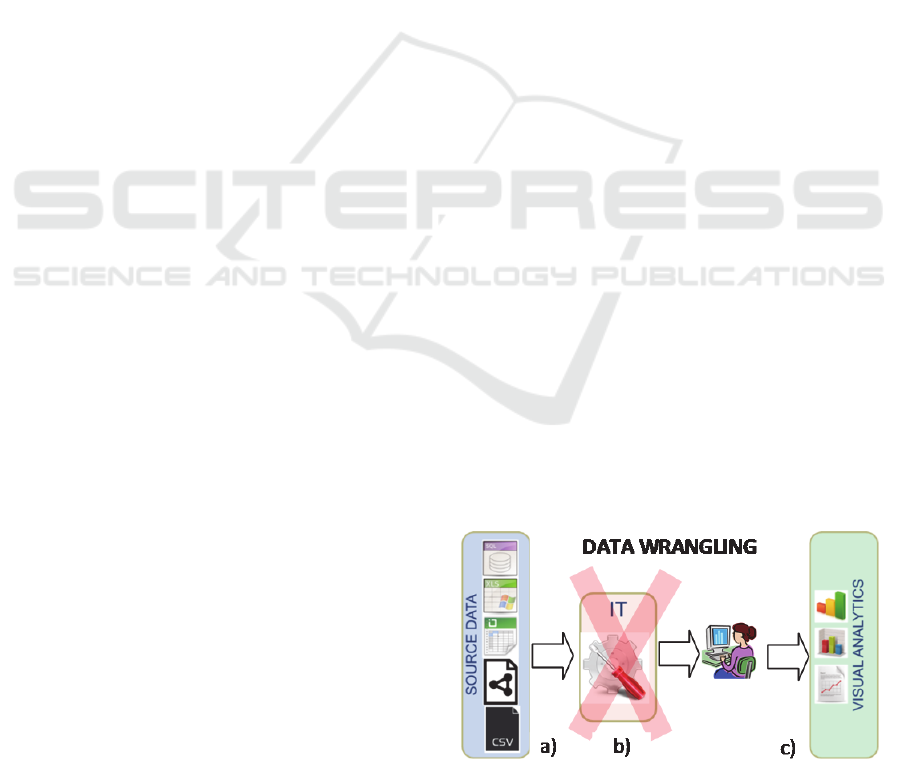
Figure 1: Data wrangling in the data analysis cycle.
Companies and organizations have access to
many corporate and external data sources (Fig. 1a).
However, a frequent problem is that none of them
has data the user needs for analysis. Before data can
be processed by a visual analysis tool (Fig. 1c), it
has to be represented in a required format which can
be consumed by the system. This step in the larger
data analysis and decision making cycle (Fig. 1b) is
normally performed by experts from the IT
78
Savinov A..
ConceptMix - Self-Service Analytical Data Integration based on the Concept-Oriented Model.
DOI: 10.5220/0005103700780084
In Proceedings of 3rd International Conference on Data Management Technologies and Applications (DATA-2014), pages 78-84
ISBN: 978-989-758-035-2
Copyright
c
2014 SCITEPRESS (Science and Technology Publications, Lda.)

department. It involves a number of more specific
tasks like finding and provisioning relevant data,
cleaning and integrating data, error detection, data
enrichment, schema matching, data profiling and
many others. These data wrangling (Kandel et al.,
2011) tasks account for a great deal or even most of
the difficulties in data analysis and constitute the
most tedious and error-prone part of the overall
analysis process.
Most currently existing technologies and tools
for solving data wrangling tasks belong to the
standard BI-stack and are intended for highly
experienced IT-users. In the presence of many next
generation data visualization tools like Tableau and
QlikView, the need in equal support of data
wrangling is especially acute because such tasks as
data provisioning are almost not covered. In many
cases, the only provided feature is the possibility to
join two tables using one attribute. If the user wants
to apply some more complex data transformations
then it can be done only by heavier tools that do not
meet the modern requirements to self-service
analytics. Applying different systems and data
analysis paradigms for data wrangling and data
visualization leads to frequent context switches and
interruptions of the natural flow of analysis (Morton
et al., 2012). The users are not able to produce the
necessary results just because they are not able to
integrate multiple heterogeneous data sources and
represent this data in the format suitable for visual
exploration.
The main goal of ConceptMix is to provide full
support for various data wrangling operations but at
the same time to meet the requirements to next
generation analysis systems. ConceptMix is a self-
service tool for analytical data integration and
arbitrary data transformations intended for non-IT
users. In addition to the requirements to the next
generation analysis tools (self-service, agile
analytics and support for analytical computations in
near-real time), ConceptMix is designed to meet
several more specific requirements to data
integration and transformation systems which are
described below.
Multiple Heterogeneous Data Sources. The
main problem here is in supporting various views on
data and data modeling paradigms.
Arbitrary Schema Transformations. Schema
transformations are needed to produce data with the
desired structure. In particular, it is not enough to
define one output table and it is not enough to define
several isolated output tables.
Arbitrary Data Transformations. In addition
to defining a schema, it is necessary to precisely
define data in this schema which will be either
copied from source data or computed. The difficulty
is that this data has to be expressed in terms of
multiple data sources as well as data in this same
schema.
Assistance and Automatic Recommendations.
A typical enterprise system can contain tens of
thousands data tables and open systems can involve
even more external data sources. In this situation, it
is extremely difficult to get meaningful results
without some help from the system. The system
should be able to make relevant and meaningful
suggestions as well as automatically detect formal
errors and semantic inconsistencies. This feature
involves quite many data analysis methods including
data enrichment, schema matching, foreign key
discovery, entity resolution and others.
Reasoning About Data. Analytical queries are
rather complex data processing scripts over
numerous data sources and writing such queries is a
tedious and error-prone task requiring high
expertise. The mechanism of reasoning about data
can significantly simplify this task by automatically
deriving the desired result from the available data.
The user has to specify the criteria for the answer
and the system automatically derives the result from
the available data.
Developing a technology that meets all the above
requirements is a highly non-trivial task. Saying that
numerous specific data management technologies
can be significantly simplified without sacrificing
their functionality can be perceived with a great
portion of skepticism because it requires rethinking
the existing paradigms and views on data. Yet, such
simplification of analytical data integration is a
primary goal of ConceptMix. The main enabler of
ConceptMix that underlies its functions is a novel
approach to data modeling, called the concept-
oriented model (COM) (Savinov, 2014b; 2012c;
2011a). COM answers the question what is data and
rethinks basic assumptions underlying the notion of
data. Its main goal and benefit is that it radically
simplifies data modeling by unifying major existing
views on data (generality), using only a few main
notions (simplicity) which are very close to how
data is used in real life (naturalness).
In its most abstract form, COM is described by
means of sets and functions. A set is a number of
data elements and it is analogous to such notions as
table, relation or collection in other models. A
function is a mapping from one set to another set
which is used to represent a property, attribute or
field. The primary distinction of COM from other
models is that an element is defined as a couple of
ConceptMix-Self-ServiceAnalyticalDataIntegrationbasedontheConcept-OrientedModel
79

one identity tuple and one entity tuple. An identity is
a value with domain-specific structure which also
plays a role of reference by providing access to
constituents of the associated entity. An entity is
data represented by-reference, that is, by using its
identity. Such identity-entity couples are modeled by
means of a novel data modeling construct, called
concept (hence the name of the model), which is a
couple of one identity class and one entity class.
Functions are represented by concept fields which in
COM are referred to as dimensions.
The concept-oriented query language (COQL)
(Savinov, 2014a; 2012a; 2011b) is a syntactic
embodiment of COM. ConceptMix uses a modified
version of this language, called the concept-oriented
expression language (COEL), the purpose of which
is similar to that of the Microsoft Data Analysis
Expressions (DAX) (Russo, Ferrari & Webb, 2012).
An important principle of COM is that all elements,
sets and concepts are partially ordered. This means
that a reference always points to a greater element, a
function is a mapping from a lesser set to a greater
set, and a dimension type is a greater concept. A
typical concept-oriented schema is shown in Fig. 2.
The main benefit of partial order is that it can
represent quite different models and semantic
relationships (Savinov, 2012c): multidimensional,
entity-relationship, general-specific, containment,
object-orientation, attribute-value.
Figure 2: Example of a concept-oriented model.
The purpose of this paper is to describe
principles of ConceptMix, a self-service analytical
data integration system that is designed to meet the
above requirements and relying on the unified
theoretical background provided by COM. Section 2
describes a sample data processing scenario and the
vision behind the system. Section 3 describes main
functions ConceptMix provides for analytical data
integration and Section 4 makes concluding remarks.
2 THE VISION
Let us assume that a company sells products to
customers and the task is to explore how order
cancellations depend on other factors. More
specifically, it is necessary to build a chart showing
how order cancellations depend on the product price
(Fig. 3). This chart should show the number of
cancelled orders and the total cost of the cancelled
orders (as percentage of all orders for this price
group) against price groups displayed along axis X.
In order to build such a chart, we need data to be
represented as a table with three columns:
PriceGroup, CancelledCount, CancelledCost.
This task cannot be easily solved by typical visual
analysis tools because of the following difficulties:
Multiple Data Sources. Data is loaded from two
unrelated data sources: a product catalog (table
Products) and a sales database (tables Items,
Orders and Status). Missing relationships have to
be reconstructed.
No Dimension Table. Table
PriceGroups with
price groups does not exist in any data source. It has
to be created by defining what products belong to
what group depending it the product price.
No Measure Attributes. Attributes describing
order cancellations (
CancelledCount and
CancelledCost) do not exist in the source data
tables and have to be computed for the new table
with price groups.
Figure 3: Example of analytical data integration.
Status
Orders
Items
Products
PriceGroups
CancelledCount
CancelledCost
Outputtable:
<PriceGroup,CancelledCount,CancelledCost>
SALESDEPTPRODUCTCATALOG
PriceGroup
?
Pricegroups
Cancelledorders:%count,%amount
0‐10
10‐100
100‐1000
>1000
Status
Orders
Items
Categories
product
order
status category
Greater
concept
Lesser
concept
Least(bottom)
concept
Companies
customer
manufacturer
Products
DATA2014-3rdInternationalConferenceonDataManagementTechnologiesandApplications
80

The traditional approach to solving this problem
consists in writing a data transformation script. Such
a script can be represented as a graph where nodes
represent data and edges are operations. The main
problem is that even if a tool provides convenient
visual interface for authoring such scripts, the user
still has to understand the meaning of operations and
what sequence of operations will lead to the desired
result. In most cases, data transformations are based
on table join and groupings which are quite difficult
for non-IT users (Atzeni et al., 2013).
ConceptMix uses a novel approach which is
conceptually illustrated in Fig. 4. The user creates a
new data mash-up by applying drag-and-drop
operation to existing elements. The system then
suggests a relevant definition for a new data element
(table or column) by taking into account the current
context and data semantics. New elements can
always be defined by writing an expression or
editing the suggested definition.
Figure 4: ConceptMix UI principles.
The scenario implemented in ConceptMix
consists of the following steps:
Importing Data. Load data from the sales
database as three tables:
Items, Orders, and Status.
The system loads also all available meta-data
including foreign and primary keys which are
important for further processing. Load also
Products from the product database.
Defining Links. Connect the
Items table with
the
Products table by defining a new column in the
Items table pointing to the Products. The system
will use this link when making recommendations
and querying data.
Defining a New Table. Extract a new table
PriceGroups from the table Products by
simultaneously creating a link so that each product
points to the price group it belongs to.
Defining New Columns. Define two new
columns of the
PriceGroup table by dragging the
table
Status and dropping it to the table
PriceGroup. The system will suggest a relevant
definition by using COUNT aggregation function.
In general, the idea is that the user authors a
mash-up which is kept updated as the operations are
being performed so that the user can immediately
see the results. This mash-up is a normal data
schema consisting of tables with columns. Every
element in this mash up (table or column) has some
definition in terms of already existing elements.
ConceptMix distinguishes two major procedures:
table definition (and population of the new derived
table) described in Section 3.1 and column definition
(and population of the new derived column)
described in Section 3.2.
3 DATA PROCESSING ENGINE
3.1 Derived Tables
The goal of this procedure is to define a new table
by using already existing tables. COM provides two
basic operations that can be used for defining new
tables: product of existing tables and projection
along an existing column. These operations have
several more specific use cases.
Product. To define a new product-table it is
necessary to specify one or more existing tables as
well as a filter condition for selecting combinations
of their records. The new table will contain all
combinations of the specified source tables which
satisfy the filter condition. Note however that
internally the system will store only pointers to the
source records without copying the real data. This
approach is frequently used in multidimensional
analysis. For example, we might want to build a
table
PriceGroupsAndStatus with all combinations
of price groups and order statuses which is defined
by the following expression:
SETPriceGroupsAndStatus=PRODUCT(
PriceGroupsPriceGroup,
StatusStatus
)
One particular case of this operation is where it
is necessary to restrict one source table. In this case,
the result will contain a subset of the source table
and only some filter condition has to be provided by
the user. For example, expensive products could be
selected by the following expressions:
SETExpensiveProducts=PRODUCT(
ProductsProduct
|Price>1000
)
Category
Categories
Id
Name
Orders
Id
Amount
Customers
Id
Country
Amount
Customers
Drinks
Electronics
Garden
Toys
50,000
10,543
3,825
23,876
876
356
84
1,539
=COUNT(this<‐(Orders)<‐(Customers))
SCHEMA
DEFINITION
DATA
ConceptMix-Self-ServiceAnalyticalDataIntegrationbasedontheConcept-OrientedModel
81

The new filtered table is included in the source
table by inheriting all its properties and without
copying the real data.
Projection. Project is an operation which creates
a new table from all (unique) outputs of one column.
Formally, a new set will contain all output values of
one function evaluated for the input values of the
source set. Project and de-project are two operations
of the novel arrow notation (Savinov, 2012a). It is
analogous to the conventional dot notation with the
difference that there are two operations (project and
de-project) and these operations are applied to sets
rather than to instances.
This operation can be used for finding all unique
values in a table or grouping elements of the source
table by extracting groups into a separate table. For
example, a new table with price groups can be built
by projecting all
Products along column
PriceCategory:
SETPriceGroups=
Products‐>PriceCategory
If it is necessary to combine several columns
then it is always possible to define a new linked
column returning a tuple as described in the next
section.
3.2 Derived Columns
Users of ConceptMix can add new columns to tables
of the analytic mash-up. What is new here is that
these columns can collect data from all other
columns in the schema rather than from only the
current data record or the current table.
Theoretically, it is possible to define any derived
column using an expression in COEL because a
column is a function that maps inputs to outputs.
However, ConceptMix provides several separate
functions for defining different column types
depending on the type of expression and the purpose
of the new column. The following column types can
be created: arithmetic columns (for primitive
values), link columns (for complex values),
aggregated columns (for aggregating data stored in
other columns), case columns (for grouping
records). Below we describe these types of columns
in more details.
Arithmetic columns. The user of ConceptMix can
define a new column which computes its output
value by using other columns of this table. Formally,
a new column is a function of other columns. For
example, a new column
TotalPrice of the table
Items returning double values can be computed as
the item price multiplied by the number of items:
DoubleTotalPrice=
this.Price*this.ItemCount
It is always possible to use dot notation to access
data in other tables.
Link columns. These columns return a tuple, that
is, a complex value which combines several other
values. Such columns are used to create a link
between two existing columns by describing a
mapping between individual attributes. In terms of
the relational model, they are analogous to foreign
keys (FK) but there are some significant conceptual
differences. In particular, a link is defined as a
normal column at the level of the schema rather than
at the level of a query in the case of FKs. Also, a
link column describes a function, that is, what data
this new column will store while FK describes a
constraint. Link columns are also used for describing
complex mapping between tables and for use in the
projection operation where output tuples describe
elements of a new table.
A new link column is defined as an expression
that returns a tuple. Tuples in COEL are written in
parentheses as a comma separated list of attribute-
value pairs. For example, a new order item could be
represented as the following tuple:
TUPLE
(Order=1234, Product=2345)
. Tuple components
can themselves be tuples. For example, order
number can be written as a tuple:
TUPLE
(Order=(OrderID=25, Status="Cancelled"),
ProductID=35). Note that tuple constituents can be
arbitrary expressions. A new column
Product which
links the
Items table to the Products table is
defined as a tuple with one constituent:
DoubleProduct=TUPLE(
IntegerID=this.ProductID
)
Aggregated columns. An aggregated column is a
special system function which processes groups of
values stored in another column. To specify an
aggregated column it is necessary to provide the
following parameters:
Fact table stores records which have to be
broken into groups for aggregation
Grouping column specifies records from the
fact table that belong to one group
Measure column stores the values to be
aggregated
Aggregation function is a method of
aggregation like sum or average. Custom
aggregation functions are also possible.
For example, the total order amount (a new
aggregated column of the
Orders table) is computed
as follows:
DATA2014-3rdInternationalConferenceonDataManagementTechnologiesandApplications
82

DoubleTotalAmount=AGGREGATE(
Items,Order,TotalPrice,SUM
)
The system will break records from the table
Items into groups depending on the values returned
by the column
Order. Then it will sum up values of
the column
TotalPrice for each individual group.
All these computations are performed for one pass
through the fact table.
This definition uses existing columns (measure
and grouping) which have to be defined before the
new aggregated column can be defined. For
example,
TotalPrice in the above expression is a
derived column. However, it is possible to define
these columns in the context of the aggregation
function. Also, an aggregated column could be part
of other expressions. An alternative way to define
aggregation is using de-projection (Savinov, 2012a).
Case columns. The main purpose of these
columns is to group records of the table by assigning
an explicitly specified value depending on some
condition evaluated for the current record. It is
roughly corresponds to SQL case expressions but is
used to define new functions by specifying an output
depending on which condition is satisfied. For
example, if we want to break (partition) all products
into several groups depending on their price then we
specify price intervals (conditions) and the
corresponding output values of this column.
4 CONCLUSIONS
In this paper, we presented a conceptual vision for a
next generation analytical data integration system by
rethinking main principles behind such systems. We
described how these general principles are
implemented in ConceptMix – a self-service tool for
analytical data integration intended for solving a
wide range of typical data wrangling tasks which
precede the visual analysis step.
In future, we are going to extend this technology
by developing a powerful assistance engine which
will leverage the semantic properties of COM. This
includes recommendations for schema mappings,
relationships, aggregations, imports and others.
Another novel function to be added in the future is
selection propagation which leverages the inference
capabilities of COM (Savinov, 2012b; 2006). Also,
we will develop an optimizer for translating
expressions into an efficient code for execution in
the column-oriented data processing engine.
REFERENCES
Abelló, A., Darmont, J., Etcheverry, L., Golfarelli, M.,
Mazón, J.-N., Naumann, F., Pedersen, T.B., Rizzi, S.,
Trujillo, J., Vassiliadis, P., Vossen, G., 2013. Fusion
Cubes: Towards Self-Service Business Intelligence.
IJDWM 9(2), 66-88.
Atzeni, P., Jensen, C.S., Orsi, G., Ram, S., Tanca, L.,
Torlone, R., 2013. The relational model is dead, SQL
is dead, and I don’t feel so good myself. ACM
SIGMOD Record, 42(2), 64-68.
Chaudhuri, S., Dayal, U., Narasayya, V., 2011. An
overview of Business Intelligence technology.
Communications of the ACM, 54(8), 88-98.
Gonzalez, H., Halevy, A., Jensen, C., Langen, A.,
Madhavan, J., Shapley, R., Shen, W., 2010. Google
Fusion Tables: Data Management, Integration and
Collaboration in the Cloud. Proc. ACM Symposium on
Cloud Computing (SOCC 2010), 175-180.
Hanrahan, P., 2012. Analytic database technologies for a
new kind of user: the data enthusiast. Proc. SIGMOD
2012, 577-578.
Idreos, S., Liarou, E., 2013. dbTouch: Analytics at your
Fingertips. Proc. 6th Biennial Conference on
Innovative Data Systems Research (CIDR’13).
Kandel, S., Paepcke, A., Hellerstein, J., Heer, J., 2011.
Wrangler: Interactive Visual Specification of Data
Transformation Scripts. Proc. ACM Human Factors in
Computing Systems (CHI), 3363-3372.
Löser, A., Hueske, F., Markl, V., 2008. Situational
business intelligence. Proc. Business Intelligence for
the Real-Time Enterprise (BIRTE), 1-11.
Morton, K., Bunker, R., Mackinlay, J., Morton, R., Stolte,
C., 2012. Dynamic Workload-Driven Data Integration
in Tableau. Proc. SIGMOD 2012, 807-816.
Morton, K., Balazinska, M., Grossman, D., Mackinlay, J.,
2014. Support the Data Enthusiast: Challenges for
Next-Generation Data-Analysis Systems. Proc. VLDB
Endowment 7(6), 453-456.
Russo, M., Ferrari, A., Webb, C., 2012. Microsoft SQL
Server 2012 Analysis Services: The BISM Tabular
Model. Microsoft Press.
Savinov, A., 2014a. Concept-oriented query language. In
J. Wang (Ed.), Encyclopedia of Business Analytics and
Optimization. IGI Global, 512-522.
Savinov, A., 2014b. Concept-oriented model. In J. Wang
(Ed.), Encyclopedia of Business Analytics and
Optimization. IGI Global, 502-511.
Savinov, A., 2012a. References and arrow notation instead
of join operation in query languages. Computer
Science Journal of Moldova (CSJM), 20(3), 313-333.
Savinov, A., 2012b. Inference in hierarchical
multidimensional space. In Proc. International
Conference on Data Technologies and Applications
(DATA 2012), 70-76.
Savinov, A., 2012c. Concept-oriented model: Classes,
hierarchies and references revisited. Journal of
Emerging Trends in Computing and Information
Sciences, 3(4), 456-470.
ConceptMix-Self-ServiceAnalyticalDataIntegrationbasedontheConcept-OrientedModel
83

Savinov, A., 2011a. Concept-oriented model: Extending
objects with identity, hierarchies and semantics.
Computer Science Journal of Moldova (CSJM), 19(3),
254-287.
Savinov, A., 2011b. Concept-oriented query language for
data modeling and analysis. In L. Yan & Z. Ma (Eds),
Advanced database query systems: Techniques,
applications and technologies. IGI Global, 85-101.
Savinov, A., 2006. Query by constraint propagation in the
concept-oriented data model. Computer Science
Journal of Moldova (CSJM), 14(2), 219-238.
Thiele, M., Lehner, W., 2012. Real-Time BI and
Situational Analysis. In M.E. Zorrilla, J.-N. Mazón,
Ó. Ferrández, I. Garrigós, F. Daniel, & J. Trujillo
(Eds.), Business Intelligence Applications and the
Web: Models, Systems and Technologies. IGI Global,
285-309.
Viégas, F.B., Wattenberg, M., Ham, F. van, Kriss, J.,
McKeon, M., 2007. Many eyes: A site for
visualization at internet scale. IEEE TVCG, 13(6),
1121-1128.
DATA2014-3rdInternationalConferenceonDataManagementTechnologiesandApplications
84
