
A Resource-aware Simulation Tool for Business Processes
Vincenzo Cartelli, Giuseppe Di Modica and Orazio Tomarchio
Department of Electrical, Electronic and Computer Engineering, University of Catania, Catania, Italy
Keywords:
Business Process Simulation, Activity based Costing, BPMN, Colored Petri Nets.
Abstract:
The deep knowledge of internal and external business processes, along with the capability of governing them,
are a key requirement for enterprises to survive. In the dynamic and unpredictable worldwide market, the
achievement of business goals depends on the ability of enterprises to adapt to new market conditions by
promptly re-engineering their processes. The cost for process re-engineering may be not negligible, if we
consider that it may require several refinement steps and that tuning processes on-the-job may impair regular
business activities. To this end, there is a growing interest towards tools that allow to simulate process modifi-
cations before actually enforcing such changes. In this paper we propose a tool for business process simulation
which makes use of modeling specifications such as the Business Process Model and Notation (BPMN) and
exploits the rigor of the Colored Petri Nets (CPNets) formalism. With respect to other approaches proposed
in the literature, the one presented here defines a detailed model of enterprise’s resources (both human and
non-human) and cost allocation inspired to the Activity Based Costing (ABC) accounting principles. A case
study test was conducted on a prototype implementation and related results are presented.
1 INTRODUCTION
Many organizationsare recognizing the value of Busi-
ness Process Management (BPM) as a strategic busi-
ness tool. BPM combines established management
methods with information technology to measure per-
formance, identify bottlenecks and improve business
processes more quickly and easily (Weske, 2012). It
enables business managers to make better-informed
decisions and to look at the enterprise “as-a-whole”
when facing new market changes and challenges. Be-
yond process modeling, the analysis phase plays a key
role in the BPM discipline. Business process analysis
is a term used with a rather broad meaning, includ-
ing a range of different tactics such as simulation and
diagnosis, verification, and performance analysis of
processes (Vergidis et al., 2008).
In this paper we focus our attention on simula-
tion. Simulation provides dynamic analysis of busi-
ness processes, going beyond static diagrams and av-
eraged numerical process verification. Processes in-
volving variability, disruptions and interaction com-
plexity are ideal for simulation. Other (static) tech-
niques for measuring processes, such as spread sheets
and flow diagrams, often ignore or treat these factors
as averages, with important consequences (Jansen-
vullers and Netjes, 2006). Simulation tools provide
a structured environment in which business managers
can understand, analyze, and improve business pro-
cesses. With such tools it is possible to evaluate
the performance of the existing process model (as-is
model) and to compare it with its modified versions
(to-be models) in order to verify the improvement of
key performance indicators (KPIs).
In this paper we present the design of a simula-
tion tool that relies on the standard Business Process
Model and Notation (BPMN) (OMG, 2011) and ex-
ploits the formalism of Colored Petri Nets (Jensen,
1996) for which efficient and consolidated analysis
techniquesare available. One of the main contribution
of our work with respect to existing tools is the def-
inition and the integration of an enterprise’s resource
model within the simulation framework. In particular,
we introduce a cost-oriented characterization of re-
sources which is inspired to the Activity Based Cost-
ing (ABC) accounting principles. Business process
models typically abstract away from the resource per-
spective or provide a simplistic view of resource par-
ticipating in a task. As it will be shown later, our
framework allows to model and simulate complex
interactions between activities (tasks) and resources
(both human and non-human).
The rest of the paper is organized as follows. In
Section 2 an overview of related work in the field
of business process simulation is provided. In Sec-
tion 3 an ABC-centric view of the enterprise’s process
123
Cartelli V., Di Modica G. and Tomarchio O..
A Resource-aware Simulation Tool for Business Processes.
DOI: 10.5220/0005067001230133
In Proceedings of the 11th International Conference on e-Business (ICE-B-2014), pages 123-133
ISBN: 978-989-758-043-7
Copyright
c
2014 SCITEPRESS (Science and Technology Publications, Lda.)

model is described. Section 4 provides the main de-
sign principles of our simulator. In Section 4.1 techni-
cal details on the the main component performing the
mapping from the BPMN model to the CPNet model
are discussed. Section 5 presents a practical and ex-
plicative use case and Section 6 concludes the work.
2 LITERATURE REVIEW AND
MOTIVATION
Business Process Simulators are acknowledged as
one of the must-have tools which business managers
should use to analyze enterprise’s business processes
and to keep the business goals under strict control
over time.
Process Simulation is one of the key features
of both commercial Business Process Management
Suites (BPMS) and research prototypes of business
process tools. Many commercial actors such as ARIS,
Oracle, iGrafx and IBM have developed very power-
ful simulation tools, which unfortunately are embed-
ded in their respective BPMS, and though open pro-
cess notation formats like the BPMN (OMG, 2011)
are supported, the full set of offered simulation fea-
tures can be exploited only if the proprietary notation
format is used. An interesting analysis on the lim-
its shown by the approach adopted by the majority of
commercial simulation tools can be found in (Van der
Aalst et al., 2008).
Within business process management, simulation
can be readily used for both process design and ongo-
ing process improvement. In (Januszczak and Hook,
2011) authors argue that in most cases simulation is
more effective (in terms of costs and practical bene-
fits) if applied after processes have already been au-
tomated. In that case, in fact, processes’ output data
may be collected and used as input for the simula-
tion model. Further, they propose to adopt a standard
format to represent both the processes’ gathered data
and the parameters of simulation scenarios in order to
improve the accuracy of simulation results.
In the literature some works have appeared which
focus on the need of integrating security and risk
aspects in the management of business processes,
and propose risk-aware simulation models(Tjoa et al.,
2011; Betz et al., 2011). Most of literature ap-
proaches, though, deal with economic aspects: pro-
cesses, activities and involved resources are regarded
in the perspective of the costs they produce. Further,
most of the proposed simulation tools rely on Petri
Nets (and their derivatives) as modeling languages to
describe processes and process interactions.
In (Koizumi and Koyama, 2007) authors try to es-
timate the process execution time by using a Timed
Petri Net model. Protos2CPN tool (Gottschalk et al.,
2008)’s strategy is to transform a Protos model into
Colored Petri Nets (Jensen, 1996), and simulate it in
standard CPN tools. In (Van der Aalst et al., 2008)
focus is on the correct modeling of resources. The
YAWL language (Van der Aalst and Ter Hofstede,
2005) is used to capture and model resource features
within the process dynamics. Colored Petri Nets are
also adopted in the simulation step.
The simulative approach we propose in this pa-
per is very much focused on resources involved in
the business process execution and on the determina-
tion of analytical costs incurred to execute processes.
The objective is to build a simulation tool capable of
providing the business analyst with as much detailed
as possible costs to best support the ABC analysis.
We argue that the BPMN is the best candidate to cap-
ture all the dynamics of processes at any management
level (from top level to production chain). Thanks to
the high flexibility shown by the modeling language,
processes can be modelled at any degree of detail,
and the more processes get detailed, the more ana-
lytic will be the incurred costs. The advantage of us-
ing BPMN is that all kind of enterprise’s processes
can be modelled. Even the so called support pro-
cesses (Porter, 1985) (e.g., Human resource manage-
ment, supply management), which produce overhead
costs (indirect costs), may be modelled in BPMN and
integrated in our simulation environment. Eventually,
our approach enables for overhead costs to be directly
allocated over the enterprise’s products/services, thus
facilitating the job of the cost analyst.
Our proposal recalls the Protos2CPN’s in that the
business process model is transformed into a Col-
ored Petri Net, but unlike Protos2CPN the starting
process model is a standard BPMN model (and not
a proprietary one). As for the Petri Net simulator
we integrated the Renew simulation engine (Kummer
et al., 2004), which provides a flexible Java-based
high-level Petri net simulator. To sum up, our strat-
egy combines the high flexibility of BPMN used to
capture the process dynamics at all enterprise’s man-
agement levels with the formalism and rigor of Petri
Nets used to simulate business process executions. Fi-
nally, regarding the definition of simulation scenario
parameters, the guidelines presented in (Januszczak
and Hook, 2011) where followed.
ICE-B2014-InternationalConferenceone-Business
124

positopn
occupant
groups
positions
calendar
OrganizationalResource
Calendar
1..*
1
1
0..*
0..*
Role
HumanResource
Skill Feature
0..*
0..*
higherLevel
0,1
OrganizationalGroup
Resource
Q:Quantity
CostObject
Q:Quantity
NonHuman
Resource
Q:Quantity
Refillable
Resource
Q:Quantity
Consumable
Resource
Q:Quantity
«bind»
Q: NumberOf<HR>
Schedulable
Resource
Q:Quantity
directReport
0,1
0..*
subordinates
0..*
delegates
OrganizationalPosition
Quantity, unit of measure
and amount management
Quantity Money
Dimensionless
NumberOf
T
Amount
Q:Quantity
Duration
Unit
Q:Quantity
skills
features
OrganizationalUnit
OrganizationalBranch
OrganizationalTeam
Durable
Resource
Q:Quantity
Asset
Q:Quantity
Figure 1: Class diagram representation of the Resource Model.
3 AN ABC-CENTRIC
INFORMATION MODEL
In order to design an accurate simulator a fine-grained
characterization of business processes must be first
carried out. To characterize and analyze at best busi-
ness processes (BPs) several kinds of information
are needed. Put in a simple way, BPs interact to
each other’s and involve multiple activities, which
in their turn have to be fed with many data in or-
der to complete successfully. Current BP’s model-
ing notation such as XPDL (Coalition, 2012), EPC,
BPMN (OMG, 2011) and YAWL (Van der Aalst and
Ter Hofstede, 2005) help the process designer to
model processes according to the process flows’ spec-
ification. Still, a process model may not be said to
be exhaustive unless it is complemented by the infor-
mation which is necessary for the processes’ imple-
mentation within its execution environment. In the
study conducted in (Vara and S´anchez, 2009), authors
point out that classic BP modeling tools are not able
to elicit all functional requirements needed to inte-
grate the process implementation to the enterprise’s
information system. According to that study, a sin-
gle BP is characterized, among others, by some pre/-
post conditions (conditions which must be fulfilled
before/after the process is executed), the data object
consumed/produced by the process flows, the busi-
ness rules to be enforced in strategic points of the pro-
cess branches, and the set of actions that both human
beings and the system carry out during the normal ex-
ecution of the process.
We argue that the design of a simulator of busi-
ness process executions must account for the dis-
cussed set of requirements. In the proposed approach,
such requirements will form the basis of an Informa-
tion Model (I
mod
) which the simulator will rely on.
In our design the I
mod
breaks down in three sections:
Business Process Model, Resource Model and Bridge
Data Model.
The Business Process Model (BP
mod
) represents
the definition of processes and their control flows.
There is a lot of well-known and largely acknowl-
edged specifications which can be used to model
processes. This work does not address the defini-
tion of a new business process modeling specifica-
tion. But, since a business process model is required
for the project’s purposes, we decided to adopt the
well known Business Process Model and Notation
(BPMN) standard to model processes, subprocesses,
tasks and control elements of BPs (OMG, 2011).
Differently from what other approaches have pro-
posed, the work presented here focuses on the defini-
tion of an enterprise’s Resource Model (R
mod
) and on
its strong integration with the business process model.
The R
mod
aims at capturing and representing informa-
tion regarding any kind of “resource” that need to be
consumed by each process task, be it a human or a
non-human resource, and more specifically puts the
basis for an Activity Based Costing (ABC) analysis
of processes. We believe that an accurate represen-
tation of all resources potentially exploitable by the
enterprise, along with the specification of a tight inte-
gration of such resources to the enterprise’s BPs, will
help the process designer to contextualize the process
model and, thus, to better estimate the KPIs’ fulfill-
ment.
The Bridge Data Model (BD
mod
) was designed
to embed information regarding a) the integration
of processes’ workflow elements with the resources
available in the enterprise and b) other functional re-
quirements which are useful to contextualize the BPs
in their real runtime environment. As for a), infor-
AResource-awareSimulationToolforBusinessProcesses
125

mation can be found, for instance, on the type and
quantity of a given resource R (defined in the R
mod
)
associated to a specific process task T (defined in
the BP
mod
). With respect to point b), the document
collects data related to the processes’ runtime execu-
tion, i.e., specific functional requirements regarding
the enterprise’s IT context where processes are going
to be deployed. This section of the document is used
to model the behavior of BP elements (like business
rules, gateways) which may require input data com-
ing from the enterprise’s information system. Such
behaviors may be modeled either through statistical
functions or through data objects attributes evalua-
tion, and of course it is up to the designer to search
for the most appropriate function and fine-tune its pa-
rameters.
While the BP
mod
is well defined by the BPMN
specifications, the need for integrating it with an
enterprise-level resource model and all parameters re-
lated to the simulation scenario lead us to the design
and implementation of the R
mod
and the BD
mod
.
The starting point is suggested by the approach
used in ABC analytical accounting systems (Cooper
and Kaplan, 1992). We assume that all enterprise
costs are generated whenever an activity consumes
a resource. The strength of ABC is that all costs
generated by resource consumptions are directly al-
located to the activities by means of the appropriate
resource drivers, in other words, all costs (includ-
ing overhead costs produced by supporting activities)
may be viewed as direct costs. Given the full activity
cost configuration it is afterward possible to allocate
this cost to every cost object through well suited activ-
ity drivers that define how a cost object “consumes”
each activity.
The R
mod
targets at modeling an enterprise re-
source pool, and defines the resource concept as a cost
object extension. Figure 1 presents its relevant UML
classes and their relationships. Each resource, as well
as each cost object, is defined by its unit of measure
and its unit cost. As measures and unit framework, a
JSR-275 standard implementation has been used
1
.
The NonHumanResource class allows the defini-
tion of resources like goods and services. Consum-
ableResource extends it by introducing the concept
of “residual amount” and it is suited for available-if-
in-stock resources. SchedulableResource represents
a generic resource whose availability is defined by
one or more calendars; the most common calendar
based resource is the HumanResource who occupies
an OrganizationalPosition within an Organizational-
Group or an OrganizationalUnit structure (organiza-
tional chart).
1
http://jscience.org
The base class for Resource and Activity is the
CostObject class. Each cost object can rely on a set
of other cost object requirements (see figure 2), en-
abling hierarchical cost object modeling and cost ag-
gregation providing a generic chart of cost objects ac-
counts. The BD
mod
uses this feature to map the ABC
resource driver concept into the activity resource re-
quirements.
Figure 2 shows how the Activity class implements
the bridge between the BP
mod
and the R
mod
, given that
the activity is both a cost object and a process flow el-
ement.
In standard ABC accounting, activity drivers are
generally defined by the ratio between the number of
activity instances related to the given cost object and
the total number of activity instances or, in case of ac-
tivities that work on a mix of different cost objects of
the same class, by the ratio of time spent by the activ-
ity working on the given cost object and the total work
time of the activity. The second approach is well jus-
tified when low levels of information about the inner
structure of the activity are available, so that it is not
possible to exploit the trace of the elementary tasks
composing the entire activity in a simple way.
Under the business process management view, it is
possible to assert that the latter event should never oc-
cur. Given the fundamental approach of BPMN mod-
eling and implementation phases, that imposes a full
breakdown of all processes up to their task levels in
conformity with each data-object lifecycle, it can be
safely assumed that BP
mod
enables a full resource-
activity-cost object mapping given the fact that re-
sources are consumed by tasks that generally work on
a single and well defined cost object set. The only ex-
ception may arise in case of high-levelnon-executable
process models. It should be responsibility of the de-
signer to detail the BP
mod
up to the required level.
4 DESIGN OF A BUSINESS
PROCESS SIMULATOR
In this section the design of a Business Process Simu-
lator is presented. Simulation of business processes is
a technique which may be used to analyze the impact
of some important choices that are to be taken at pro-
cess (re)design time, right before (re)implementing
the processes. Through simulation designers are able
to estimate the fulfillment of the enterprise’s key per-
formance indicators (KPIs). The more accurate the
simulator, the narrower the gap between the estimated
KPIs and the actual KPIs that will be achieved at pro-
cess execution time.
The simulator was designed to be “fed” with data
ICE-B2014-InternationalConferenceone-Business
126
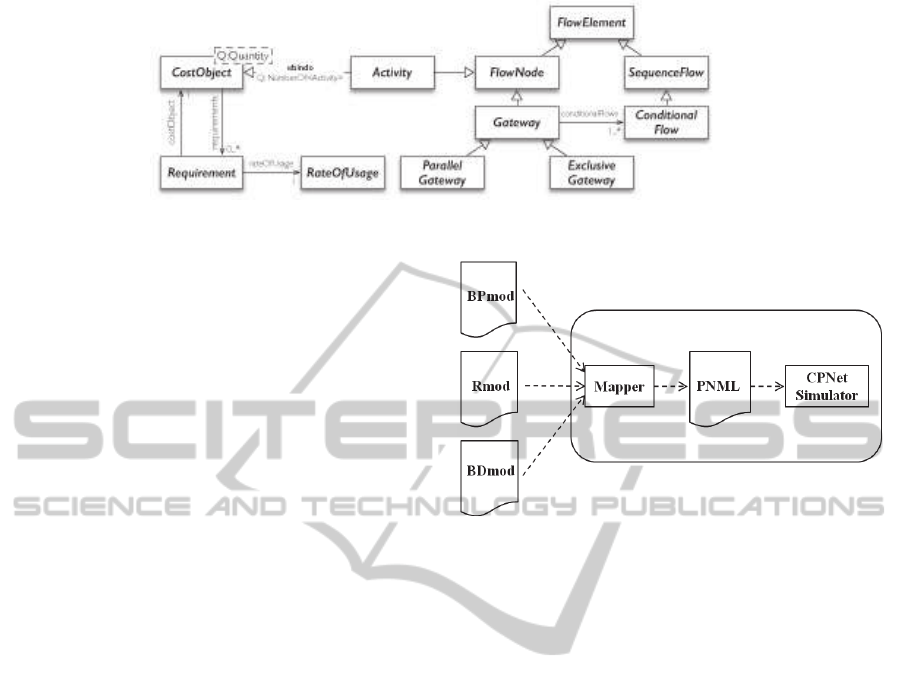
Figure 2: Class diagram representation of the Bridge Data Model.
organized according to what is specified in the I
mod
structure. The data organizationis a manual task com-
mitted to the designer, who will have to gather all pro-
cesses’ requirements and give them the structure rec-
ommended by the I
mod
. In particular, the designer is
responsible for the definition of the BP
mod
, the R
mod
and the BD
mod
respectively. In the definition of the
BP
mod
they will be guided by the requirements on the
enterprise’s business workflows. Then, they will take
care of mapping enterprise’s resource requirements
onto the resource categories specified in the R
mod
(see
section 3). Last designer’s responsibility is the elab-
oration of the BD
mod
, which represents the bridge el-
ement integrating the BPs and the enterprises’ infor-
mation system.
The simulator can be called into action after the
completion of the modeling task. The objective of
the simulation is to estimate the values of some pre-
defined process KPIs. Results from the simulation are
used to refine the process design and, if the case, re-
run the simulation. This step may be iterated until
the estimated KPIs get close to those established by
the business objectives. We did not implement a new
simulation engine, rather, we searched for well known
techniques and robust solutions which might grant the
achievement of our objectives. In particular, the main
requirement the simulator ought to fulfill was the ca-
pability of simulating “annotated” business processes,
i.e., business processes to which supplementary in-
formation is associated. We ended up choosing a
tool based on the Colored Petri Nets (CPNet) (Jensen,
1996). The approach of simulating business processes
defined in the BPMN notation through Petri Nets is
not new in the literature (Dijkman et al., 2008). What
instead may be considered a novelty in our approach
is the integration of the BPMN with additional models
and the mapping of the integrated models on a CPNet.
In Figure 3 the overall architecture of the dis-
cussed system is depicted. In order to be able to feed
a CPNet simulator with well structured data, we had
to design an ad-hoc component called Model Map-
per which parses the BP
mod
, R
mod
and BD
mod
, and
maps the parsed data onto Petri Net Markup Lan-
guage (pnml) structured data, which is a data format
Figure 3: System architecture.
ready to be submitted to a timed CPNet. For the pur-
pose of this work, the Renew tool (Kummer et al.,
2004) was used as a simulation environment. Such a
tool supports the development and execution of Petri
Nets and enables a seamless integration with the Java
Runtime Environment. This last feature allowed us to
run resource-awaresimulations of business processes.
4.1 Model Mapper
This section discusses some technical details of the
mapping process carried out by the Model Mapper
component. The Mapper is charged of parsing the
BP
mod
, iterating on each BPMN element, enriching
it with information retrieved from the R
mod
and the
BD
mod
, and finally creating the corresponding CPNet
network. Such network is the configuration file to be
passed to the Renew tool (Kummer et al., 2004) for
actual simulation. For space reason, in this paper we
can not describe the mapping of all BPMN elements,
therefore we are going to focus on just two (yet repre-
sentative) of them: the Send Task and the Exclusive
Gateway.
In Figure 4 the mapping of a very simple example
of a send task has been depicted.
In the uppermost part of the figure, the three in-
stances of BP
mod
, R
mod
and BD
mod
are reported. At
the bottom of the figure, the result of the mapping pro-
cedure is shown. As the reader may notice from the
AResource-awareSimulationToolforBusinessProcesses
127

Applicant
id: Clerk
unit: #HR · h
unitCost: 15.00 €
amount: 2
OrganizationalPosition
BP
mod
R
mod
id: Paper
unit #Paper
unitCost: 0.02012 €
amount: 5732
ConsumableResource
id: Energy
unit: kWh
unitCost: 0.29625 €
DurableResource
id: request missing documents
unit: min
duration = Pert(11,19,45)
requirements: {
requirement: {
resource: Energy
unit: W
amount: Normal(250, 12.06)
rateOfUsage: [{(1,1), LINEAR}]
}
requirement: {
resource: Clerk
unit: #HR
amount: Constant(1)
rateOfUsage: [{(0,1), STEP}]
}
requirement: {
resource: Paper
unit: #Paper
amount: Shift(4, Binomial(4, 0.233))
rateOfUsage: [{(.2,.5), STEP},
{(.4,.8), STEP}, {(.6, 1), STEP}]
}
}
Activity
BD
mod
Clerk
x
1
x
2
request missing
documents
y
2
new documents
requested
A
RMD
S
NDR
p(x
1
, A
RMD,1
) p(A
RMD,1
, A
RMD,2
) p(A
RMD,2
, A
RMD,3
)
guard R
EN
.isAvailable(Q
RMD,EN
, D
RMD
);
guard R
CL
.isAvailable(Q
RMD,CL
, D
RMD
);
guard R
PA
.isAvailable(Q
RMD,PA
, D
RMD
);
action A
RMD
.reserve(R
EN
, Q
RMD,EN
, D
RMD
);
action A
RMD
.reserve(R
CL
, Q
RMD,CL
, D
RMD
);
action A
RMD
.reserve(R
PA
, Q
RMD,PA
, D
RMD
);
A
RMD,2
p(A
RMD
,x) p(R
EN
,x) p(R
CL
,x) p(R
PA
,x)
A
RMD,1
p(R
EN
,x) p(R
CL
,x) p(R
PA
,x)p(A
RMD
,x)
action Q
RMD,EN
= A
RMD
.requirement(R
EN
).amount();
action Q
RMD,CL
= A
RMD
.requirement(R
CL
).amount();
action Q
RMD,PA
= A
RMD
.requirement(R
PA
).amount();
action D
RMD
= A
RMD
.duration();
1. requirements generation 2. requirements acquisition
@D
RMD
3. requirements utilization
action A
RMD
.consume(R
EN
,Q
RMD,EN
,D
RMD
);
action A
RMD
.consume(R
CL
,Q
RMD,CL
,D
RMD
);
action A
RMD
.consume(R
PA
,Q
RMD,PA
,D
RMD
);
A
RMD,3
p(A
RMD
,x) p(R
EN
,x) p(R
CL
,x) p(R
PA
,x)
p(A
RMD,3
, A
RMD,4
)
p(A
RMD,4
, x
2
)p(A
RMD,3
, A
RMD,4
)
A
RMD,4
p(A
RMD,4
, S
NDR
) S
NDR
p(S
NDR
, y
2
)
4. send task to start event subprocess flow
Figure 4: Mapping of a “send” task.
BP
mod
, two actors are involved in two different pro-
cesses, of which one is an internal enterprise’s pro-
cess, the other is not. The Clerk owns the internal
process and is committed the task of sending a re-
quest for some documents. Let us notice that the
Clerk is also a resource which is exploited by the
task. Other resources which are consumed by the
task, and thus are listed in the R
mod
, are Energy, Pa-
per, Letter, Stamp, Printer (which carries its depre-
ciation cost) and Office (which carries its rent cost).
In the figure, for space reason only Clerk, Energy and
Paper have been reported. Finally, the BD
mod
spec-
ifies some requirements regarding the association of
the task and the cited resources. For example, the first
listed requirement states that for Energy is required
an amount of watts described by a Normal distribu-
ICE-B2014-InternationalConferenceone-Business
128

task j
x
x @ D
j
Q
j,0
Q
j,1
Γ
j,1
(ß
j
)
t
x @ ß
j
· D
j
Γ
j,0
(ß
j
)
X
C
[x, 1 · Q
j,0
, 1 · Q
j,1
]
X
F
[x, Γ
j,0
(ß
j
) · Q
j,0
, Γ
j,1
(ß
j
) · Q
j,1
]
resource 0 resource 1
X
0
t : simulation time
x : process instance
T
j
: task j activation time
Q
j,k
: total quantity of resource k consumed by task j
D
j
: task j duration
ß
j
: completion rate of task j [ ß
j
= (t - T
j
) · D
j
-1
]
Γ
j,k
(ß
j
) : rate of resource k usage for task j
T
j
T
j
+ D
j
x @ ß
j
· D
j
X
T
[x, Γ
j,0
(ß
j
) · Q
j,0
, Γ
j,1
(ß
j
) · Q
j,1
]
Terminated by external eventFailed by internal event
Completed
Figure 5: Representation of two resources’ rates of usage.
tion with (µ = 250, σ = 12.06). For Clerk, just one
unit is required.
The rateOfUsage parameter appears in all require-
ments and defines the law of consumption for the pair
task-resource being considered. In practice, if the task
is successfully completed, the resource is considered
to be consumed as a whole with respect to the ex-
pressed amount; if instead the task is preempted or
fails for any reason, then the rateOfUsage states what
is the rate of the resource that must be considered con-
sumed. The reader may refer to Figure 5 for details
about the rateOfUsage concept.
The task operational logic consists of a sequence
of three phases that are responsible for processing the
given resources:
1. requirements generation;
2. requirements acquisition;
3. requirements utilization.
Every process instance token that reaches a task
needs to pass through these phases for the task to com-
plete successfully.
The Mapper translates these three phases in a se-
quence of three transitions. Depending on the num-
ber of task’s incoming and/or outgoing sequence/mes-
sage flows, one more transition is put before (phase 0)
and/or after (phase 4) these three to perform the cor-
responding workflow logic.
In the simulation initialization phase, a number of
BD
mod
’s classes are instantiated and fed to the CPN
as tokens, each one located in its own place. These
places are shared between multiple transitions and
BP
mod
id: application complete?
condition: Uniform(0, 1)
conditionalFlows: {
conditionalFlow: {
id: application incomplete
interval: [0, .086[
}
}
defaultFlowInterval: [.086, 1]
ExclusiveGateway
BD
mod
x
1
x
2
XG
AC
p(x
1
, XG
AC,1
)
XG
AC,1
p(XG
AC,1
, XG
AC,2
)
p(XG
AC
,x)
action C
AC
= XG
AC
.condition()
1. condition generation
p(XG
AC,2
, x
2
)
XG
AC,2
2. gateway output flow
XG
XG
XG
XG
XG
x
3
application
complete?
application incomplete
p(XG
AC,2
, x
3
)
XG
AC,2
guard XG
AC
.conditionalFlow(C
AC
, “application incomplete”)
guard XG
AC
.defaultFlow(C
AC
)
Figure 6: Mapping of an “exclusive gateway”.
connected by reserve arcs, so that when such tran-
sitions fire, a series of actions can be performed on
the BD
mod
’s instances. On the transition input side,
the Renew tool permits to control its firing by equip-
ping it with guard inscriptions. Guard inscriptions are
expressions that are prefixed with the reserved word
guard. A transition may only fire if all of its guard
inscriptions evaluate to true. On the transition output
side, the tool allows the execution of a certain num-
ber of expressions at its firing time by equipping it
with action inscriptions. Action inscriptions are ex-
pressions preceded with the keyword action and are
guaranteed to be evaluated exactly once during the fir-
ing of a transition.
AResource-awareSimulationToolforBusinessProcesses
129
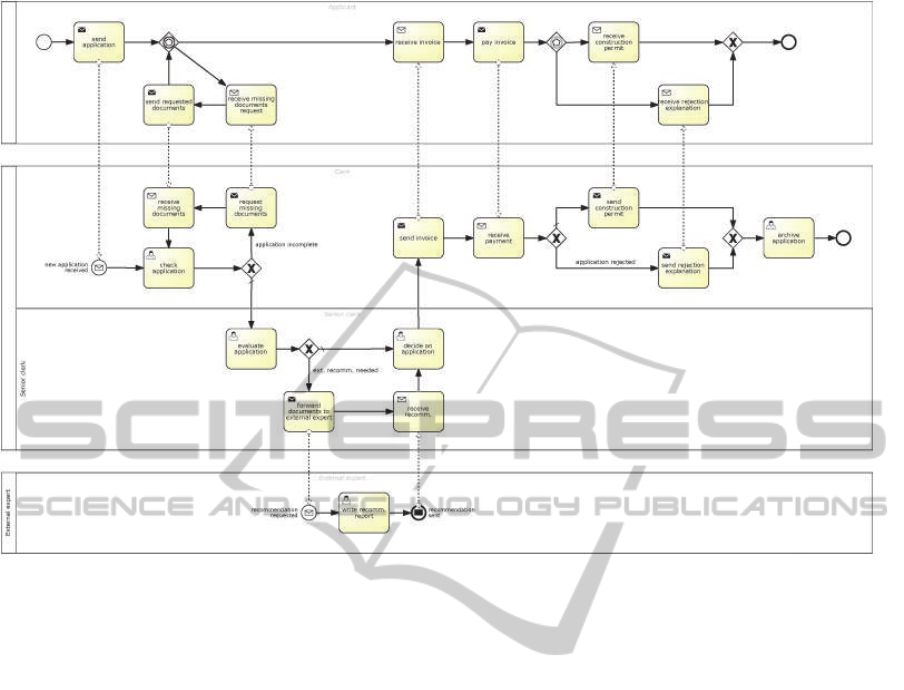
Figure 7: BPMN model of the example process.
With reference to Figure 4, before the send task
performs its workflow logic (phase 4), the three oper-
ational transitions need to be fired. Each of these tran-
sitions is connected through reserve arcs to a series
of places containing the needed BD
mod
’s instances to-
kens. As shown, these three transitions acquire the
bridge data from:
1. the place containing the particular BD
mod
’s activ-
ity instance A
j
(in the sense of Java class instance,
not to be confused with the BPMN concept of ac-
tivity instance);
2. all the places containing the BD
mod
’s resource in-
stances R
k
required by the activity.
During phase 1, the activity work requirements are
generated. When transition A
j,1
fires, activity A
j
re-
quirements are generated as quantity Q
j,k
of resource
R
k
needs. Also, the activity duration D
j
is generated
in this step by applying the modeled probability distri-
bution. The generated requirements are then queued
into the execution token to grant their availability in
the next transitions. In particular, D
j
is also used as a
delay inscription in the transition A
j,3
input arc.
Phase 2 concerns the requirements acquisition,
that is, the transition A
j,2
fires only when all activity
requirements are available, eventually reducing their
resource’s residual amount by each quantity taken (re-
served).
In phase 3, only after the time D
j
has elapsed, the
work completes successfully with the firing of transi-
tion A
j,3
, in which the activity instance consumes the
allocated resources and internally augments its cost
by
∑
K
k=1
R
k
.getCost(Q
j,k
, D
j
).
The model allows activity interruption from an in-
terrupting boundary catch intermediate event or a par-
ent activity terminate throw end event. These events
are handled by other transitions that absorb the token
that might be in place p(A
j,1
, A
j,2
) or p(A
j,2
, A
j,3
).
Transition A
j,4
gets fired only if the activity success-
fully completes. The pattern (1, 2, 3) is used for every
task, while 4 depends on the particular task type.
In Figure 6 a simple example of an exclusive gate-
way has been depicted. In the BD
mod
, the choice of
which branch is to be followed is determined by a
uniformly distributed probability in the [0,1] range.
For the particular case, the “application incomplete”
branch is chosen if the randomly generated number
is less than 0.086. The token in place b(XG
j
, x) is
the BD
mod
’s exclusive gateway instance and is used
by transition XG
j,1
for randomly determining which
branch has to be taken.
5 USE CASE EXAMPLE
The designed simulator tool has been tested on a sim-
ple yet not trivial use case. In this Section results
ICE-B2014-InternationalConferenceone-Business
130

Figure 8: Simulation parameters.
from the simulation are reported and discussed. The
BPMN model of the considered use case is shown in
Figure 7. It represents the process of releasing a con-
struction permit by a Building Authority of a city.
The whole process involves different actors who
interacts to each other exchanging information and/or
documents (represented in the model as specific mes-
sages). The involved actors are:
• Applicant: it is the private citizen/company who
needs to obtain the building permit and triggers
the whole process;
• Clerk: it is the front-office employee of the
Building Authority who receives the Application
and is in charge of a) checking the documentation
of the application, b) interacting with the appli-
cant in order to obtain required documents and c)
sending back the result of the application;
• Senior Clerk: it is the back-office employee of
the Building Authority who evaluates and decides
on the application;
• Expert: it is an external expert who may be called
upon by the Senior Clerk whenever specific tech-
nical issues arise and the final decision may not be
autonomously taken.
The business process spans four swimlanes, one
for each actor. Both the Applicant and the Expert
are external entities, i.e., are not part of the enter-
prise’s business process dynamics. While there was
no reason to represent the Applicant in the resource
model, the Expert was modeled as a DurableResource
(paid by the hour). The Clerk and the Senior Clerk
were modeled as OrganizationalPosition. Other con-
AResource-awareSimulationToolforBusinessProcesses
131

!"#$%!&"'(')&*+,+*-
)!&.+,"'
)//0+&)*+$1
&."&2'
)//0+&)*+$1
3"&+3"'$1'
)//0+&)*+$1
",)0%)*"'
)//0+&)*+$1
4$!5)!3'
3$&%6"1*#'*$'
"7*"!1)0'"7/"!*
!"&"+,"'6+##+18'
3$&%6"1*#
!"&"+,"'/)-6"1* !"&"+,"'!"&$669
!":%"#*'6+##+18'
3$&%6"1*#
#"13'
&$1#*!%&*+$1'
/"!6+*
#"13'+1,$+&"
#"13'!";"&*+$1'
"7/0)1)*+$1
5!+*"'!"&$669'
!"/$!*
<=<>?
@0"!2 !"#$!! %&#!'$() *!$+( (%%$+' ()*$%% *'+$#* *)"$%) !#$'! A9BCDEFD
G"1+$!'@0"!2 *!!$,! %#'&#'*$!( ("$," ('$,# HIH9AJHEBK
L7*"!1)0'L7/"!* ),&+!#$)* AM9KCIEAD
L1"!8- ++$#% (&,%($', '$*+ '$)% ,$'( %($%# %)$%, ($'* J9IFAEFK
#*)6/ *"$!' ('%$!' %%($'' (($*' AIKECF
/)/"! %($*' %(!$'' (#$'' +$!' HMJEFF
<=<>? CBIECC H9BHCEFA DCCEMC HIA9KHCECB AFEJD DCEKJ JHHEKF JHEFB AFAEHA MDKECH KBJEAH BIEHF AM9KCIEAD JJC9JHDEBM
)&*+,+*-'('$N;"&*
%1+*# O)+1*"1)1&"
P%+03+18'
Q"1$,)*+$1
R!"#"!,)*+$1'S'
Q"#*$!)*+$1
T!N)1'
Q"#*!%&*%!+18
<=<>? %1+*# O)+1*"1)1&"
P%+03+18'
Q"1$,)*+$1
R!"#"!,)*+$1'S'
Q"#*$!)*+$1
T!N)1'
Q"#*!%&*%!+18
<=<>?
)!&.+,"')//0+&)*+$1 %*' +%($,% %+'$'+ %!$', %"$#) CBIECC % '$%" FEHB
&."&2')//0+&)*+$1 )*( %&*(%$+% *(,$") (#$%' )#$+' H9BHCEFA
FEFF
3"&+3"'$1')//0+&)*+$1 %*' )*)$*' %''$'( %'$'' %)$)* DCCEMC %)+ %"&%#+$), ),&",)$), !**$%# ++%$#* KI9AKDEMK
",)0%)*"')//0+&)*+$1 (#' %)+&#++$#* )"&)%)$), )&,'*$,% *&!*($,# HIA9KHCECB (,! %!&)"!$,! !&%,%$*( ))!$*, )#,$*, JA9JBJEHJ
4$!5)!3'3$&%6"1*#'*$'"7*"!1)0'"7/"!* #( (%$)! *$!# ($') ($%, AFEJD #( )&((!$#" +&)*,$%+ #"*$)% (&+,#$#' HJ9FDMEHK
!"&"+,"'6+##+18'3$&%6"1*# )% )%$%( %+$*' DCEKJ
FEFF
!"&"+,"'/)-6"1* %*' %++$%% *+$*) *$** !$+) JHHEKF FEFF
!"&"+,"'!"&$66"13)*+$1 #( %+$'( )$'* %$*, %$+! JHEFB ,! )&"+"$** ,++$(! %&,%#$*+ +&#+)$*' HJ9JICEKK
!":%"#*'6+##+18'3$&%6"1*# !( (')$%* ""$"" AFAEHA
FEFF
#"13'&$1#*!%&*+$1'/"!6+* (+( ++,$#% %*,$*' %,$,' (($!" MDKECH %* '$)# FEAI
#"13'+1,$+&" (#' *)+$,+ %(,$%% %%$"" %,$*! KBJEAH # '$## '$*) '$(* HEKK
#"13'!";"&*+$1'"7/0)1)*+$1 (# !($,% )+$)" BIEHF
FEFF
5!+*"'!"&$66"13)*+$1'!"/$!* *% (!&%*($), +&+,%$") (&","$"! (&#,*$'# AM9KCIEAD FEFF
<=<>? H9BFF HCK9MKMEIC DC9FDHEMA C9MMCEDC M9CAIEBA JJC9JHDEBM KBJ DJ9MCBEKA KF9JDIEFJ A9KBAEDH B9AMHEMD HFK9BIJECB
4$!5)!3'
!"&"+,"'6+##+18'
!":%"#*'6+##+18'
#"13'!";"&*+$1' 5!+*"'!"&$669'
P%+03+18' R!"#"!,)*+$1'S' T!N)1'
P%+03+18' R!"#"!,)*+$1'S' T!N)1'
-./01-2.342567658920/59-.:0-59;<=
4256765830>?.259@1.1.956A.9-.:0-59;B=4256765830>?.259@1.1.956A.9-.:0-59;B=
C2.D4-609%
-./01-2.342567658920/59-.:0-59;<=
4256765830>?.25920/59-.:0-59;<=
Figure 9: Scenario 1 costs and times report.
!"#$%!&"'(')&*+,+*-
)!&.+,"'
)//0+&)*+$1
&."&2'
)//0+&)*+$1
3"&+3"'$1'
)//0+&)*+$1
",)0%)*"'
)//0+&)*+$1
4$!5)!3'
3$&%6"1*#'*$'
"7*"!1)0'"7/"!*
!"&"+,"'6+##+18'
3$&%6"1*#
!"&"+,"'/)-6"1* !"&"+,"'!"&$669
!":%"#*'6+##+18'
3$&%6"1*#
#"13'
&$1#*!%&*+$1'
/"!6+*
#"13'+1,$+&"
#"13'!";"&*+$1'
"7/0)1)*+$1
5!+*"'!"&$669'
!"/$!*
<=<>?
@0"!2 ,,%$"# %&"('$#( )#$), ()($#* %"!$,' *+'$++ *#!$+, !,$*+ D9HCKEJB
G"1+$!'@0"!2 +%)$** %""&#",$!' (+$%, %,$') JFF9DKAEJD
L7*"!1)0'L7/"!* )'&)##$++ AF9AIIEKK
L1"!8- +,$!( (&""#$*! '$)# '$(! +$"' %)$+( %*$!' ($'( A9FBJEMC
#*)6/ *%$!' ((#$#' %()$(' %,$!' DHHEJF
/)/"! %'$*' %*)$'' )'$#' *$*' HIIECF
<=<>? MMHEBI H9BMIEDD KHAEDD JFJ9IBCEFC JKEKK AIEAM JAJEID HMEJB JKDECF IAKEIC CKKEHM BHEDM AF9AIIEKK JAI9CBBECD
)&*+,+*-'('$N;"&*
%1+*# O)+1*"1)1&"
P%+03+18'
Q"1$,)*+$1
R!"#"!,)*+$1'S'
Q"#*$!)*+$1
T!N)1'
Q"#*!%&*%!+18
<=<>? %1+*# O)+1*"1)1&"
P%+03+18'
Q"1$,)*+$1
R!"#"!,)*+$1'S'
Q"#*$!)*+$1
T!N)1'
Q"#*!%&*%!+18
<=<>?
)!&.+,"')//0+&)*+$1 %+* !)'$), %%'$#% (!$(" *$+' MMHEBI %( )$# AEID
&."&2')//0+&)*+$1 )!' %&!(%$") ("%$#' +!$)% #$*' H9BMIEDD %# )$# ($' KEMK
3"&+3"'$1')//0+&)*+$1 %+* *('$'# ,)$)+ %!$!, )$)) KHAEDD %)( %%&,!+$+ (!%$* !+*$) #+$! HJ9MCCEBA
",)0%)*"')//0+&)*+$1 )'# %!+&)+%$"# ("&%*!$,% ,&'%%$(+ %&)#!$%( JFJ9IBCEFC (+* %%&#!)$* %&(,%$( %!!$' %,$, HA9AHIEAF
4$!5)!3'3$&%6"1*#'*$'"7*"!1)0'"7/"!* !# %,$)+ *$%+ *$'+ JKEKK !( ()($# ()$( )#"$% CDKEFD
!"&"+,"'6+##+18'3$&%6"1*# (! ("$,# #$+" AIEAM
FEFF
!"&"+,"'/)-6"1* %+* %"'$+" )($,( ,$"! %$+, JAJEID %) ($" %$! DEDC
!"&"+,"'!"&$66"13)*+$1 !# %($(" ($+, ($*) HMEJB +# %&+,#$# *($) (%$+ H9CDJEKM
!":%"#*'6+##+18'3$&%6"1*# +( %"*$*( !'$%# JKDECF
FEFF
#"13'&$1#*!%&*+$1'/"!6+* (#! ,')$(% %'"$#! %,$+' +$)' IAKEIC "# )$+ '$+ DEFD
#"13'+1,$+&" )'# +),$(+ "($%+ (%$)* *$*) CKKEHM ), %!$# *$% %$, '$( JJEBF
#"13'!";"&*+$1'"7/0)1)*+$1 (( *,$(, (!$** %,$,! BHEDM # '$( FEHM
5!+*"'!"&$66"13)*+$1'!"/$!* )* (%&*,+$+* *&*!($,) *&*+'$(# AF9AIIEKK
FEFF
<=<>? H9BBD HBH9JAJEFM AD9DJJEFM HH9CAHEID H9DHAECC JAI9CBBECD CBJ JK9DMHEK H9CFCEA H9JAJEM HFAEK JI9DHAEBB
4256765830>?.259@1.1.956A.9-.:0-59;B=
-./01-2.342567658920/59-.:0-59;<=
4256765830>?.259@1.1.956A.9-.:0-59;B=
C2.D4-609(
4256765830>?.25920/59-.:0-59;<=4256765830>?.25920/59-.:0-59;<=
Figure 10: Scenario 2 costs and times report.
sidered resources in the scenario are energy, modeled
as DurableResource, paper and stamps, both modeled
as ConsumableResource.
As for the simulation scenario, four types of per-
mits (representing the “cost objects” in the ABC
terminology) were considered: Maintenance, Build-
ing Renovation, Preservation&Restoration and Ur-
ban Restructuring. The Expert’s advice is always
requested for applications requiring permits of type
Preservation&Restoration; for other types of appli-
cation the Expert is called upon with a likelihood
which follows a Uniform distribution (typically, 25%
of times the Expert is involved). In Figure 8 the com-
plete set of simulation parameters, modeled according
to the specification of the R
mod
and BP
mod
discussed
in the Section 3, are depicted.
We ran two simulations for two different scenar-
ios. The scenarios differs for just the number of units
of employed internal human resources. In the sce-
nario n.1 two Clerks and one Senior Clerk were em-
ployed, while in scenario n.2 one Clerk and two Se-
nior Clerks were employed. For each scenario the
measures taken into account were monetary costs,
work times and queue times respectively. Figures 9
and 10 depict reports of analytical costs and queue
times computed for the two scenarios. In particular,
costs incurred for the allocation of resources to ac-
tivities are reported in the section “resource-activity
cost” of the report; activity costs absorbed by the four
cost objects are instead shown in the section “activity-
object cost” of the same report. As for the times,
those spent by object costs waiting for activities to
start have been reported.
The reader may notice that scenario n.1 shows a
very unproductive usage of the two Clerk resources,
given that the total cost over the three years period
adds up to about e4.000,00 and, also, no queue time
is found for their own activities (archive application,
check application, receive missing documents, receive
payment, request missing documents and send rejec-
tion explanation), which can be interpreted as an over-
availability of the resource. On the other side, Senior
Clerk seems to be overloaded, as their average queue
time is about 180 hours per application. By reduc-
ing the Clerk units to just one and adding a new Se-
nior Clerk position, Scenario n.2 introduces a slight
increment of 5.5% in overall costs but succeeds in re-
covering 73,2% of time globally spent in queue (wait)
ICE-B2014-InternationalConferenceone-Business
132

by construction permit requests, thus gaining a better
resource (just human resource in this simple case) al-
location configuration.
6 CONCLUSIONS
In the past decade there has been a growing interest
of enterprises towards the Business Process Manage-
ment’s methodology and techniques. Field experts
agree that one of the most critical step in the man-
agement of business processes is process analysis and
modeling. Simulation tools may help designers to
tune the process model before actually implement-
ing and deploying processes in their execution envi-
ronments. Most of existing tools lack the capability
of integrating process characteristics and the enter-
prise’s resources which are directly involved in the
process execution. This paper presented a proposal
of a simulator of business processes which integrates
a resource model designed according to the ABC ac-
counting principles. The simulator leverages the func-
tionality provided by a CPNet tool to run simula-
tions of processes which are modeled through BPMN
and have been “enriched” with information regarding
types and quantity of involved resources. Main tech-
nical features of the simulator have been discussed
throughout the paper and some explicative examples
of how the whole framework works have been pro-
vided. A concrete enterprise’s use case was also sim-
ulated and the obtained results have been discussed.
REFERENCES
Betz, S., Hickl, S., and Oberweis, A. (2011). Risk-
aware business process modeling and simulation using
XML nets. In Proceedings - 13th IEEE International
Conference on Commerce and Enterprise Computing,
CEC 2011, pages 349–356.
Coalition, W. M. (2012). XPDL: XML process definition
language (Version 2.2). http://www.xpdl.org.
Cooper, R. and Kaplan, R. S. (1992). Activity-based sys-
tems: Measuring the costs of resource usage. In Ac-
counting Horizons, volume 6, pages 1–12.
Dijkman, R. M., Dumas, M., and Ouyang, C. (2008).
Semantics and analysis of business process models
in BPMN. Information and Software Technology,
50(12):1281–1294.
Gottschalk, F., van der Aalst, W., Jansen-Vullers, M., and
Verbeek, H. (2008). Protos2CPN: Using colored Petri
nets for configuring and testing business processes. In-
ternational Journal on Software Tools for Technology
Transfer, 10(1):95–110.
Jansen-vullers, M. H. and Netjes, M. (2006). Business pro-
cess simulation a tool survey. In In Workshop and
Tutorial on Practical Use of Coloured Petri Nets and
the CPN.
Januszczak, J. and Hook, G. (2011). Simulation standard
for business process management. In Proceedings -
Winter Simulation Conference, pages 741–751.
Jensen, K. (1996). Coloured Petri Nets: Basic Concepts,
Analysis Methods and Practical Use. Springer-Verlag,
London, UK.
Koizumi, S. and Koyama, K. (2007). Workload-aware
business process simulation with statistical service
analysis and Timed Petri Net. In Proceedings -
2007 IEEE International Conference on Web Services,
ICWS 2007, pages 70–77.
Kummer, O., Wienberg, P., Duvigneau, M., Schumacher, J.,
Khler, M., Moldt, D., Rlke, H., and Valk, R. (2004).
An extensible editor and simulation engine for petri
nets: RENEW. Lecture Notes in Computer Science,
3099:484–493.
OMG (2011). Business Process Model and Notation
(BPMN 2.0). http://www.omg.org/spec/BPMN/2.0/.
Porter, M. E. (1985). Competitive advantage: Creating and
sustaining superior performance. Free Press.
Tjoa, S., Jakoubi, S., Goluch, G., Kitzler, G., Goluch, S.,
and Quirchmayr, G. (2011). A formal approach en-
abling risk-aware business process modeling and sim-
ulation. Services Computing, IEEE Transactions on,
4(2):153–166.
Van der Aalst, W. M. P., Nakatumba, J., Rozinat, A., and
Russell, N. (2008). Business process simulation: How
to get it right. In International Handbook on Business
Process Management. Springer-Verlag.
Van der Aalst, W. M. P. and Ter Hofstede, A. H. M. (2005).
YAWL: Yet Another Workflow Language. Informa-
tion Systems, 30(4):245–275.
Vara, J. L. and S´anchez, J. (2009). Bpmn-based speci-
fication of task descriptions: Approach and lessons
learnt. In Proceedings of the 15th International Work-
ing Conference on Requirements Engineering: Foun-
dation for Software Quality, pages 124–138. Springer-
Verlag.
Vergidis, K., Tiwari, A., and Majeed, B. (2008). Busi-
ness Process Analysis and Optimization: Beyond
Reengineering. Systems, Man, and Cybernetics, Part
C: Applications and Reviews, IEEE Transactions on,
38(1):69–82.
Weske, M. (2012). Business Process Management: Con-
cepts, Languages, Architectures (2nd ed.). Springer-
Verlag.
AResource-awareSimulationToolforBusinessProcesses
133
