
A Visual Approach to the Empirical Analysis of Social Influence
Chiara Francalanci and Ajaz Hussain
Department of Electronics, Information and Bio-Engineering, Politecnico di Milano, I - 20133 Milano, Italy
Keywords:
Sentiment Analysis, Semantic Networks, Power Law Graphs, Social Influence.
Abstract:
This paper starts from the observation that social networks follow a power-law degree distribution of nodes,
with a few hub nodes and a long tail of peripheral nodes. While there exist consolidated approaches supporting
the identification and characterization of hub nodes, research on the analysis of the multi-layered distribution
of peripheral nodes is limited. In social media, hub nodes represent social influencers. However, the literature
provides evidence of the multi-layered structure of influence networks, emphasizing the distinction between
influencers and influence. The latter seems to spread following multi-hop paths across nodes in peripheral
network layers. This paper proposes a visual approach to the graphical representation and exploration of pe-
ripheral layers and clusters to exploit underlying concept of k-shell decomposition analysis. The core concept
of our approach is to partition the node set of a graph into hub and peripheral nodes. Then, a power-law
based modified force-directed method is applied to clearly display local multi-layered neighbourhood clusters
around hub nodes. Our approach is tested on a large sample of tweets from the tourism domain. Empirical
results indicate that peripheral nodes have a greater probability of being retweeted and, thus, play a critical
role in determining the influence of content. Our visualization technique helps us highlight peripheral nodes
and, thus, seems an interesting tool to the visual analysis of social influence.
1 INTRODUCTION
The literature on social media makes a distinction be-
tween influencers and influence. The former are so-
cial media users with a broad audience. For exam-
ple, influencers can have a high number of followers
on Twitter, or a multitude of friends on Facebook,
or a broad array of connections on LinkedIn. The
term influence is instead used to refer to the social
impact of the content shared by social media users.
The breadth of the audience was considered the first
and foremost indicator of influence for traditional me-
dia, such as television or radio. However, traditional
media are based on broadcasting rather than commu-
nication, while social media are truly interactive. It is
very common that influencers say something totally
uninteresting and, as a consequence, they obtain lit-
tle or no attention. On the contrary, if social media
users are interested in something, they typically show
it by participating in the conversation with a variety
of mechanisms and, most commonly, by sharing the
content that they have liked. (Boyd et al., 2010) has
noted that a content that has had an impact on a user’s
mind is shared. Influencers are prominent social me-
dia users, but we cannot expect that the content that
they share is bound to have high influence, as dis-
cussed by (Benevenuto et al., 2010).
In previous research, (Bruni et al., 2013; Klotz
et al., 2014) has shown how the content of mes-
sages can play a critical role and can be a determi-
nant of the social influence of a message irrespec-
tive of the centrality of the message’s author. Re-
sults suggest that peripheral nodes can be influential:
this paper starts from the observation made by (Chan
et al., 2004) that social networks of influence follow a
power-law distribution function, with a few hub nodes
and a long tail of peripheral nodes, consistent with the
so-called small-world phenomenon as noted by (Xu
et al., 2007). In social media, hub nodes represent
social influencers, but influential content can be gen-
erated by peripheral nodes and spread along possibly
multi-hop paths originated in peripheral network lay-
ers. The ultimate goal of our research is to under-
stand how influential content spreads across the net-
work. For this purpose, identifying and positioning
hub nodes is not sufficient, while we need an approach
that supports the exploration of peripheral nodes and
of their mutual connections.
In this paper, we exploit a modified power-law
based force-directed algorithm (Hussain et al., 2014)
to highlight the local multi-layered neighborhood
clusters around hub nodes. The algorithm is based on
319
Francalanci C. and Hussain A..
A Visual Approach to the Empirical Analysis of Social Influence.
DOI: 10.5220/0004992803190330
In Proceedings of 3rd International Conference on Data Management Technologies and Applications (DATA-2014), pages 319-330
ISBN: 978-989-758-035-2
Copyright
c
2014 SCITEPRESS (Science and Technology Publications, Lda.)

the idea that hub nodes should be prioritized in laying
out the overall network topology, but their placement
should depend on the topology of peripheral nodes
around them. In our approach, the topology of pe-
riphery is defined by grouping peripheral nodes based
on the strength of their link to hub nodes, as well as
the strength of their mutual interconnections, which
is metaphor of k-shell decomposition analysis (Kitsak
et al., 2010; Carmi et al., 2007).
The ultimate goal of our research is to under-
stand how influential content spreads across the net-
work. For this purpose, identifying and positioning
hub nodes is not sufficient, while we need an approach
that supports the exploration of peripheral nodes and
of their mutual connections. In this paper, we exploit
a modified force-directed algorithm (Hussain et al.,
2014) to highlight the local multi-layered neighbor-
hood clusters around hub nodes. The algorithm is
based on the idea that hub nodes should be prioritized
in laying out the overall network topology, but their
placement should depend on the topology of periph-
eral nodes around them. In our approach, the topol-
ogy of the periphery is defined by grouping peripheral
nodes based on the strength of their link to hub nodes,
as well as the strength of their mutual interconnec-
tions.
The approach is tested on a large sample of tweets
expressing opinions on a selection of Italian locations
relevant to the tourism domain. Tweets have been se-
mantically processed and tagged with information on
a) the location to which they refer, b) the location’s
brand driver (or category) on which authors express
an opinion, c) the number of retweets, and d) the
identifier of the retweeting author. With this infor-
mation, we draw corresponding multi-mode networks
highlighting the connections among authors (retweet-
ing) and their interests (brand, category, and senti-
ment) by aesthetically pleasant layouts. By visually
exploring and understanding multi-layered periphery
of nodes in clusters, we also propose few content re-
lated hypothesis in order to understand network be-
haviour and relationship among frequency, specificity,
retweets
and expressed sentiments in tweets. Insights
on the relationship among would help social media
users make their behavioural decisions. Social media
users are aware that a post is influential if it raises at-
tention from other users (Anger and Kittl, 2011). Re-
sults highlight the effectiveness of our approach, pro-
viding interesting visual insights on how unveiling the
structure of the periphery of the network can visually
show the potential of peripheral nodes in determining
influence and content relationship.
The remainder of this paper is structured as fol-
lows. Section 2 discusses limitations of existing se-
mantic network drawing techniques and tools, and in-
fluence in social media. Section 3 briefs about the im-
plementation aspects of our work. Section 4 presents
the experimental methodology, performance evalua-
tion, results and benchmark comparison. Conclusions
are drawn in Section 5.
2 STATE OF THE ART
In this section, we will discuss about limitations of ex-
isting network visualization techniques. We will also
briefly highlights few aspects of influencers and influ-
ence in social media.
2.1 Network Visualization Techniques
Several research efforts in network visualization have
targeted power-law algorithms and their combination
with the traditional force-directed techniques, as for
example in (Chan et al., 2004; Andersen et al., 2004;
Boutin et al., 2006; Andersen et al., 2007). Among
these approaches, the most notable is the Out-Degree
Layout (ODL) for the visualization of large-scale net-
work topologies, presented by (Chan et al., 2004; Per-
line, 2005). The core concept of the algorithm is the
segmentation of the network nodes into multiple lay-
ers based on their out-degree, i.e. the number of out-
going edges of each node. The positioning of network
nodes starts from those with the highest out-degree,
under the assumption that nodes with a lower out-
degree have a lower impact on visual effectiveness.
The topology of the network organization plays an
important role such that there are plausible circum-
stances under which the highly connected nodes or
the highest-betweenness nodes have little effect on the
range of a given spreading process. For example, if a
hub exists at the end of a branch at the periphery of a
network, it will have a minimal impact in the spread-
ing process through the core of the network, whereas
a less connected person who is strategically placed
in the core of the network will have a significant ef-
fect that leads to dissemination through a large frac-
tion of the population. To identify the core and the
multi-layered periphery of the clustered network we
use technique which is metaphor of the k-shell (also
called k-core) decomposition of the network, as dis-
cussed in (Kitsak et al., 2010). Examining this quan-
tity in a number of social networks enables us to iden-
tify the best individual spreaders in the multi-layered
periphery of clustered network when the spreading
originates in a single hub node.
DATA2014-3rdInternationalConferenceonDataManagementTechnologiesandApplications
320

2.2 Influencers and Influence in Social
Networks
Centrality metrics are the most widely used param-
eters for the structural evaluation of a user’s social
network. The concept of centrality has been defined
as the importance of an individual within a network
(Freeman, 1979). Centrality has attracted a consid-
erable attention as it clearly recalls notions like so-
cial power, influence, and prestige. A node that is
directly connected to a high number of other nodes is
obviously central to the network and likely to play an
important role (Sparrowe et al., 2001; Renoust et al.,
2013). A node with a high degree centrality has been
found to be more actively involved in the network’s
activities (Hossain et al., 2006).
The more recent literature has associated the com-
plexity of the concept of influence with the diversity
of content. Several research works have addressed the
need for considering content-based metrics of influ-
ence ((Bakshy et al., 2011; Naaman et al., 2010) and
(Suh et al., 2010). Clearly, this view involves a sig-
nificant change in perspective, as assessing influence
does not provide a static and general ranking of influ-
encers as a result. However, there is a need for effec-
tive visualization technique in social networks, which
enable user to visually explore large-scale complex
social networks to identify influencers in social net-
works. The layout should be aesthetically pleasant
and provide multi-layered periphery of the nodes in
clustered networks to exploit spread of influence in
social networks.
In this paper, we propose a power-law based
modified force-directed technique, as an earlier ver-
sion discussed in (Hussain et al., 2014) which also
metaphorically exploit k-shell decomposition analy-
sis technique (Kitsak et al., 2010). Our proposed
approach enables us to visually explore large-scale
complex social networks, and visually identifies so-
cial influencers among network. The influence seems
to spread across multi-layered periphery of nodes in
clustered and aesthetically pleasant graph layouts.
3 THE POWER - LAW
ALGORITHM
This section provides a high-level description of the
graph layout algorithm used in this paper. An early
version of the algorithm has been presented by (Hus-
sain et al., 2014). This paper improves the initial al-
gorithm by identifying multiple layers of peripheral
nodes around hub nodes. The power-law layout al-
gorithm belongs to the class of force-directed algo-
rithms, such as the one by (Fruchterman and Rein-
gold, 1991).
The base mechanism is that of starting from an
initial placement of graph nodes, and then iteratively
refining the position of the nodes according to a force
model. The iteration mechanism is controlled by
means of an innovative temperature cooldown step.
Algorithm 1 provides a high-level overview of the
whole algorithm by showing its main building blocks.
In order to re-produce the results and further study,
the detailed outlined methods can be found in earlier
version, presented by (Hussain et al., 2014).
Algorithm 1: Abstract power-law layout algo-
rithm structure.
1 begin
2 call NodeCharacterization();
3 call InitialLayout();
4 while Temperature > 0 do
5 if T emperature > T
h
then
6 call NodePlacement(N
h
, E
h
);
7 else
8 call NodePlacement(N
p
, E
p
);
9 end
10 call
TemperatureCooldown(T emperature);
11 end
12 end
The proposed approach is aimed at the exploita-
tion of the power-law degree distribution of data. Pro-
vided that the distribution of the degree of the nodes
follows a power law, we partition the set of nodes N
into the set of hub nodes N
h
and the set of peripheral
nodes N
p
, such that N = N
h
∪ N
p
, with N
h
∩ N
p
= ∅.
As a consequence, the set of edges E is also parti-
tioned in the set of edges E
h
for which at least one of
the two nodes is a hub node, and the set E
p
which con-
tains all the edges connecting only peripheral nodes,
with E = E
h
∪ E
p
, and E
h
∩ E
p
= ∅. The distinction
of a node n as a hub node or as a peripheral node
is based on the evaluation of its degree ρ(n) against
the constant ρ
h
, which is a threshold defined as the
value of degree that identifies the top i
th
percentile
of nodes, sorted by decreasing value of degree. Since
the power-law is supposed to hold in the degree distri-
bution, we have assumed i = 20 and consequently ρ
h
as the 20
th
percentile, thus considering as hub nodes
the 20% of the nodes with the highest values of de-
gree - the Pareto’s 80-20 Rule, as suggested by (Koch,
1999).
The NodeCharacterization step is a preprocessing
AVisualApproachtotheEmpiricalAnalysisofSocialInfluence
321

phase aimed at distinguishing hub nodes from periph-
eral nodes, so that in the following steps it is possi-
ble to leverage the power-law distribution of nodes
and assigning level value (l
s
) using k-shell decompo-
sition analysis technique. The InitialLayout step pro-
vides the initial placement of nodes (either a random
placement or another graph layout algorithm). The
NodePlacement(N, E) step performs the placement
of nodes based on the computation of forces among
nodes; its inputs are a node set N and an edge set E,
such that the placement of nodes can be selectively
applied to chosen subsets of nodes/edges at each step.
The TemperatureCooldown step is responsible for the
control of the overall iteration mechanism.
We tuned this algorithm by means of the metaphor
of k-shell decomposition analysis (Kitsak et al., 2010;
Carmi et al., 2007; Alvarez-Hamelin et al., 2006;
Abello and Queyroi, 2013), in order to define the con-
cept of level of each node in the multi-layered periph-
ery of our graphs. This process assigns an integer
as level index (l
s
) to each node, representing its lo-
cation according to successive layers (l shells) in the
network. Small values of (l
s
) define the periphery of
the network, while the innermost network levels cor-
respond to greater values of (l
s
), as shown in Figure
1.
Figure 1: Metaphor of k-shell decomposition analysis.
4 EXPERIMENTAL RESULTS
In this section, we will discuss about dataset that we
used in our experiment, and the network models that
we built from the dataset. We further will discuss the
obtained visualization results. Hypotheses pertaining
to visualization stand point have also been discussed
and empirically evaluated in this section.
4.1 Data Sample
We collected a sample of tweets over a two-month
period (December 2012 - January 2013). For the col-
lection of tweets, we queried the public Twitter APIs
by means of an automated collection tool developed
ad-hoc. Twitter APIs have been queried with the fol-
lowing crawling keywords, representing tourism des-
tinations (i.e. brands): Amalfi, Amalfi Coast, Lecce,
Lucca, Naples,Palermo and Rome. Two languages
have been considered, English and Italian. Collected
tweets have been first analysed with a proprietary se-
mantic engine in order to tag each tweet with infor-
mation about a) the location to which it refers, b) the
location’s brand driver (or category) on which authors
express an opinion, c) the number of retweets (if any),
and d) the identifier of the retweeting author.
Our data sample is referred to the tourism domain.
We have adopted a modified version of the Anholt Na-
tion Brand index model to define a set of categories
of content referring to specific brand drivers of a des-
tination’s brand (Anholt, 2006). Examples of brand
drivers are Art & Culture, Food & Drinks, Events &
Sport, Services & Transports, etc. A tweet is consid-
ered Generic if it does not refer to any Specific brand
driver, while it is considered Specific if it refers to at
least one of Anholt’s brand drivers. Tweets have been
categorized by using an automatic semantic text pro-
cessing engine that has been developed as part of this
research. The semantic engine can analyse a tweet
and assign it to one or more semantic categories. The
engine has been instructed to categorize according to
the brand drivers of Anholt’s model, by associating
each brand driver with a specific content category de-
scribed by means of a network of keywords. Each
tweet can be assigned to multiple categories. We de-
note with N
C
the number of categories each tweet w
is assigned to; the specificity S (w) of a given tweet w
is defined in Equation 1 as follows:
S
(
w
)
=
{
0, N
c
= 0
1, N
c
> 0
}
(1)
The data collection step has been followed by a
preliminary data analysis aimed to the statistical ex-
ploration of the characteristics of data distribution.
Results highlighted that all variables follow a power-
law distribution (Newman, 2005). Since the SEM tool
adopted for model verification provides only linear
regression to model variable relationships, each vari-
able has been represented on a logarithmic scale and
standardized. For the sake of clarity, the values re-
ported in Table 1 refer to the descriptive statistics of
the original non-linear variables.
4.2 Network Models
In order to verify the effectiveness of the proposed
algorithm with respect to the goal of our research, we
have defined different network models based on the
DATA2014-3rdInternationalConferenceonDataManagementTechnologiesandApplications
322
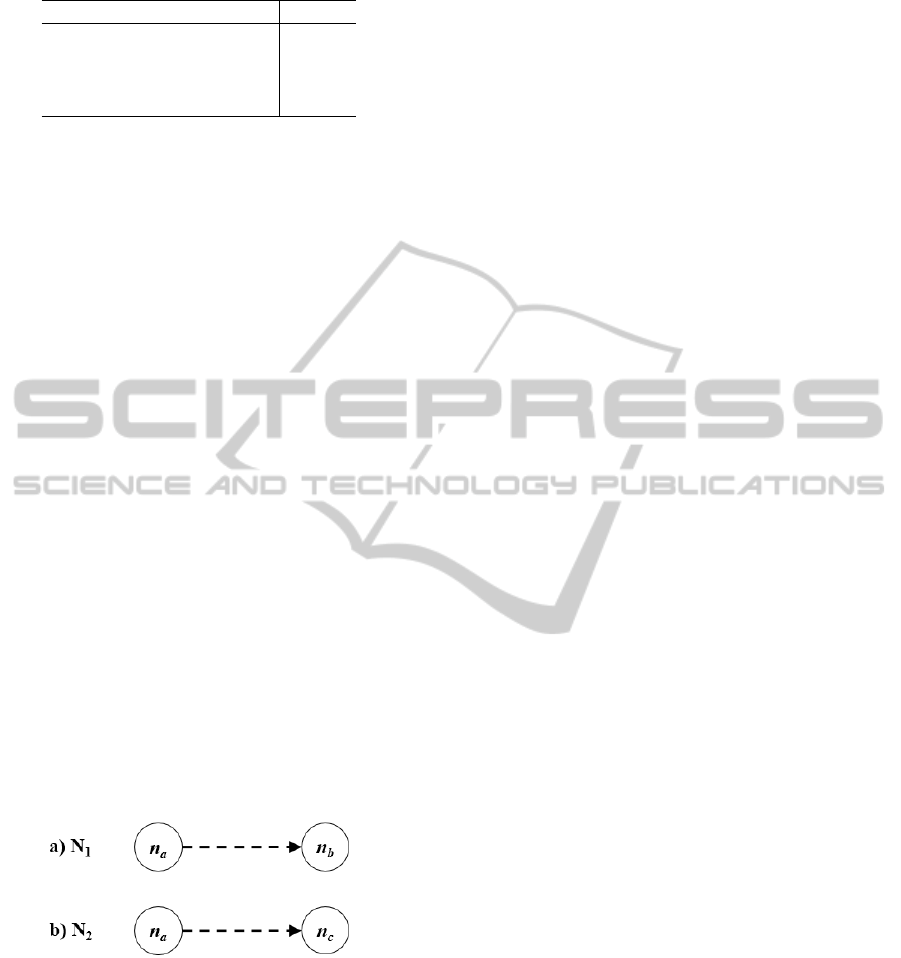
Table 1: Basic descriptive statistics of our data set.
Variable Value
Number of tweets 957,632
Number of retweeted tweets 79,691
Number of tweeting authors 52,175
Number of retweets 235,790
data set described in the previous section. Figure 2
provides an overview of the adopted network models.
• Author → Brand (N
1
): This model considers the
relationship among authors and domain brands,
i.e., touristic destinations in our data set. The net-
work is modelled as an undirected affiliation two-
mode network, where an author node n
a
is con-
nected to a brand node n
b
whenever author a has
mentioned brand b in at least one of his/her tweets.
The weight of the edge connecting n
a
to n
b
is pro-
portional to the number of times that author a has
named brand b in his/her tweets.
• Author → Category (N
2
): This model considers
the relationship among authors and domain brand
drivers (categories), i.e., city brand drivers in our
data set (namely, Arts & Culture, Events & Sports,
Fares & Tickets, Fashion & Shopping, Food &
Drink, Life & Entertainment, Night & Music, Ser-
vices & Transport, and Weather & Environmen-
tal). The network is modelled as an undirected af-
filiation two-mode network, where an author node
n
a
is connected to a category node n
c
whenever
author a has mentioned a subject belonging to
category c in at least one of his/her tweets. The
weight of the edge connecting n
a
to n
c
is propor-
tional to the number of times that author a has
named category c in his/her tweets.
Figure 2: Network Models a) N1: Author → Brand, b) N2:
Author → Category.
4.3 Discussion on Network
Visualization Results
Table 2 provides descriptive statistics on the size of
the N
1
and N
2
networks built with our data sam-
ple, based on the models described in Section 4.2.
The dataset contains network models with 7 distinct
brands representing tourism destinations and 10 do-
main brand drivers (i.e. categories), consistent with
Anholt’s model (Anholt, 2006).
The discussion on the results of network visual-
ization will adopt network N
1
network (i.e. Author
→ Brand) as reference example. Figure 3 provides
an enlarged view of network N
1
visualized by means
of the proposed power-law layout algorithm. A sum-
mary description for all the remaining networks N
1
and N
2
will follow at the end of this section.
The network visualization depicted in Figure 3
adopts multicoloured nodes to represent authors, and
highlighted encircled blue (dark) nodes to represent
the tourism destinations (i.e. brands) on which au-
thors have expressed opinions in their tweets. The
layout of the network produced by the power-law lay-
out algorithm clearly highlights that author nodes ag-
gregate in several groups and subgroups based on
their connections with brand nodes. The aggregation
of author nodes can be analysed from different per-
spectives, discussed in Sections 4.3.1 – 4.3.5, respec-
tively.
4.3.1 Multi-Clusters
The groups of author nodes cluster together all those
authors that are connected to the same hubs (i.e.
brands). This provides a visual clustering for those
authors who have tweeted about the same brand. For
example, Figure 3 highlights clusters that group all
the authors who tweeted about 7 distinct brands, in
which ‘ROME’ and ‘NAPLES’ are seem to be mostly
tweeted by authors i.e. they possess ‘high specificity’.
Hence, we can visually interpret the cluster strength,
i.e. ‘Brand Fidelity’.
4.3.2 Multi-Layered Peripheral Spread
The network layout shows that clusters are placed at a
different distance from the visualization centre based
on the number of hubs to which they are connected.
In other words, the most peripheral clusters are those
in which nodes are connected to only one hub, while
the central cluster is the one in which nodes are con-
nected to the highest number of hub nodes. Within
a single cluster, multiple layers seem to be formed.
By implementing the l-shell decomposition method-
ology, the outside layer consists of author nodes who
posted a tweet only once, as we move inward towards
the brand node (hub), the frequency of tweeting in-
creases. Hence, the closest nodes to a hub represent
the authors who tweeted most about that brand.
The power-law layout algorithm has provided a
network layout that is very effective in highlighting a
specific property of authors which was not a measured
AVisualApproachtotheEmpiricalAnalysisofSocialInfluence
323

Table 2: Descriptive statistics on the dimensions of the N
1
and N
2
networks.
Authors N
r
(a)
N
1
N
2
N
t
(a)
Expressed Sentiments
N
t
(a)
Expressed Sentiments
Negative Positive Neutral Negative Positive Neutral
398 92 856 58 203 595 1,913 68 328 1,517
1,662 364 2,905 158 581 2,166 5,959 197 885 4,877
10,710 2,907 12,559 326 1,282 10,951 18,498 387 1,669 16,442
18,711 5,329 21,140 483 1,846 18,811 29,842 566 2,307 26,969
30,310 8,690 33,684 688 2,683 30,313 46,120 805 3,318 41,997
37,626 10,529 41,620 804 3,263 37,553 56,960 937 3,991 52,032
47,295 12,833 52,208 1,027 4,033 47,148 71,667 1,191 4,867 65,609
Key to symbols: N
r
(a): Total No. of authors’ retweets; N
t
(a): Total No. of authors’ tweets (Frequency).
variable in our dataset, i.e. their specificity (or gener-
ality) with respect to a topic (i.e. a brand in Figure
3). Authors belonging to different clusters (i.e. pe-
ripheral) are in fact those who are more generalist in
their content sharing, since they tweet about multiple
different brands. On the contrary, authors belonging
to the innermost clusters are those who are very spe-
cific in sharing content related to just one brand.
Since the specificity (generality) and frequency
and expressed sentiments of authors was not an ex-
plicit measured variable in our dataset, it is possible
to posit that the proposed network layout algorithm
can be considered as a powerful visual data analysis
tool, since it is effective in providing visual represen-
tations of networks that help unveiling specific (im-
plicit) properties of the represented networks. More-
over, Figures 6(cfr. Appendix) provide further visual-
ization of networks N
1
and N
2
of our dataset.
4.3.3 Brand Fidelity
Network N
1
is related to the relationship between
authors and brands, i.e., touristic destinations. In
this case, the clustering of nodes provides a distinct
clustering of those authors who have tweeted about
the same destination. The layering of nodes around
brands is instead related to the intensity of tweet-
ing about a given destination; i.e., authors closer to
a brand node tweet a higher number of times about
that destination with respect to farther authors. The
emerging semantic of the network visualization is in
this case related to the brand fidelity of authors. The
visualized network layout supports the visual analy-
sis of those authors who have a higher fidelity to a
given brand, or those authors who never tweet about
that brand. Moreover, it is possible to point out which
authors are tweeting about a brand as well as a com-
peting brands to support the definition of specific mar-
keting campaigns.
4.3.4 Influencers and Influence Spread
The breadth of the audience was considered the first
and foremost indicator of influence for traditional me-
dia, such as television or radio. However, traditional
media are based on broadcasting rather than commu-
nication, while social media are truly interactive. It is
very common that influencers say something totally
uninteresting and, as a consequence, they obtain lit-
tle or no attention. On the contrary, if social media
users are interested in something, they typically show
it by participating in the conversation with a variety
of mechanisms and, most commonly, by sharing the
content that they have liked. Influencers are promi-
nent social media users, but we cannot expect that the
content that they share is bound to have high influence
(Benevenuto et al., 2010).
The proposed visualization approach gives us a
way to visually explore social networks and to iden-
tify the most influential authors, who tweet most
about different categories and brands. The author’s
specificity N
S
, frequency N
W
and N
R
(i.e. no. of
retweets) can be considered as essential parameters
to visually identify the influencers in social network.
Similarly, our proposed approach produces multi-
layered peripheral and clustered layout, in which we
can observe the spread of influence through the multi-
layered periphery across authors’ nodes. The outlier
authors along the periphery can be potential influence
spreaders, if they connect with other clusters through
retweeting.
4.3.5 Sentiment Analysis
Sentiment analysis refers to the task of extracting pub-
lic sentiment from textual data (Dehkharghani et al.,
2014). Exploiting semantic information, as the polar-
ity of the opinions expressed in users’ comments, can
further improve the understanding of the dynamics of
influence. The literature on sentiment analysis is rich.
More specifically, opinion classification has always
DATA2014-3rdInternationalConferenceonDataManagementTechnologiesandApplications
324
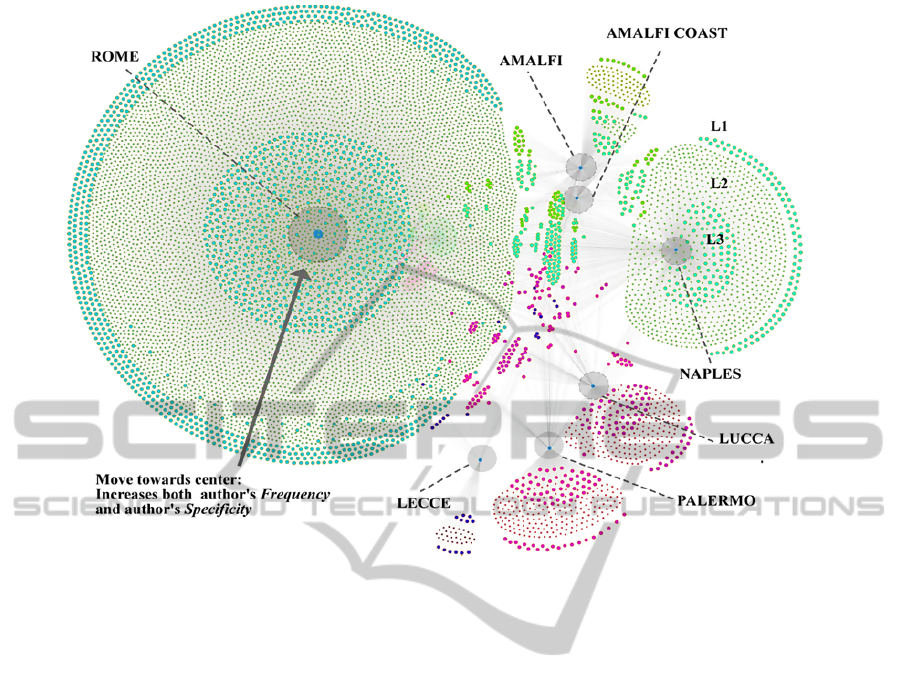
Figure 3: N
1
: Author → Brand (Enlarged View).
been one of the main topics in the academic field of
sentiment analysis (Bigonha et al., 2012; Blitzer et al.,
2007; Godbole et al., 2007; Barbagallo et al., 2012;
Hao et al., 2011).
The visualizations provides us a way to visually
explore the social networks and we are also able to
analyse the sentiments expressed by authors over spe-
cific brand or category. Sentiment can either be pos-
itive, negative or neutral. On our graph canvas, the
edge connecting the author node with the brand or cat-
egory node, represents the expressed sentiment of our
author, whose label can be either positive, negative,
or neutral, as per the author’s opinion expressed in
specific tweet. In this way, we can also perform sen-
timent analysis over a specific brand or category, to
measure an author’s response(s). Sentiment has been
assessed with WISPO, a sentiment analysis tool, pre-
sented in (Barbagallo, 2010; Barbagallo et al., 2012;
Bruni, 2010).
4.4 Empirical Testing and Evaluation
This section dedicated to empirical testing and eval-
uation of our experiment and proposed hypotheses.
Here, we discuss the research model and proposed hy-
potheses with statistical test results.
4.4.1 Definitions
Each graph G (A, T ) has a node set A representing
authors and an edge set T representing tweets. We
define as N
t
(a) the total number of tweets posted by
author a. We define as N
r
(a) total number of times
author a has been retweeted. Tweets can refer to a
brand b or to a category c. We define as N
b
(a) the total
number of brands mentioned by each author a in all
his/her tweets, i.e. brand specificity. Similarly, N
c
(a)
represents the total number of categories mentioned
by each author a in all his/her tweets, i.e. category
specificity.
4.4.2 Research Model and Hypotheses
A post is influential if it raises attention from other
users (Anger and Kittl, 2011). A fundamental goal of
any social media user is to post content that is shared
frequently, by many other users and over extended
periods of time before fading (Asur et al., 2011).
However, the literature does not provide systematic
and visual evidence on how behavioral decisions
regarding content specificity, frequency of sharing
and frequency of retweets exert an impact on influ-
ence. Our claim is that in social media, content plays
a key role in determining the influence of information.
AVisualApproachtotheEmpiricalAnalysisofSocialInfluence
325
AMOS 20 (Arbuckle, 2011) has been used in
this paper to analyse the research model by means
of structural equation modelling (SEM). SEM tech-
niques are second-generation data analysis techniques
(Bagozzi and Fornell, 1982; Chung, 2007) that are
commonly used to test the extent to which IS research
meets recognized standards for high-quality statistical
analysis.
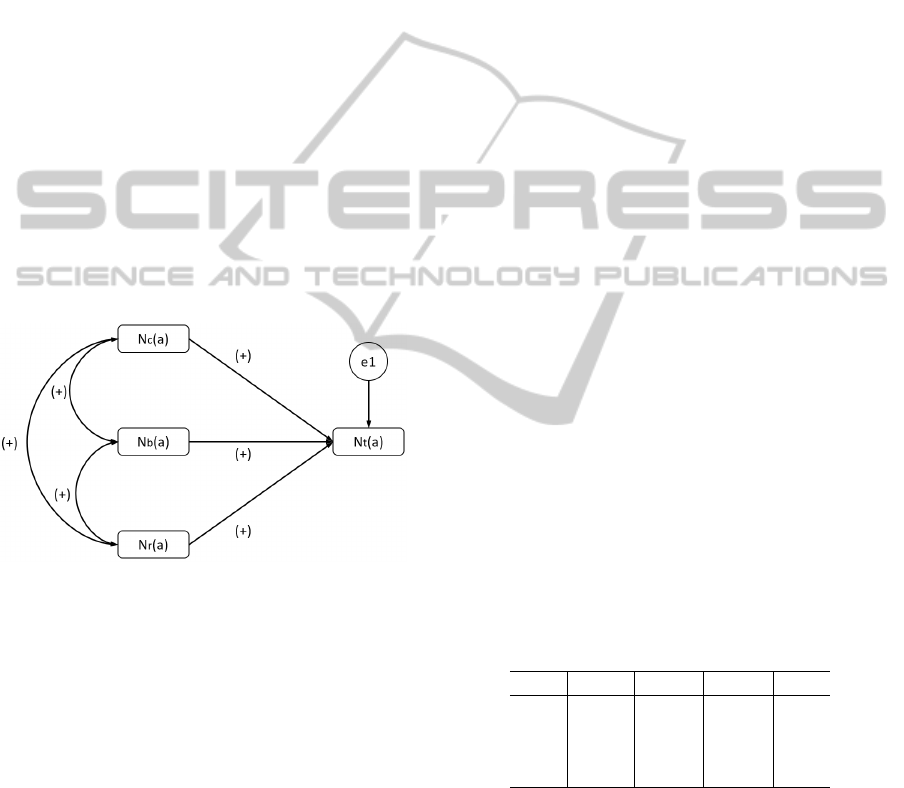
Figure 4 shows our research model. SEM allows
the relationships among variables to be expressed
through hierarchical or non-hierarchical structural
equations (Bullock et al., 1994)). According to
SEM’s graphic format, rectangular boxes represent
observed variables, oval boxes represent latent vari-
ables, arrows represent relations between variables,
and circles represent the Gaussian errors associated
with each dependent variable. For the sake of clarity,
Figure 4 reports for each variable relationship only
its standardized regression coefficient’s sign (note that
signs are consistent between the two data sets N
1
and
N
2
), where N
t
(a) represents a dependent variable as it
is measured with multiple independent variables,i.e.
N
r
(a), N
b
(a), and N
c
(a).
Figure 4: Research Model.
In this section, we put forward few hypotheses
that tie content specificity, frequency of sharing and
frequency of retweets. Hypotheses are tested on two
samples of roughly one million tweets. Later in Sec-
tion 4.4.3, we will statistically verify these proposi-
tions, which can also be visually verified via proposed
visualization approach.
As noted before, social media users wish to be in-
fluential (Anger and Kittl, 2011). In particular, it has
been found that fundamental goal of any social me-
dia user is to post content that is shared frequently,
by many other users and over extended periods of
time before fading (Asur et al., 2011). Following are
the hypothesis that tie content specificity, frequency of
sharing, and frequency of retweets.
• Hypothesis H1: Content specificity is positively
associated with frequency of tweets. As noted
before, social media users wish to be influential
(Anger and Kittl, 2011). In particular, it has been
found that fundamental goal of any social media
user is to post content that is shared frequently,
by many other users and over extended periods of
time before fading (Asur et al., 2011). We call
here N
b
(a), and N
c
(a), to check association with
N
t
(a).
• Hypothesis H2: Frequency of retweets is posi-
tively associated with frequency of tweets. The
literature has studied the role of social media, es-
pecially Twitter, as a source of news (Boyd et al.,
2010; Kwak et al., 2010). In particular, the lit-
erature has discussed the ability of social net-
works to quickly spread information and the rel-
ative volatility of information created and “con-
sumed” by users. (Kwak et al., 2010) show that
most trending topics have an active period of one
week, while half of retweets of a given tweet oc-
curs within one hour and 75% within one day.
Building on previous results, we call here N
r
(a)
to check association with N
t
(a).
4.4.3 Statistical Analysis and Results
All statistical analyses have been performed with
SPSS 20 (Pallant, 2010). Correlation and Regression
analyses have been performed on our data set to ver-
ify the assumption that the metrics associated with the
persistence of the retweeting process represent coher-
ent properties of the same phenomenon. Table 3 re-
ports the correlation matrix of our data variables and
Table 4 reports the estimates of regression weights of
our research model (Figure 4) variables (i.e., N
t
(a):
author’s frequency, N
r
(a): author’s retweets, N
b
(a):
author’s brand specificity, and N
c
(a): author’s cate-
gory specificity ).
Table 3: Correlation matrix of persistence variables (Pear-
son Index).
N
t
(a) N
r
(a) N
b
(a) N
c
(a)
N
t
(a) 1 .286 .779 .528
N
r
(a) .286 1 .227 .219
N
b
(a) .779 .227 1 .397
N
c
(a) .528 .219 .397 1
From Table 3 follows that correlation is significant
at 0.01 level (2-tailed). All persistence variables are
positively correlated with each other, and thus have
a significant impact upon each other. This yields to
the notion that specificity, frequency, and retweets are
significant parameters to measure author influence.
The regression estimation results of the research
model as shown in Figure 4 are shown in Table 4. All
relationships between persistence metrics (i.e. N
r
(a),
N
b
(a) and N
c
(a)) and the persistence latent variable
DATA2014-3rdInternationalConferenceonDataManagementTechnologiesandApplications
326
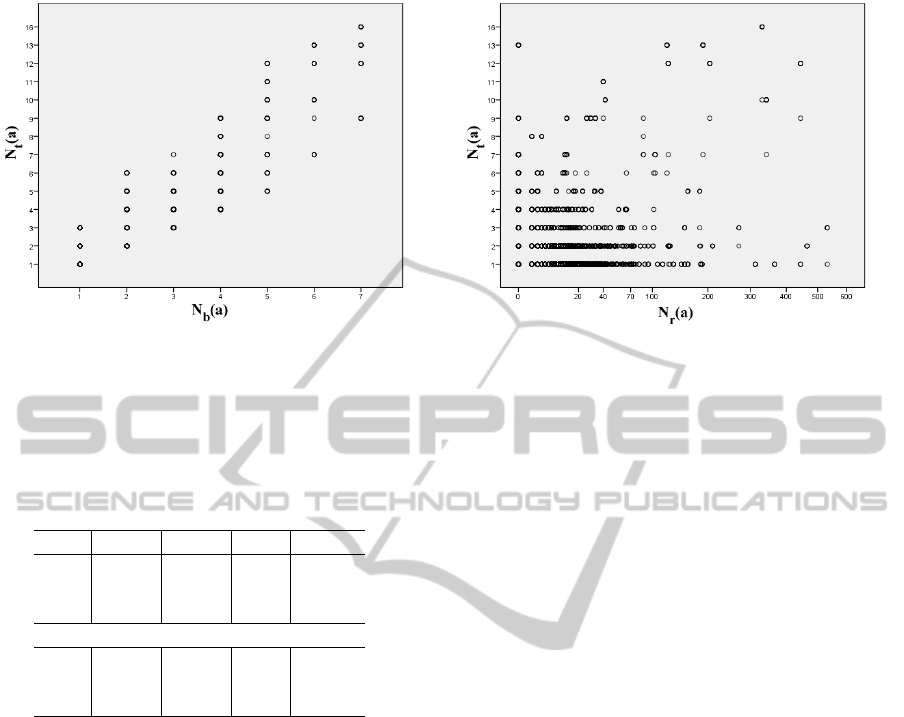
(a) (b)
Figure 5: Scatter Plots between a) Brand Specificity and Frequency b) Retweets and Frequency.
(i.e. N
t
(a)) are significant, with p < 0.001. Moreover,
Figure 5 shows the example scatter plots of dependent
and independent variables in our research model.
Table 4: Estimates of regression weights for the research
model.
V
D
V
I
R
W
S.E p-value
N
c
(a) N
t
(a) 0.248 .001 < 0.001
N
b
(a) N
t
(a) 0.662 .003 < 0.001
N
r
(a) N
t
(a) 0.082 .000 < 0.001
Covariances
N
b
(a) N
c
(a) 0.103 .001 < 0.001
N
r
(a) N
b
(a) 0.533 .006 < 0.001
N
r
(a) N
c
(a) 2.217 .026 < 0.001
V
D
= Dependent Variables
V
I
= Independent Variable
Hypothesis H1: (Content specificity is positively as-
sociated with frequency of tweets.) As N
t
(a) is pos-
itively correlated with both N
b
(a) and N
c
(a), which
yields to the notion that authors with high frequency
seems to have high specificity and vice versa, i.e. au-
thors belonging to different clusters are in fact those
who are more generalist in their content sharing, since
they tweet about multiple different topics (brands or
categories) with high specificity. On the contrary, au-
thors belonging to the innermost clusters with low fre-
quency value are those who are very specific in shar-
ing content related to one selected brand i.e. low
specificity value.
Hypothesis H2: (Frequency of retweets is posi-
tively associated with frequency of tweets). As N
t
(a)
and N
r
(a) are also positively correlated, which yields
to the notion that, authors with high frequency seems
to have high retweets and vice versa. Although the
correlation coefficient is not high, the p-value in Ta-
ble 4 showing significance and seems to support a
positive (though weak) correlation between N
t
(a) and
N
r
(a). Thus, generalist authors in peripheral nodes
or belonging to different clusters have a greater prob-
ability of being retweeted. On the contrary, authors
belonging to the innermost clusters have lower prob-
ability of being retweeted.
From Table 2, it’s also evident that as the graph
size grows, N
r
(a) increases with increase of N
t
(a),
thus increase in probability of potential influencers
by intensity of retweeting. Moreover, if N
t
(a) in-
creases,authors seems to tweet about more topic,
which increases their specificity, either N
b
(a) or
N
c
(a).
Similarly, as the graph sizes increases, more
peripheral layers seems to be formed surrounding
around hub node, which increases the influence
spread across newly formed peripheral layers in
multi-layered form, and thus outlier authors along pe-
riphery can be potential influence spreaders. We can
visually identify the increase in influence spread, as
shown in Figure 6(a), which is larger graph of N
1
type network, as compare to Figure 3, where the ad-
dition of more multi-layered peripheral nodes around
hub-node (i.e. brand) increase the influence spread
across those peripheral layers. Thus, the influence
seems to spread across multi-layered periphery of au-
thors’ nodes. The outlier authors along the periphery
can be potential influence spreaders, if they connect
with other clusters through retweeting and, thus, play
a critical role in determining influence of content.
5 CONCLUSION AND FUTURE
WORK
This paper proposes a novel visual aspect for the
analysis and exploration of social networks in or-
AVisualApproachtotheEmpiricalAnalysisofSocialInfluence
327

der to identify and visually highlight influencers (i.e.,
hub nodes), and influence (i.e., spread of multi-layer
peripheral nodes), represented by the opinions ex-
pressed by social media users on a given set of topics.
Results show that our approach produces aesthetically
pleasant graph layouts, by highlighting multi-layered
clusters of nodes surrounding hub nodes (the main
topics). These multi-layered peripheral node clusters
represent a visual aid to understand influence.
Our approach exploits the underlying concept of
power-law degree distribution with the metaphor of
k-shell decomposition, thus we able to visualize so-
cial networks in multi-layered, clustered peripheries
around hub-nodes, which not only preserves the graph
drawing aesthetic criteria, but also effectively rep-
resent multi-layered peripheral clusters around hub
nodes. We analysed multi-clusters, spread of multi-
layered peripheries, brand fidelity, content specificity,
and sentiment analysis through our proposed visual
framework.
Empirical testing and evaluation results show that
specificity, frequency, and retweets are mutually cor-
related, and have a significant impact on an author’s
influence and encourage us to further explore so-
cial network’s intrinsic characteristics. Although our
experiment can be repeated with data from entities
different from tourism, additional empirical work is
needed to extend testing to multiple datasets and do-
mains.
Future work will consider measures of influence
with additional parameters besides frequency of shar-
ing, content specificity and frequency of retweets. In
our current work, we are studying an achievable mea-
sure of influence through proposed visualization ap-
proach, that can be used to rank influential nodes in
social networks (Metra, 2014).
REFERENCES
Abello, J. and Queyroi, F. (2013). Fixed points of graph
peeling. In Proceedings of the 2013 IEEE/ACM Inter-
national Conference on Advances in Social Networks
Analysis and Mining, pages 256–263. ACM.
Alvarez-Hamelin, J. I., Dall’Asta, L., Barrat, A., and
Vespignani, A. (2006). Large scale networks finger-
printing and visualization using the k-core decompo-
sition. Advances in neural information processing sys-
tems, 18:41.
Andersen, R., Chung, F., and Lu, L. (2004). Drawing power
law graphs using local/global decomposition. Twelfth
Annual Symposium on Graph Drawing.
Andersen, R., Chung, F., and Lu, L. (2007). Drawing power
law graphs using a local global decomposition. Algo-
rithmica, 47(4):397.
Anger, I. and Kittl, C. (2011). Measuring influence on twit-
ter. In Proceedings of the 11th International Con-
ference on Knowledge Management and Knowledge
Technologies, page 31. ACM.
Anholt, S. (2006). Competitive identity: The new brand
management for nations, cities and regions. Palgrave
Macmillan.
Arbuckle, J. L. (2011). Ibm spss amos 20 users guide. Amos
Development Corporation, SPSS Inc.
Asur, S., Huberman, B. A., Szabo, G., and Wang, C. (2011).
Trends in social media: Persistence and decay. In
ICWSM.
Bagozzi, R. P. and Fornell, C. (1982). Theoretical concepts,
measurements, and meaning. A second generation of
multivariate analysis, 2(2):5–23.
Bakshy, E., Hofman, J. M., Mason, W. A., and Watts, D. J.
(2011). Everyone’s an influencer: quantifying influ-
ence on twitter. In Proceedings of the fourth ACM
international conference on Web search and data min-
ing, pages 65–74. ACM.
Barbagallo, D. (2010). A data quality based methodology to
improve sentiment analyses. PhD thesis, Politecnico
di Milano, Milan, Italy.
Barbagallo, D., Bruni, L., Francalanci, C., and Giacomazzi,
P. (2012). An empirical study on the relationship be-
tween twitter sentiment and influence in the tourism
domain. In Information and Communication Tech-
nologies in Tourism 2012, pages 506–516. Springer.
Benevenuto, F., Cha, M., Gummadi, K., and Haddadi, H.
(2010). Measuring user influence in twitter: The mil-
lion follower fallacy. In International AAAI Confer-
ence on Weblogs and Social (ICWSM10), pages pp.
10–17.
Bigonha, C., Cardoso, T. N., Moro, M. M., Gonc¸alves,
M. A., and Almeida, V. A. (2012). Sentiment-based
influence detection on twitter. Journal of the Brazil-
ian Computer Society, 18(3):169–183.
Blitzer, J., Dredze, M., and Pereira, F. (2007). Biographies,
bollywood, boom-boxes and blenders: Domain adap-
tation for sentiment classification. In ACL, volume 7,
pages 440–447.
Boutin, F., Thievre, J., and Hascoet, M. (2006). Focus-
based filtering + clustering technique for power-law
networks with small world phenomenon. SPIE-IS & T
Electronic Imaging, 6060.
Boyd, D., Golde, S., and Lotan, G. (2010). Tweet, tweet,
retweet: Conversational aspects of retweeting on twit-
ter. IEEE, pages pp. 1–10.
Bruni, L. (2010). A methodology framework to understand
and leverage the impact of content on social media
influence. PhD thesis, Politecnico di Milano, Milan,
Italy.
Bruni, L., Francalanci, C., Giacomazzi, P., Merlo, F., and
Poli, A. (2013). The relationship among volumes,
specificity, and influence of social media information.
In Proceedings of International Conference on Infor-
mation Systems.
Bullock, H. E., Harlow, L. L., and Mulaik, S. A. (1994).
Causation issues in structural equation modeling re-
DATA2014-3rdInternationalConferenceonDataManagementTechnologiesandApplications
328

search. Structural Equation Modeling: A Multidisci-
plinary Journal, 1(3):253–267.
Carmi, S., Havlin, S., Kirkpatrick, S., Shavitt, Y., and Shir,
E. (2007). A model of internet topology using k-shell
decomposition. Proceedings of the National Academy
of Sciences, 104(27):11150–11154.
Chan, D., Chua, K., Leckie, C., and Parhar, A. (2004). Vi-
sualisation of power-law network topologies. In Net-
works, 2003. ICON2003. The 11th IEEE International
Conference on, pages 69–74. IEEE.
Chung, B. (2007). An analysis of success and failure fac-
tors for ERP systems in engineering and construction
firms. ProQuest.
Dehkharghani, R., Mercan, H., Javeed, A., and Saygin, Y.
(2014). Sentimental causal rule discovery from twit-
ter. Expert Systems with Applications, 41(10):4950–
4958.
Freeman, L. C. (1979). Centrality in social networks con-
ceptual clarification. Social networks, 1(3):215–239.
Fruchterman, T. and Reingold, E. (1991). Graph drawing
by force-directed placement. Software: Practice and
Experience, 21(11):1129–1164.
Godbole, N., Srinivasaiah, M., and Skiena, S. (2007).
Large-scale sentiment analysis for news and blogs.
ICWSM, 7.
Hao, M., Rohrdantz, C., Janetzko, H., Dayal, U., Keim,
D. A., Haug, L., and Hsu, M.-C. (2011). Visual senti-
ment analysis on twitter data streams. In Visual An-
alytics Science and Technology (VAST), 2011 IEEE
Conference on, pages 277–278. IEEE.
Hossain, L., Wu, A., and Chung, K. K. (2006). Actor
centrality correlates to project based coordination. In
Proceedings of the 2006 20th anniversary conference
on Computer supported cooperative work, pages 363–
372. ACM.
Hussain, A., Latif, K., Rextin, A., Hayat, A., and Alam, M.
(2014). Scalable Visualization of Semantic Nets using
Power-Law Graphs. Applied Mathematics & Informa-
tion Sciences, 8(1):355–367.
Kitsak, M., Gallos, L. K., Havlin, S., Liljeros, F., Muchnik,
L., Stanley, H. E., and Makse, H. A. (2010). Identi-
fication of influential spreaders in complex networks.
Nature Physics, 6(11):888–893.
Klotz, C., Ross, A., Clark, E., and Martell, C. (2014).
Tweet!–and i can tell how many followers you have.
In Recent Advances in Information and Communica-
tion Technology, pages 245–253. Springer.
Koch, R. (1999). The 80 /20 principle: the secret to achiev-
ing more with less. Crown Business.
Kwak, H., Lee, C., Park, H., and Moon, S. (2010). What
is twitter, a social network or a news media? In
Proceedings of the 19th international conference on
World wide web, pages 591–600. ACM.
Metra, I. (2014). Influence based exploration of twitter so-
cial network. PhD thesis, Politecnico di Milano, Mi-
lan, Italy.
Naaman, M., Boase, J., and Lai, C.-H. (2010). Is it re-
ally about me?: message content in social awareness
streams. In Proceedings of the 2010 ACM conference
on Computer supported cooperative work, pages 189–
192. ACM.
Newman, M. E. (2005). Power laws, pareto distributions
and zipf’s law. Contemporary physics, 46(5):323–
351.
Pallant, J. (2010). SPSS survival manual: A step by step
guide to data analysis using SPSS. McGraw-Hill In-
ternational.
Perline, R. (2005). Strong, weak and false inverse power
laws. Statistical Science, pages 68–88.
Renoust, B., Melanc¸on, G., and Viaud, M.-L. (2013). As-
sessing group cohesion in homophily networks. In
Proceedings of the 2013 IEEE/ACM International
Conference on Advances in Social Networks Analysis
and Mining, pages 149–155. ACM.
Sparrowe, R. T., Liden, R. C., Wayne, S. J., and Kraimer,
M. L. (2001). Social networks and the performance
of individuals and groups. Academy of management
journal, 44(2):316–325.
Suh, B., Hong, L., Pirolli, P., and Chi, E. H. (2010). Want
to be retweeted? large scale analytics on factors im-
pacting retweet in twitter network. In Social comput-
ing (socialcom), 2010 ieee second international con-
ference on, pages 177–184. IEEE.
Xu, X., Yuruk, N., Feng, Z., and Schweiger, T. (2007).
Scan: a structural clustering algorithm for networks.
In Proceedings of the 13th ACM SIGKDD interna-
tional conference on Knowledge discovery and data
mining, pages 824–833. ACM.
APPENDIX
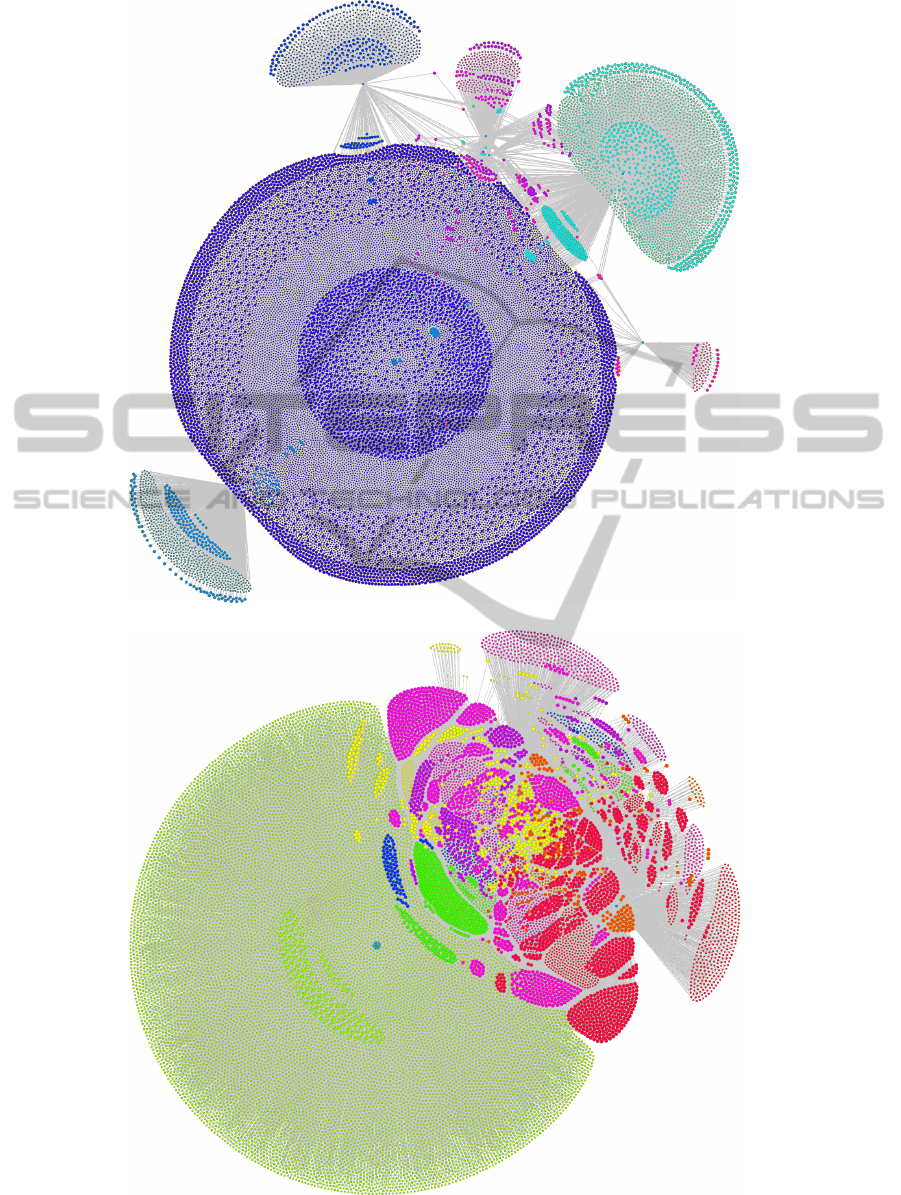
Figure 6 provide further visualization of networks N
1
and N
2
of our dataset. An enlarged and zoomable ver-
sion of the network layouts can be accessed online at
the following URL: http://goo.gl/4uj66k.
AVisualApproachtotheEmpiricalAnalysisofSocialInfluence
329
(a)
(b)
Figure 6: Network visualizations of networks a) N
1
(Author → Brand) b) N
2
(Author → Category).
DATA2014-3rdInternationalConferenceonDataManagementTechnologiesandApplications
330
