
Traffic Flow Simulation Dovetailed with Evolutionary Game Theory
Jun Tanimoto, Shinji Kukida, Aya Hagishima and Naoki Ikegaya
Interdisciplinary Graduate School of Engineering Sciences, Kyushu University, 6-1 Kasuga-koen,
Kasuga-shi, 816-8580, Japan
Keywords: Cellular Automaton, Traffic Flow, Lane Change, Dilemma Game, N-Person Prisoner’s Dilemma.
Abstract: Previous work (Yamauchi et al., PRE 79 and Nakata et al., Physica A 389) found several social-dilemma
structures in phases of traffic flows created by bottlenecks resulting from lane closings. We investigate
another question: whether or not such structures can be formed from frequent lane changes in a usual traffic
flow without any explicit bottlenecks. In our model system, two classes of driver-agents coexist: C-agents
(cooperative strategy) always remain in the lane they are initially assigned, while D-agents (defective
strategy) try to change lanes to move ahead. In relatively high-density flows, such as the metastable and
high-density phases, we found structures that correspond to either n-person Prisoner’s Dilemma (n-PD)
games or to quasi-PD games. In these situations, lane changes by D-agents create heavy traffic jams that
reduce social efficiency.
1 INTRODUCTION
In growing social concerns on traffic problems, there
have been lots of previous studies dealing with the
so-called traffic model (e.g. Kerner, 2009).
Especially, it has struck many statistical physicists
as interesting, just because a traffic flow can be
interrupted as a self-driven multi-particles system. In
that particular sense, among several traffic models
such as the kinetic gas theory, fluid dynamical
model, car-following model, cellular automaton
(CA) model has been most heavily concerned.
However, none of these previous studies provided a
comprehensive understanding on real traffic flow
phenomena because these models did not include the
decision-making process of the drivers. If we
recognize that the traffic flow results from
competition for a finite resource (“road”) among
many drivers who are seeking shorter driving times
and more comfortable driving, it is natural to ask
whether or not a social dilemma originates from the
intentions of drivers. If so, we question the class of
dilemma, such as the Prisoner’s Dilemma (PD)
game, Chicken (Snow Drift) game, or something
additional, lies hidden beneath the observed traffic
flow and performs the game change when the flow
changes from one kind of phase to another. With this
background, we detected that several social dilemma
structures, represented by n-person Prisoner’s
Dilemma (n-PD) games, appear in certain traffic
flow phases at a bottleneck caused by a lane closing
(Yamauchi et al., 2009; Nakata et al., 2010). We
confirmed that an n-PD game structure appears in
the high-density phase area, but no social dilemma
exists in the free-flow and jam phases. It seems
plausible for a social dilemma to underlie such
traffic flows because closing a lane creates an
obvious bottleneck. Thus, our next challenge is
whether a social dilemma still lies beneath traffic
flow that does not involve any explicit bottleneck
like a lane closing, on-ramp (merging), off-ramp
(exit), or uphill travel. This paper addresses whether
or not only lane-changing actions by drivers can
give rise to a social dilemma in an ordinal two-lane
road system with cyclic boundaries.
2 MODEL SETUP
We applied the Revised S-NFS model (Kokubo,
2011) for driving vehicles forward. Revised S-NFS
model takes into account motions that are commonly
observed in real vehicles: slow-to-start (S2S), quick
start (QS), and random braking (RB). S2S implies an
inertial effect, which is important for producing
metastable states in fundamental diagrams, also
improve reproducibility of the so-called three-phase
theory by Kerner (2009).
517
Tanimoto J., Kukida S., Hagishima A. and Ikegaya N..
Traffic Flow Simulation Dovetailed with Evolutionary Game Theory.
DOI: 10.5220/0004986505170522
In Proceedings of the 4th International Conference on Simulation and Modeling Methodologies, Technologies and Applications (SIMULTECH-2014),
pages 517-522
ISBN: 978-989-758-038-3
Copyright
c
2014 SCITEPRESS (Science and Technology Publications, Lda.)
We applied the lane-changing rule used by
Kukida et al. (2009) in the CA model.
Concerning Revised S-NFS model and Kukida’s
lane change model, we assumed a set of model
parameters to reproduce realistic traffic flow. Also
we set the system length to L = 500.
In the system there are two types of agents:
cooperators (C-agents) remain in the lane initially
assigned without making any lane changes, and
defectors (D-agents) change lanes. We denote
fraction of cooperators among all agents by P
c
. We
use cyclic boundary conditions to keep the vehicle
density constant during a single simulation episode.
3 RESULT AND DISCUSSION
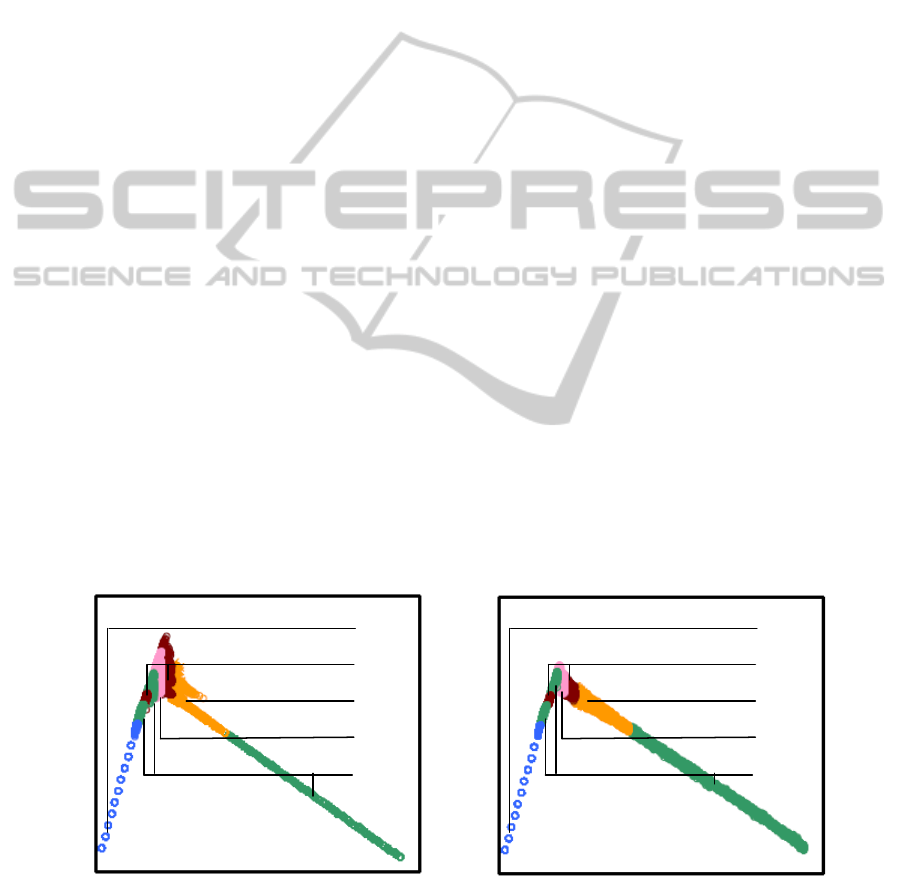
Figure 1 shows fundamental diagrams for (a) Pc = 1
and (b) Pc = 0 in which each dilemma class
discussed below is identified by a different color.
Figure 1(a) shows that flows of all cooperators can
exhibit the so-called metastable phase, while Figure
1(b) shows that no metastable phase occurs in flows
of all defectors. This seems plausible because a flow
in relatively high-density regions can be stable with
high traffic flux so long as none of the vehicles
change lanes. In contrast, a flow with lane changes
becomes volatile, since turbulence caused by
frequent lane changes promotes traffic jams.
Behaviors of the observed dilemma classes are
explicitly discussed below; here, we merely note that
only the Prisoner’s Dilemma (including quasi-PD
and quasi-little PD) class appears in the middle
density region with relatively high traffic fluxes. The
Trivial game and Neutral game also appear there,
but these are not categories of social dilemmas.
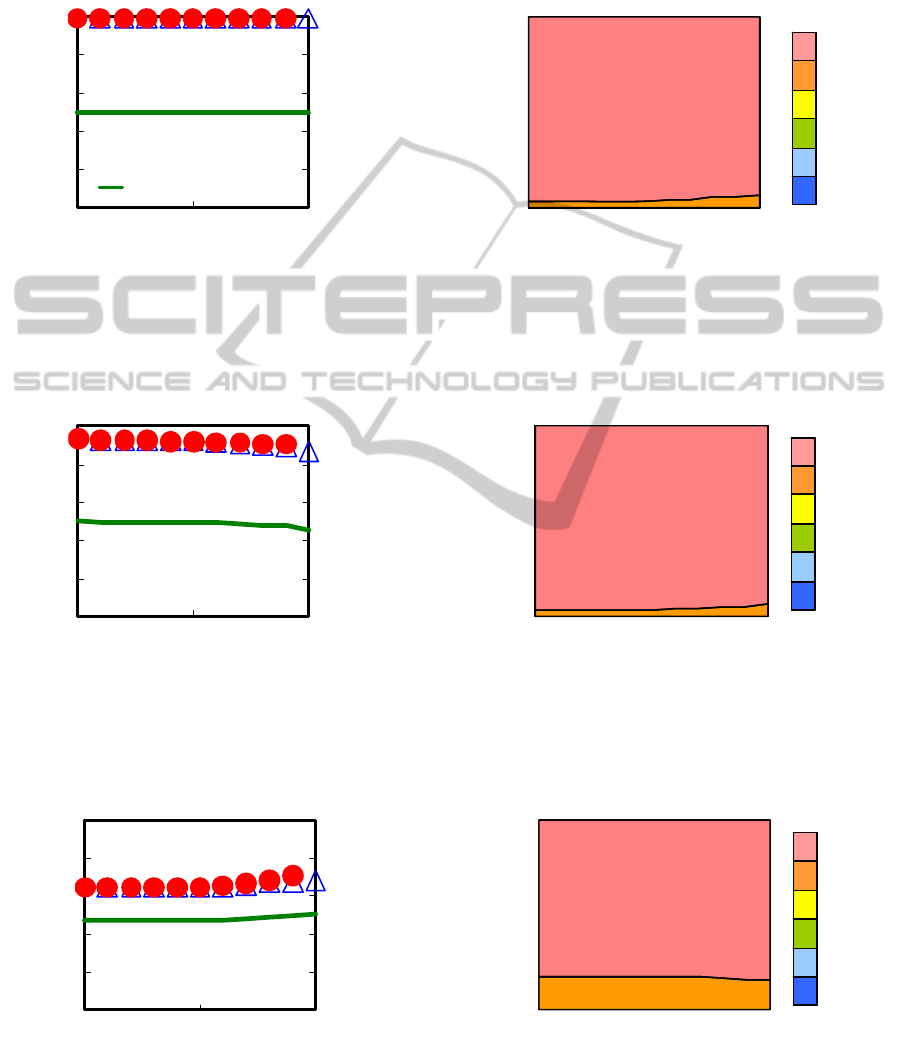
Figure 2 shows the payoff functions and velocity
frequencies for Case A in Figure 1(a) (
1.0
),
which is in the free-flow phase. Panel 2(a) shows
that all payoffs for Case A are insensitive to the
cooperation fraction; this implies a kind of gameless
situation. So we denote this as a Neutral game class.
This is not surprising because most of the vehicles in
Case A run at maximum velocity (see Panel 2(b)), so
lane changes in the system are rare.
Figures 3 to 9 show counterparts of Figure 2 for
the other cases explicitly marked in Figure 1(a). The
situation in Figure 3 (
141.0
) can be called a
Trivial game because Nash equilibrium (NE)
accords with the Equal Pareto Optimum (EPO) at P
c
= 0. This game is dominated by defection, since the
defector’s payoff is always larger than that of the
cooperator. However, the maximum social payoff
also appears at all defector states. In a nutshell, we
call this a D-dominate Trivial game, which implies
that more frequent lane changing is preferable in this
density region from both social and individual points
of view.
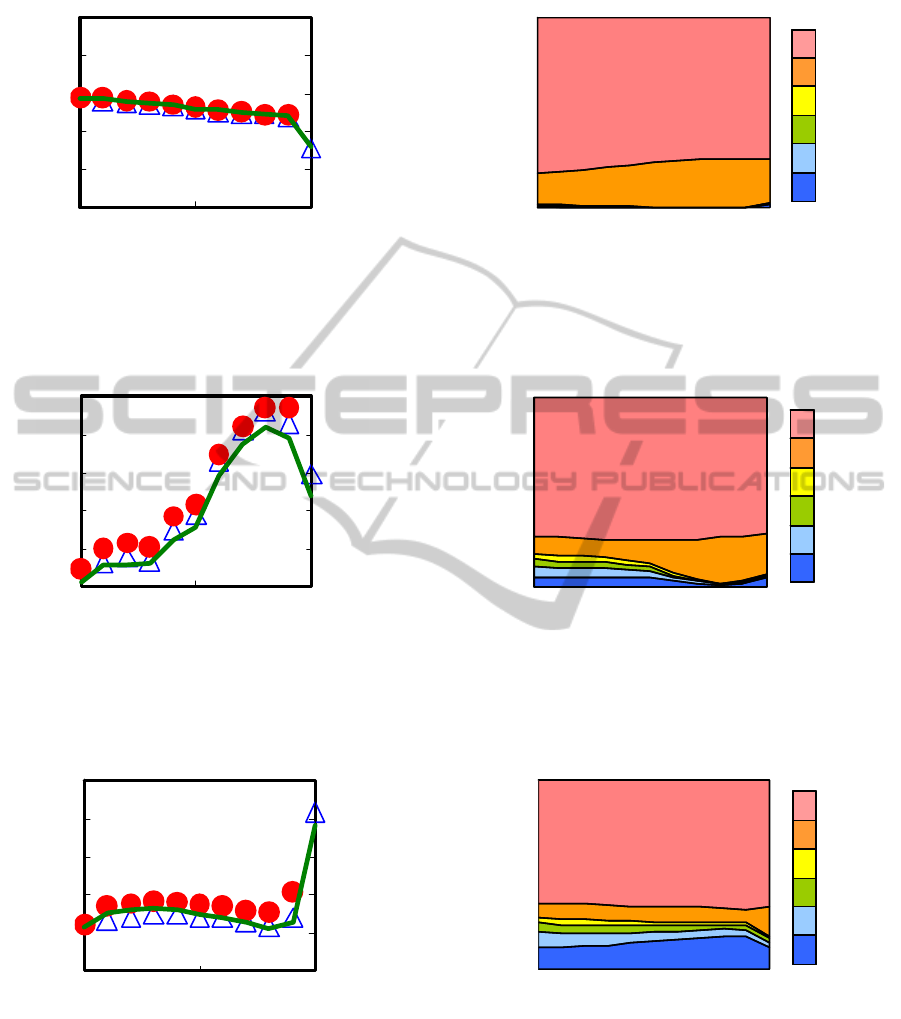
Figures 5 (
179.0
) and 9 (
6.0
) show the
same tendencies as in Figure 3. Thus, all these
should be classified as D-dominate Trivial games.
The fact that the jam phase belongs to the D-
dominate Trivial game (Fig. 9) seems reasonable
because lane changes into even a slightly small
vacant space between jamming vehicles brings
(b) P
c
=0
0
1.2
0
Normalized density
(a) P
c
=1
1
1
Normalized Flux
(A)
(B)
(E)
(C)
0.8
0.4
0.5 0.5
(D)
(A)
(B)
(E)
(C)
(D)
Figure 1: Fundamental diagrams (normalized flux vs normalized density) for situations with (a) all cooperators (P
c
= 1)
and (b) all defectors (P
c
=0). Colored symbols identify (A) Neutral game, (B) Prisoner’s Dilemma game at two densities
in Panels (a) and (b), (C) D-dominate Trivial game at three densities in Panels (a) and (b), (D) D-dominate quasi-PD
game, and (E) D-dominate quasi-light-PD game .
SIMULTECH2014-4thInternationalConferenceonSimulationandModelingMethodologies,Technologiesand
Applications
518

benefits for not only the focal vehicle who changes
lanes but also for the society as a whole, even if its
frequency is low.
Figure 4 (
155.0
) suggests a weak Prisoner’s
Dilemma (PD). This is confirmed by the following
facts. At P
c
= 0, NE is trapped because the defector’s
payoff is always greater than that of the cooperator.
EPO appears at P
c
= 1 because the social payoff
increases with increasing cooperation fraction,
although the effect is subtle. The same tendency
appears in Figure 7 (
211.0
), although the extent
of this dilemma seems more severe than that in
Figure 4. In Figure 7, the social payoff function does
not monotonically increase with the increase in the
cooperation fraction, as observed in Figure 4; rather,
it shows an N-character shape, in which a local peak
(much smaller than EPO at P
c
= 1) appears at a
lower cooperation fraction. This point is carefully
discussed in Sec. 3.2.
Figure 6 (
194.0
) differs slightly from the
simple PD because EPO is not observed at P
c
= 1,
although NE is trapped at P
c
= 0. At any rate, EPO is
largely inconsistent with NE since EPO, which is the
peak of social payoff, appears above P
c
= 0.5.
Therefore, we call this game structure a D-dominate
quasi-Prisoner’s Dilemma game.
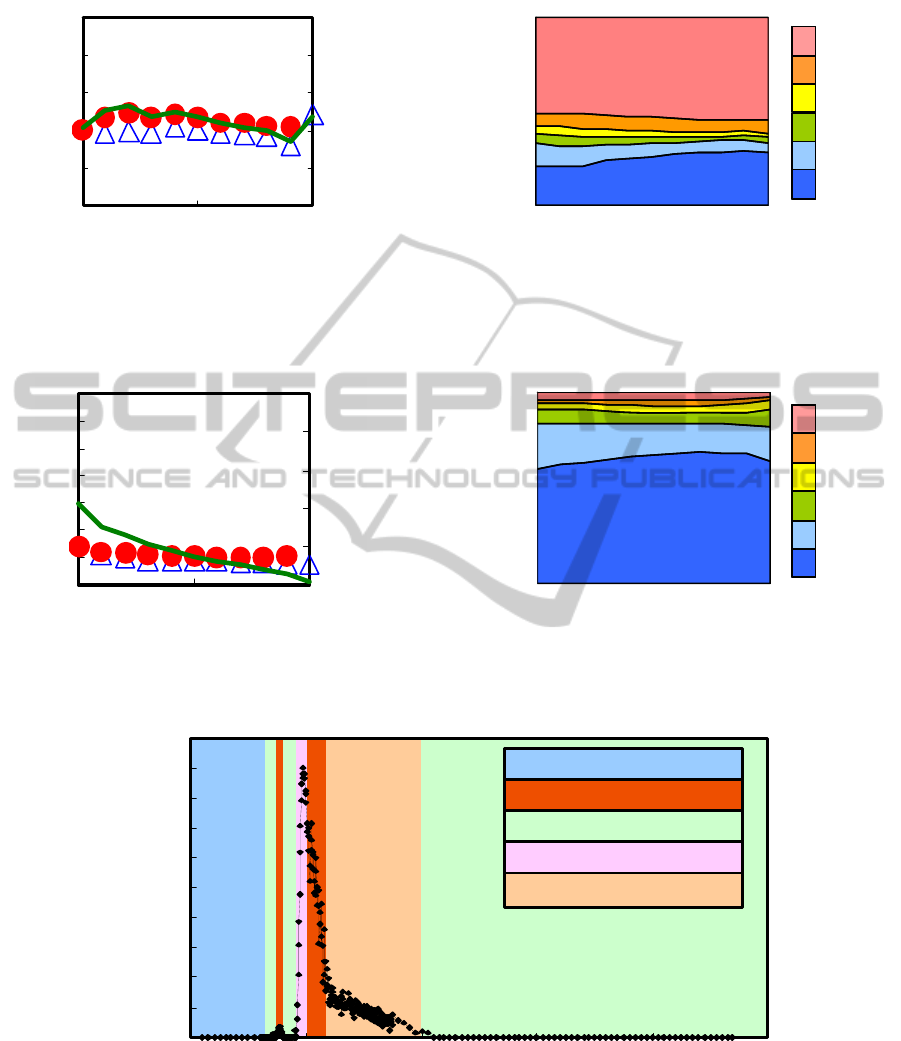
Figure 8 (
244.0
) seems odd; it looks
analogous to a D-dominate quasi-PD Game (Fig. 6),
but it differs. EPO defined by the peak of social
payoff appears below P
c
= 0.5 and is relatively close
to NE found at P
c
= 0. Therefore, we call this a D-
dominate quasi-light PD game.
Figure 10 shows the effects of vehicle density on the
strength of dilemma,
, defined by Nakata et al.
(2011). Figure 10 shows that the density at severe
dilemma strength is consistent with the density
observed in the high-flux region, including the
metastable phase (Fig.1 (a)). This seems physically
plausible because, in this density region, a driver has
a strong incentive for changing lanes to exploit other
drivers and ensure his own benefit is maximized
(smaller travel time). However, when one driver
changes lanes, others might follow. Therefore, states
with high flux, say in the metastable phase, collapse
with the phase shifting to the jam phase.
4 CONCLUSIONS
For ordinal traffic flows, we have successfully
demonstrated that there are hidden social-dilemma
structures evoked by drivers’ decisions whether or
not they should change lanes. This was confirmed by
a series of numerical simulations using the revised
S-NFS cellular automaton model combined with a
lane-changing model that we developed and applied
with cyclic boundary conditions.
Interestingly, social dilemmas, as classified by
the Prisoner’s Dilemma game or its variants, were
only observed in situations of middle vehicle
density; these situations correspond to the region on
the fundamental diagram, including the metastable
phase, in which data are scattered. This seems
plausible because, when a driver is surrounded by
other vehicles, that driver has a serious incentive to
change lanes. However, if all drivers make the same
decision, social efficiency declines phenomenally
and huge traffic jams emerge. We also evaluated the
relation between dilemma strength and density of
vehicles.
ACKNOWLEDGEMENTS
This study was partially supported by a Grant-in-Aid
for Scientific Research by JSPS, awarded to Prof.
Tanimoto (#25560165), Pfizer Health Research
Foundation. We would like to express our gratitude
to these funding sources.
REFERENCES
Kerner, B. S, 2009; Introduction to Modern Traffic Flow
Theory and Control: The Long Road to Three-Phase
Traffic Theory, Springer.
Kokubo. S., Tanimoto. J., Hagishima. A., 2011; A new
Cellular Automata Model including a decelerating
damping effect to reproduce Kerner's three-phase
theory, Physica A 390(4), 561–568.
Kukida. S.; Tanimoto. J.; Hagishima. A., 2011; Analysis
of the influence of lane changing on traffic-flow
dynamics based on the cellular automaton model,
International Journal of Modern Physics C 22(3), 1–11.
Nakata, M., Yamauchi, A., Tanimoto, J., Hagishima, A.,
2010; Dilemma game structure hidden in traffic flow
at a bottleneck due to a 2 into 1 lane junction, Physica
A 389, 5353–5361.
Yamauchi, A., Tanimoto, J., Hagishima, A., Sagara, H.,
2009; Dilemma game structure observed in traffic
flow at a 2-to-1 lane junction, Physical Review E 79,
036104.
TrafficFlowSimulationDovetailedwithEvolutionaryGameTheory
519
APPENDIX
4.5
4.6
4.7
4.8
4.9
5
00.51
0.45
0.47
0.49
0.51
0.53
0.55
P
C
Normalized Velocit
y
Normalized flux
Velocity frequency
P
C
0.5 0 1
(a) Payoff functions (b) Velocity frequency
V=5
V=4
V=2
V=3
V=1
V=0
V=5
V=4
V=2
V=3
V=1
V=0
C-agent’s velocity
D-agent’s velocity
Flux
△
●
1
0
Figure 2: Results for
1.0
at point A in Figure 1(a). (a) Effect of fraction of cooperators (P
c
) on payoff functions
(velocity and flux). Red closed circles are average payoffs of defectors, and blue triangle are average payoffs of
cooperators. Green bold line indicates traffic flux as a social payoff. (b) Effect of fraction of cooperators (P
c
) on velocity
frequency. This behavior corresponds to a Neutral game.
4.5
4.6
4.7
4.8
4.9
5
00.51
0.65
0.67
0.69
0.71
0.73
0.75
P
C
Normalized Velocity
Normalized flux
P
C
0.5 0 1
V=5
V=4
V=2
V=3
V=1
V=0
V=5
V=4
V=2
V=3
V=1
V=0
0.141
0
Velocity frequency
Figure 3: Same as in Figure 2, except at
141.0
, which corresponds to one of the three points C in Figure 1(a). This
behavior corresponds to a D-dominate Trivial game.
4.5
4.6
4.7
4.8
4.9
5
00.51
0.7
0.72
0.74
0.76
0.78
0.8
P
C
Normalized Velocity
Normalized flux
Velocity frequency
P
C
0.5 0 1
(a) Payoff functions (b) Velocity frequency
V=5
V=4
V=2
V=3
V=1
V=0
V=5
V=4
V=2
V=3
V=1
V=0
0.155
0
Figure 4: Same as in Figure 2, except at
155.0
, which corresponds to one of the two points B in Figure 1(a). This
behavior corresponds to a weak Prisoner’s Dilemma game.
SIMULTECH2014-4thInternationalConferenceonSimulationandModelingMethodologies,Technologiesand
Applications
520
4.5
4.6
4.7
4.8
4.9
5
00.51
0.8
0.82
0.84
0.86
0.88
0.9
P
C
Normalized Velocit
y
Normalized flux
Velocity frequency
P
C
0.5 0 1
(a) Payoff functions (b) Velocity frequency
V=5
V=4
V=2
V=3
V=1
V=0
V=5
V=4
V=2
V=3
V=1
V=0
0.179
0
Figure 5: Same as in Figure 2, except at
179.0
, which corresponds to one of the three points C in Figure 1(a). This
behavior corresponds to a D-dominate Trivial game.
4.2
4.3
4.4
4.5
4.6
4.7
00.51
0.82
0.84
0.86
0.88
0.9
0.92
P
C
Normalized Velocit
y
Normalized flux
Velocity frequency
P
C
0.5 0 1
(a) Payoff functions (b) Velocity frequency
V=5
V=4
V=2
V=3
V=1
V=0
V=5
V=4
V=2
V=3
V=1
V=0
0.194
0
Figure 6: Same as in Figure 2, except at
194.0
, which corresponds to point D in Figure 1(a). This behavior
corresponds to a D-dominate quasi-Prisoner’s Dilemma game.
3.7
3.8
3.9
4
4.1
4.2
00.51
0.78
0.8
0.82
0.84
0.86
0.88
P
C
Normalized Velocity
Normalized flux
Velocity frequency
P
C
0.5 0 1
(a) Payoff functions (b) Velocity frequency
V=5
V=4
V=2
V=3
V=1
V=0
V=5
V=4
V=2
V=3
V=1
V=0
0.211
0
Figure 7: Same as in Figure 2, except at
211.0
, which corresponds to one of the two points B in Figure 1(a). This
behavior corresponds to a weak Prisoner’s Dilemma game.
TrafficFlowSimulationDovetailedwithEvolutionaryGameTheory
521
3
3.1
3.2
3.3
3.4
3.5
00.51
0.73
0.75
0.77
0.79
0.81
0.83
P
C
Normalized Velocity
Normalized flux
Velocity frequency
P
C
0.5 0 1
(a) Payoff functions (b) Velocity frequency
V=5
V=4
V=2
V=3
V=1
V=0
V=5
V=4
V=2
V=3
V=1
V=0
0.244
0
Figure 8: Same as in Figure 2, except at
244.0
, which corresponds to point E in Figure 1(a). This behavior
corresponds to a D-dominate quasi-light PD game.
0.6
0.7
0.8
0.9
1
1.1
1.2
1.3
00.51
0.4
0.42
0.44
0.46
0.48
0.5
P
C
Normalized Velocity
Normalized flux
Velocity frequency
P
C
0.5 0 1
(a) Payoff functions (b) Velocity frequency
V=5
V=4
V=2
V=3
V=1
V=0
V=5
V=4
V=2
V=3
V=1
V=0
0.6
0
Figure 9: Same as in Figure 2, except at
6.0
, which corresponds to one of the three points C in Figure 1(a). This
behavior corresponds to a D-dominate Trivial game.
Normalized Density
η
0
0.01
0.02
0.03
0.04
0.05
0.06
0.07
0.08
0.09
0.1
00.20.40.60.81
D-dominate q-light PDG
D-dominate q-PDG
D-dominate Trivial Game
Neutral Game
Prisoner’s Dilemma Game
Figure 10: Effects of vehicle density on dilemma strength,
. Each color identifies one of the dilemma classses shown in
Figure 1(a): (A) Neutral game, (B) Prisoner’s Dilemma game, (C) D-dominate Trivial game, (D) D-dominate quasi-PD
game, and (E) D-dominate quasi-light-PD game.
SIMULTECH2014-4thInternationalConferenceonSimulationandModelingMethodologies,Technologiesand
Applications
522
