
Outlier-based Health Insurance Fraud Detection for U.S. Medicaid
Data
Dallas Thornton
1
, Guido van Capelleveen
1
, Mannes Poel
2
,
Jos van Hillegersberg
2
and Roland M. Mueller
3
1
University of California, San Diego, San Diego Supercomputer Center,
9500 Gilman Dr., MC 0505, La Jolla, CA 92093, U.S.A.
2
University of Twente, Drienerlolaan 5, 7522 NB Enschede, The Netherlands
3
Berlin School of Economics and Law, Badensche Straße 52, 10825 Berlin, Germany
Keywords: Fraud Detection, Medicaid, Healthcare Fraud, Outlier Detection, Anomaly Detection.
Abstract: Fraud, waste, and abuse in the U.S. healthcare system are estimated at $700 billion annually. Predictive
analytics offers government and private payers the opportunity to identify and prevent or recover such
billings. This paper proposes a data-driven method for fraud detection based on comparative research, fraud
cases, and literature review. Unsupervised data mining techniques such as outlier detection are suggested as
effective predictors for fraud. Based on a multi-dimensional data model developed for Medicaid claim data,
specific metrics for dental providers were developed and evaluated in analytical experiments using outlier
detection applied to claim, provider, and patient data in a state Medicaid program. The proposed
methodology enabled successful identification of fraudulent activity, with 12 of the top 17 suspicious
providers (71%) referred to officials for investigation with clearly anomalous and inappropriate activity.
Future research is underway to extend the method to other specialties and enable its use by fraud analysts.
1 INTRODUCTION
Roughly $700 billion of the $2.7 trillion spent on
healthcare in the US is attributable to fraud, waste,
and abuse (Kelley 2009). Healthcare payers deal
with fraudulent practitioners, organized criminal
schemes, and honest providers who make
unintended mistakes while billing for their
legitimate services. Government programs are
particularly susceptible to fraud, as it is harder to
exclude problematic providers than in privately
managed provider networks. Data analysis methods
utilized in other sectors are not yet widely deployed
and utilized in this domain, partially due to the high
level of subject matter knowledge needed to adapt
these techniques to the unique environments in
which they must be deployed. Yet, with up-front
engineering and ongoing adaptations, techniques
such as outlier detection offer a lifeline to programs
struggling to rein in spiraling costs and remain
solvent.
Unsupervised data mining techniques such as
outlier detection are suggested as effective
predictors for fraud. This paper proposes and
evaluates a method for applying outlier detection to
healthcare fraud based on comparative research,
fraud cases, and literature review. Based on a multi-
dimensional data model developed for Medicaid
claim data (Thornton et al. 2013), specific metrics
for dental providers were developed and evaluated in
analytical experiments using outlier detection
applied to claim, provider, and patient data in an
actual state Medicaid program. The proposed
methodology successfully identified fraudulent
activity, with 12 of the top 17 suspicious providers
(71%) referred to officials for investigation with
clearly anomalous and inappropriate activity. The
research methodology of Hevner et al. (2004) was
chosen to guide our work of designing a construct
for fraud detection that should be improved and
adapted based on environmental feedback and an
evolving knowledge base.
2 KNOWLEDGE BASE
Existing literature discusses how electronic fraud
detection could help combat health care fraud by
684
Thornton D., van Capelleveen G., Poel M., van Hillegersberg J. and Mueller R..
Outlier-based Health Insurance Fraud Detection for U.S. Medicaid Data.
DOI: 10.5220/0004986106840694
In Proceedings of the 16th International Conference on Enterprise Information Systems (ISS-2014), pages 684-694
ISBN: 978-989-758-028-4
Copyright
c
2014 SCITEPRESS (Science and Technology Publications, Lda.)

securing the claim input process, checking on
irregularities, and analyzing claim data sets to search
for behavioral indicators of fraud (Aral et al. 2012;
Bolton & Hand 2002; Forgionne et al. 2000; Ortega
et al. 2006). Unfortunately, due largely to the
begrudging acknowledgement of fraud in health
care, the complexity of the claim systems, the size
and distributed storage of claim data and the late and
relatively low funding for fraud detection,
development of electronically fraud detection
systems is lagging industries such as banking and
telecommunications. There is a large base of
statistical methods that are also used in other
industries and could potentially be applied within the
health care industry (Travaille et al. 2011). Some
research reported specific fraud scheme detection
using data mining approaches (Forgionne et al.
2000; Major & Riedinger 2002; Musal 2010; Ng et
al. 2010; Shin et al. 2012), however an outstanding
challenge is to explore other healthcare fields for
potential data mining possibilities and develop a
more applied approach to this problem.
Data mining is gaining more attention by
researchers as a potential tool to find healthcare
fraud more easily (Aral et al. 2012). Most of the
studies consider outlier detection as one of the
primary tools (Weng & Shen 2008). Researchers
have combined multiple methodologies such as
fuzzy logic in medical claims assessment and neural
networks for automatic classification (Travaille et al.
2011). In the early 2000’s, some initial concepts of
data warehousing for data mining purposes in health
care arose (Forgionne et al. 2000). Major and
Riedinger (2002) developed an electronic fraud
detection application to review providers on 27
behavioral heuristics and compare those to similar
providers. A provider score was calculated based on
these heuristics followed by a frontier identification
method to select providers as candidates for
investigation. Another example identified a number
of meaningful rare cases in pathology insurance data
from Australia’s Health Insurance Commission
using an on-line discounting learning algorithm
(Yamanishi et al. 2004). In Taiwan scientists
developed a detection model based on process
mining that systematically identified practices
derived from clinical pathways to detect fraudulent
claims (Yang & Hwang 2006).
In Canada, researchers used Benford’s Law
Distributions to detect anomalies in claim
reimbursements (Lu & Boritz 2005). Although the
method did find some suspicious behavior, its
potential for fraud identification seemed to be
limited in this case. One of the main reasons is that
Benford’s law uses overly frequently used first-
digits to find fraud. However, this does not
necessarily apply to services with payer-fixed prices.
In Chile, a private health insurance company
built applications of neural networks used to find
medical abuse and fraud (Ortega et al. 2006). The
innovative aspects of the application concerned a
method that could process the claims on a real time
basis. Other examples are the application of
association rule mining to examine billing patterns
within a particular specialist group to detect these
suspicious claims and potential fraudulent
individuals (Shan et al. 2008) or the use of clustering
procedures as well as regression models for
geographical analysis of possible fraud (Musal
2010).
Ng et al. (2010) experimented on detecting non-
compliant consumers (prescription shoppers) in
spatio-temporal health data of Medicare Australia
using multiple metrics that flagged providers.
Although beneficial experimental results were
achieved and the authors consider spatial and
temporal factors to be effective in metrics,
significant benefits concerning the use of spatial-
temporal factors instead of more traditional metrics
could not be verified. The simpler metrics, such as
multiple visits or prescription percentages of
pharmacy visits for drugs of concern, have proved
valuable activity as well. Also Tang et al. (2011)
described the problem of prescription shopping in
their research. They used integrated techniques like
feature selection, clustering, pattern recognition and
outlier detection. Using a threshold on the outlier
score provider groups could be marked as potential
fraudulent.
Iyengar et al. (2013) described a methodology
for identifying and ranking candidate audit targets
from prescription drugs. The researchers developed
a normalized baseline behavioral model for each
prescription area and searched for statistically
significant deviations from that model. For some of
the areas, up to 500 features were used to find
anomalies. For the narcotic analgesics drug class, all
the known cases of fraud were correctly identified
by the model as being very abnormal and excessive.
The research of Thornton et al. (2013) builds
upon Sparrows fraud type classifications and
developed a Medicaid multidimensional data schema
and elaborated on analysis techniques that help to
predict the likelihood of finding fraudulent activities.
A scope and extent of health care fraud was
described by Travaille et al. (2011) that provided an
overview of the electronic fraud detection from other
industries applicable to the health care industry. The
Outlier-basedHealthInsuranceFraudDetectionforU.S.MedicaidData
685

authors advocated the use of statistical methods for
detection fraud and abuse for many of the health
care areas, and gave insight in the multiple fraud
schemes that are used by criminals in health care.
The work of Phua et al. (2010) includes a
comprehensive survey of data mining-based fraud
detection research. He categorizes, compares and
summarizes a decade of research papers about
automated fraud detection.
In general, the papers suggest and justify the
applicability of data mining techniques in detecting
healthcare fraud. Most describe the process of metric
gathering, valuing and validation, and how dynamics
force adaptation within a continuously changing
environment. Most papers have a focus on a specific
health care area, which seems to indicate a non-
homogeneous field for application. In search for
generalizability we look for a common approach that
can be extended and applied flexibly at scale. Our
goal is to apply this methodology on the total set of
Medicaid data, including over 70 million
beneficiaries. Therefore, we need a generic approach
to developing predictors for detection of healthcare
fraud in multiple health specialties.
3 ENVIRONMENT
“Fraud is the intentional deception or
misrepresentation that an individual knows to be
false or does not believe to be true and makes,
knowing that the deception could result in some
unauthorized benefit to himself/herself or some
other person” (Department of Health and Human
Services 1998). In developing our metrics, model,
and overall construct, we bear in mind this definition
and set the goal for identifying provider-based
fraudulent activity. Providers are the initiating actor
for billing healthcare payers, and, as such, quickly
become the nexus for fraud schemes.
When a provider participates in Medicaid, the
provider agrees to reimbursement by the state and
submits claims for payment directly to the state or
managed care entity. States operate claims
processing systems that perform various prepayment
checks and edits to inspect the claim’s legitimacy.
Edits and audits verify information with honest
providers in mind, but they are not designed to detect
fraud schemes of any depth (Sparrow 2000). These
systems simply cannot verify that the service was
provided as claimed, that the diagnosis is correct, or
whether the patient is even aware of the claimed
services.
Health care reimbursement policy varies state to
state and even across different patient populations,
meaning metrics and predictors of fraud in one state
must be adapted to be relevant in the differing
policies of another. In this paper, we focus on a
generalizable model that can be applied across
programs with differing parameters and settings
applied to accommodate for policy and program
differences.
4 METHOD FOR APPLYING
OUTLIER DETECTION TO
HEALTHCARE FRAUD
To best address the need for iterative metric review,
adjustment processing, and iterative weighting
modifications, we have developed an iterative
process for applying outlier detection to healthcare
fraud, shown in Figure 1. In the subsequent
subsections, we will describe each phase of this
process.
4.1 Compose Metric Sets for Domains
Metrics can be derived and designed in multiple
ways: through case analysis, by literature review, by
study of attributes in the data model, or by
cooperation with businesses of an industrial sector.
Although a case study may be an instrument that
helps to create a set of metrics, evaluation of the
metrics by means of experts and flagging results is
an absolute necessity. The set of metrics chosen in
this paper consists of metrics based on analyzed
cases from the FBI (U.S. Federal Bureau of
Investigation 2013), metrics developed through
discussions with healthcare fraud experts, and
metrics found in existing literature (Musal 2010; Ng
et al. 2010; Shin et al. 2012; Tang et al. 2011; U.S.
Government Accountability Office 2012). To
understand the process of fraud metric extraction we
illustrate two examples of fraud cases that helped to
design identifying metrics.
First, in a recent fraud case in New Jersey, a
physician and owner of a home-based physician
services firm for seniors plead guilty for charging
lengthy visits to elderly patients that they did not
receive (District of New Jersey U.S. Attorneys
Office 2013). The physician in dispute received at
least half a million dollars and was eventually
detected because he became the highest billing home
care provider among over 24,000 doctors in New
Jersey from January 1, 2008 through October 14,
2011. Intentional over-billing for services, also
ICEIS2014-16thInternationalConferenceonEnterpriseInformationSystems
686

known as up-coding, is a typical behavior that can be
detected using metrics. Derived from this case was
the ‘visit length’ metric. The comparison of peers
based on the proportion of each visit length could
identify such fraud. The assumption is that criminal
providers may claim a higher proportion of lengthy
patient visits than their peers.
Second, a Texas doctor owned a community
medical center and falsely represented office visits
and diagnostic test that were medically unnecessary
from February 2010 until February 2011 (District of
Texas U.S. Attorneys Office 2013). In exchange for
submitting to diagnostic tests, patients at the clinic
were prescribed controlled substances, incentivizing
the patient to return for follow-up visits. The creation
of fictitious symptoms provided the doctor reason to
prescribe the narcotics and provided plausible
rationale for ordering more tests. An indication for
this type of fraud can potentially be found in the
referral rate. Despite their apparent deteriorating
condition, patients in this case would rarely be
referred to an outside specialist, as this would
obviously reveal that they are healthy. It might also
be found in the amount and/or types of specific tests
the doctors would prescribe to their patients as
compared to peer physicians. A third telling metric
could be patient retention and frequency of visits.
Although most general physicians have returning
patients, when a large proportion of patients return
too often, this would seem quite suspicious and stand
out as compared to peers.
Metric identification is a complex task that
requires the knowledge of both, the health care
domain and statistical theory. In the metric design
process, it requires more than analysis of fraud cases
to find fraud indicators. A group of outliers will
normally consist of some outliers based on statistical
deviation, just by chance, which cannot be filtered
within a single metric. Only when fraudulent
providers will take a more deviant position in the
group of outliers, normal providers may shift to the
non-outlying group, leaving the ‘bad guys’
separated. However, there are always providers that
will be classified as outliers, although they are not
fraudulent, due to the fact that their practice actually
differs too much from the closest comparable peer
group. Filtering this non-fraudulent provider or
moving them to alternate peer groups can be done,
but it is difficult to impossible without significant
understanding of the domain.
Figure 1: Method for Applying Outlier Detection to Healthcare Fraud.
Outlier-basedHealthInsuranceFraudDetectionforU.S.MedicaidData
687

The set of metrics does not necessarily have to be
large; on the contrary, often 25 to 30 features are
sufficient. If hundreds of metrics have to be
designed, the absolute amount of outliers is increased
as well, which eventually will result in all providers
displaying outlying behavior for some metrics.
Metric identification is dependent on fraud experts
and is an iterative process to find a set of metrics that
works effectively. For our case study, we initially
developed over 100 behavioral metrics. This list was
subsequently refined to fifteen that could be applied
to a relatively homogenous provider pool in the
dental domain, feasible for implementation within
our research case constraints.
4.2 Clean and Filter Data
This phase creates a workable set of data for the
analysis. This consists of cleaning the data set and
selecting only the relevant data of those providers to
be analyzed.
The first task relates to data quality, which has to
be estimated in order to determine the precision of
computations. Where data quality may be reduced by
multiple influences, three main concerns are
addressed. First, merging multiple databases of
information about common entities is frequently
encountered in large commercial and government
organizations (Hernández & Stolfo 1998). Second,
there is also the problem of entered data quality.
Health insurance data is subject to quality problems
in various ways. Data entry is often done by hand,
which is shown to be inaccurate in about 4.4% in
cases on personal information, and even higher
percentages when abstracting data (Colin et al.
1994). Third is the use of inaccurate data. Claims are
often incorrectly submitted and adjusted afterwards.
These claims should be removed if possible. Data
cleansing is highly suggested prior to analysis. Data
cleansing will process the data in order to detect and
correct (or remove) corrupt or inaccurate records
from the record set, table, or database.
After cleaning, filtering is required—the task of
selecting only that data which can be used for
analysis. All data containing missing values that
cause the inability to calculate metrics, should be
removed or estimated with imputation. Claims that
are voided from the system will be filtered out from
the data set used for analysis. The result set of claim
transaction data should meet the ISO 8000 data
quality criteria, as far as possible, before continuing
the analysis.
4.3 Select Provider Groups, Compute
Metrics
Providers should be similar so that it is meaningful
to compare their behavior. The main problem is that
the more homogeneous a providers group is,
comparison may be better delineate true outliers,
however, the sample size of providers will decrease
as well. Three questions arise. Is there a minimum
sufficing data quantity that should qualify a provider
for the metric? For example, a provider with only 2
claims per month should probably be excluded.
What is the minimum provider sample size
acceptable to delineate outliers with reasonable
certainty? A group of only 5 providers will likely not
produce trustworthy comparisons. What provider
characteristics can be used to group similar provider
populations suitable for comparisons? Apart from
operating within the same domain or sub-domain,
other provider characteristics may influence the
analysis, such as the provider size or volume of
patients. If a cluster analysis is done to detect such
differences, the cluster criteria would help identify
these different groups.
To apply metrics in analysis, calculations of those
are performed and stored. The data time frame over
which the metric is calculated must be defined. In
our experiment we took a snapshot of provider
behavior for each metric in a time frame.
4.4 Compare Providers by Metric, Flag
Outliers
The analysis interval, the frequency to compute the
metrics and perform the analysis, should be defined.
A reasonable approach in our environment, in which
new data is loaded monthly, is to calculate the
metrics on a monthly basis. We defined
requirements for the computational resources and for
the subject matter experts.
Next, the appropriate analysis techniques and/or
outlier detection methods should be used for each of
the metrics. Examples of analysis techniques used in
our experiment were univariate analysis, multivariate
analysis, time-series analysis, and box-plot analysis.
The following outlier detection methods were used:
deviation from regression model, deviation clusters,
single deviations from clusters, trend deviations, and
peak deviations, making use of both non-parametric
and parametric deviations. In the figures 2–5 we will
show some examples of the different analyses.
Figure 2 shows the regression analysis between
the total dollar amount reimbursed by Medicaid to a
provider, and the number of reimbursed claims. The
ICEIS2014-16thInternationalConferenceonEnterpriseInformationSystems
688
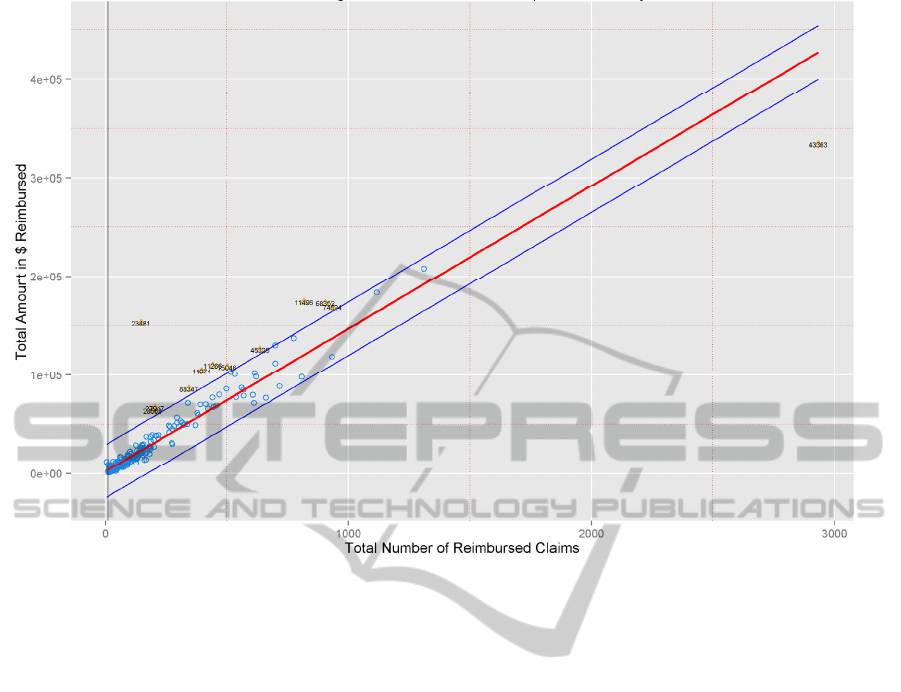
Figure 2: Regression of Reimbursement pre Beneficiary.
red line is the fitted linear model through the data
points. The blue lines represent the 2.33 sigma’s
deviation from the logical model. Provider 23481,
plotted in the left top corner, was one of the
providers that attracted attention, because of its
severe outlying behavior, and would be an
interesting candidate for further analysis to find the
cause of higher average of this provider on
reimbursements.
Outliers influence sample means and deviations
and therefore could mask themselves. This ‘masking
effect’ could be reduced by robust estimation
procedures (Rousseeuw & van Zomeren 1990).
However, we did not use these unmasking
procedures in this study.
Figure 3 shows the boxplot outlier analysis by
tooth code. Roughly 1–32 are adult teeth. The
assumption is that providers that constantly perform
treatments on the same tooth are interesting.
Previous fraud cases mentioned examples of
providers that claimed exact copies of procedures for
different patients, to receive more reimbursements.
These copies will be visible when we look at the
tooth code, for example.
Another type of fraud that might reveal from this
analysis is the recursive treatment on a tooth. If a
provider fills it with amalgam, repeats it with a
correctional procedure, but finally pulls it and puts a
replacement, many procedures were performed on
the same tooth. Sometimes this happens because of
misdiagnoses, estimation errors, or coincidence. We
took provider 42953 that almost claimed 20% of its
procedures on code 03, about a 140 procedures. To
compare, the second most billed tooth of this
provider appeared 27 times, all other teeth below 10.
The procedures are spread over multiple patients, in
general one or two per patient. Most of the
procedures have code D0120, a periodic oral
evaluation on an established patient. The procedures
are nicely spread over the whole year, around 12 per
month.
Figure 4 shows the time series of a group of
providers with outlying peaks. Those providers with
a constant flow of claim submissions were compared
to see if sudden increases in claim numbers could be
found. The black dots represent the outlying peak
that has been identified. One interesting finding is
the green line (42748). The provider is not claiming
for patients and suddenly around week 13, he claims
over 300 patients per week. Simple explanations
might be the use of multiple Medicaid provider IDs,
or a wrong registration of specialty, namely the
provider corresponds to a mobile dental practice.
Outlier-basedHealthInsuranceFraudDetectionforU.S.MedicaidData
689
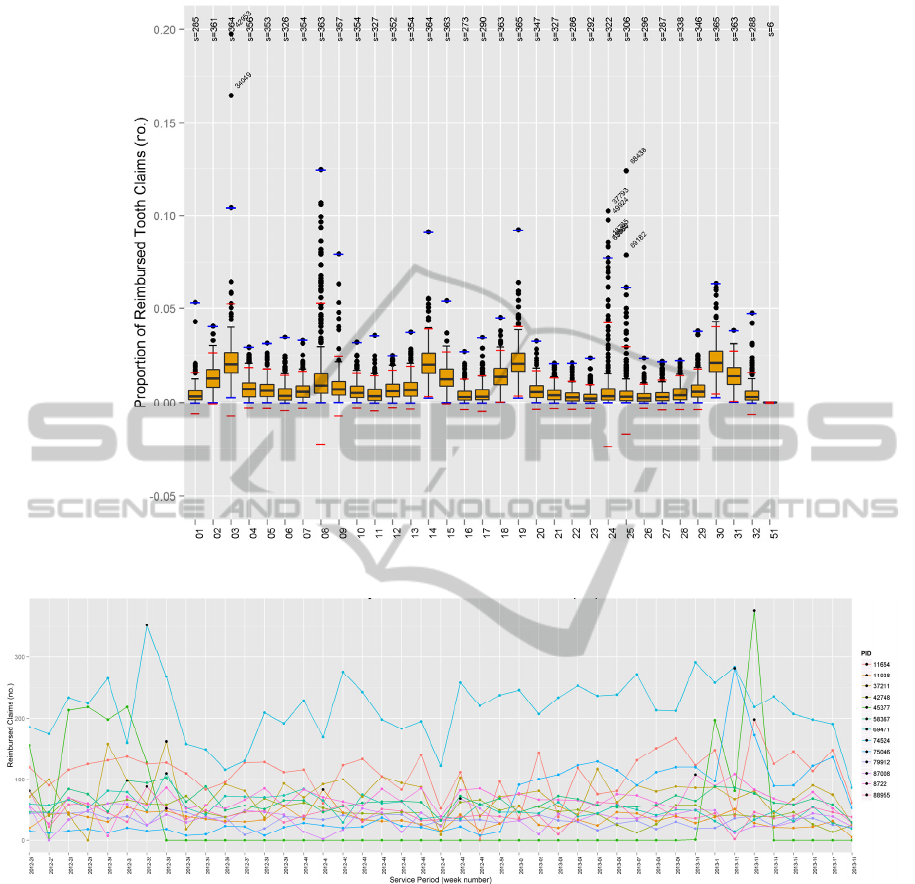
Figure 3: Tooth Code Analysis.
Figure 4: Peak Analysis: Time Series with Outliers of Reimbursed Claims.
Another provider that lighted up on this figure was
provider 75046. Questionable is the sudden peak in
week 12 of 2013. The number of claims rises from
around a 100 claims per week, to almost 300. After
analysis on a service code level we found suspicious
claims. Many children that visited the clinic that
week received exactly the same treatments, only on
different teeth. The combination of codes to reappear
so frequently can’t almost be a coincidence and
should definitely be further investigated.
Figure 5 shows the combination of multivariate
clustering and outlier detection. All data points
exceeding the pink line represent 2.33 sigma’s
deviation in the extreme y direction from the cluster
mean. Marked outliers thus have a considerable high
average of reimbursed claims per beneficiary.
Several reasons are possible for this phenomenon;
not all related to fraud. There could be strict
examination intervals to provide the best care, where
many people will see the dentist on a regular basis,
although this is costly. The maximization of the
reimbursement under Medicaid could be another
reason for a high average. Looking at provider 6950,
an analysis at the claim level was done. We found
that the high claiming behavior was caused by the
decoupling of services over multiple claims. When
ICEIS2014-16thInternationalConferenceonEnterpriseInformationSystems
690
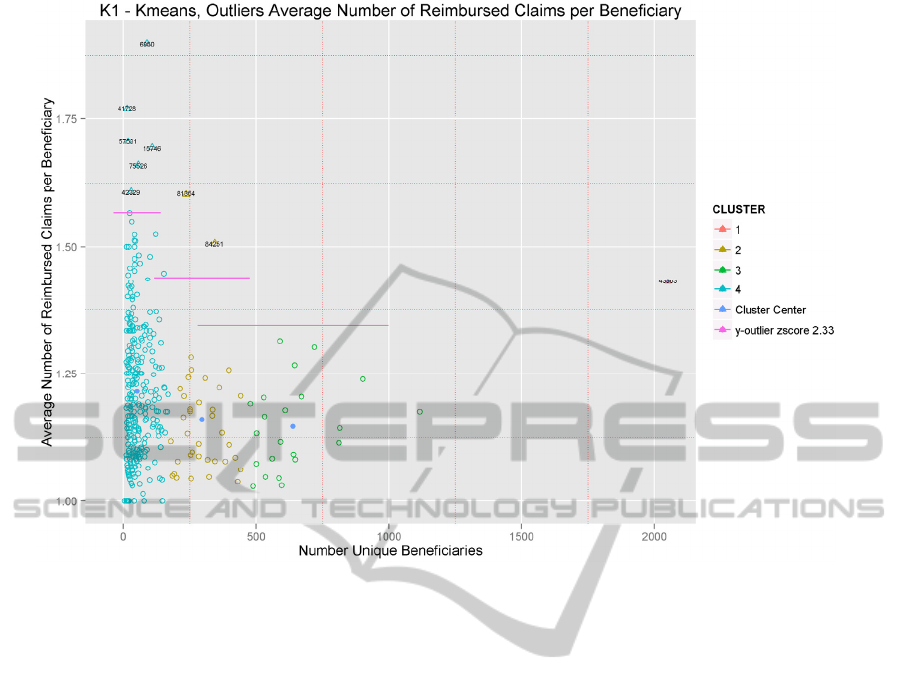
Figure 5: Multivariate Clustering and Outlier Analysis.
patient, service date, and treating dentists were
identical, services were just send in as two claims.
Does the provider decouple the claims to try to hide
something, or is it an administrative error?
4.5 Predictors Form Suspicion for
Provider Fraud Detection
An important aspect is how to report an anomaly and
how to relate it to indication of fraud. Once an
outlier criterion has been exceeded by a provider, we
raise a flag for the provider in that period. A flag is
the identification of an anomaly detected by the data
mining algorithm. Scoring is the formula of the
individual predictors for fraud detection based on the
individual results of each of the outliers in provider
analysis. The proposed scoring is a way of stacking
suspicion. A single provider analytic will flag some
honest providers. The assumption of using scoring to
find the most interesting providers to investigate for
fraud is that it will find those providers that are
frequent outliers on multiple predictors.
4.6 Report and Present to Fraud
Investigators
Fraud investigators need flexible reporting. In our
view, there is no specific pre-defined way for
reporting the data. A combination of dashboards and
interactive multidimensional processing is therefore
recommended. On the dashboard level we provide
high level information on providers, by presenting
the provider metric results, alerts on those providers
that score deviant from others or on their history.
Within comparative analysis, we enable
investigators to drill down to the root of a claim to
learn how deviations might have occurred and to
collect the set of claims that needs further
investigations. A list of alerts and their scores might
be a starting point for investigators to begin their
analysis.
4.7 Metric Evaluation
Evaluation of predictor effectiveness is required to
make decisions for analyses and further metric
developments. Measuring “success” is a difficult
process since fraud is not established as fraud until
after a litigation. Given the years of time lag,
measuring convictions as justification for resource
allocation and input for iterative improvement is
suboptimal. Measuring investigations and audits
initiated by fraud experts after internal review is
certainly timelier and may be sufficiently reliable. If
Outlier-basedHealthInsuranceFraudDetectionforU.S.MedicaidData
691

fraud investigation initiations are chosen as
evaluation statistics, we may use the formulas of
precision and recall to calculate the effectiveness of
the method. A downside is that fraud investigations
might be systematically wrong initiated distorting
the effectiveness measurements. Fraud convictions
might eventually provide the contrary evidence,
however, we believe that fraud experts are capable
of interpreting these measurements meaningfully.
Thresholds, or configuration of the outlier detection
algorithms influence the classification of data points
as outliers. Restrictive outlier groups may minimize
the number of potential fraud, while less restrained
classification lead to false positives. The trade-off
may be measured in terms of precision and recall
(Aggarwal 2013).
5 EVALUATION: MEDICAID
DENTAL PROVIDERS CASE
STUDY
We performed a case study in which dental claims
were analyzed on 14 different metrics. The seven
stages to develop a successful fraud detection tool
were followed and one iterative cycle was
completed. A study on dental fraud has not been
reported so far in literature, although it represents a
large part of the Medicaid healthcare expenses.
Dentistry is also a large and homogeneous group of
providers that fit the criteria for the developed
methodology well. An attempt was made in
selecting metrics fitting within multiple known
categories where fraud could be found.
5.1 Data, Metrics, and Parameters
For the case study, 11 months of Medicaid records
from July 2012 until May 2013 were used for
analysis, containing about 650.000 dental claims.
The start date was the first of April 2013. To
enhance peer group homogeneity, we chose to take
only regular dental providers without any specialty
as our provider group. Before calculation, data was
processed for adjustments and cleaned for entries
containing incorrect data such as null values, zero
dollar payments, adjustments without original
claims, and future servicing dates.
The metrics were computed using Oracle SQL
Procedures and stored in database tables. Using the
R language, scripts were developed to calculate and
compare providers. The analyses developed in R
made use of built-in functionality extended with
statistical packages such a ’ggplot2’ and ’cluster’
required for functions such as fitting rule-based
models, k-means algorithms, and boxplots. The
application made use of a parameter file to configure
the analysis by example set data filter criteria, outlier
criteria, write back capabilities, and presentation
characteristics.
The minimum requirements for analysis varied
over the different types of analyses, as some metrics
required larger data sets to achieve significant
results. The baseline for a provider to be taken for
analysis was set to a minimum of either 10 unique
beneficiaries or $10,000 reimbursed per month.
Some of the predictors, such as the procedure code
analysis, required a minimum service amount per
year.
In the regression analysis, a deviation of 2.33
sigma from the underlying regression model was
considered to be an outlier. In the univariate analysis
we took the highest cluster, those providers that
scored as a group the highest for the specific metric.
In the multivariate analysis, using k-means
clustering, outliers were defined by the outlier
criteria, single data points deviating more than 2.33
sigma in y direction from its belonging cluster, or
outlier cluster if smaller than 5 items. Clusters were
formed using the k-means algorithm, set to 10
iterations. In the box-plots, the interquartile ranges
defined the outlier criteria, configured for each
metric separately.
As described in the methodology, a scoring
mechanism is suggested for pointing out the most
interesting cases to investigate. The scoring
algorithm would make use of the number of flags,
the importance value that has been assigned to a flag,
and partly of the provider flagging history. In this
study, the history was ignored due to the limited
length of the data set, and, as an initial full cycle,
flags for each of the metrics were equally weighted
to evaluate their impact and relevance.
5.2 Results
Beginning with a data set of over 500 dental
providers, the set was narrowed to roughly 360
providers through selection criteria. After
performing the analysis, only 35 providers raised 2
or more of the potential 14 predictive flags. 17
providers raised 3 or more flags. We focused on
these 17 providers to evaluate the potential efficacy
of the approach.
We interviewed qualified healthcare fraud subject
matter experts to evaluate the claims of and the
raised flags by these 17 providers. While some of the
ICEIS2014-16thInternationalConferenceonEnterpriseInformationSystems
692

flags could be understood as acceptable given the
types of services rendered or due to the provider’s
operating environment, there was a preponderance of
evidence suggesting that at least 12 of these 17
providers (71%) with three or more flags should be
immediately referred for audit and potentially to law
enforcement.
6 CONCLUSIONS AND FUTURE
RESEARCH
We structure our design science contribution
according to the Hevner et al. (2004) framework and
address a relevant problem in healthcare fraud
detection. This paper offers an artifact and a
description of a method for applying outlier
detection to healthcare fraud along with an
evaluation of this model in practice to a state-wide
database of actual healthcare claims with over 500
providers. The model is evaluated by applying it in
practice to actual healthcare data and having experts
review the results of the analysis. The paper
contributes to the literature by providing a roadmap
for future applications of outlier detection in
healthcare and potentially other corollary domains.
We used the domain context of Medicaid and
discussed considerations for its use in different data
contexts. We communicated the model to
stakeholders, including applying the overall process
and specific scoring methods in practice.
Through this research, we learned many insights
about antifraud efforts. Extensive healthcare subject
matter expertise is required to design analysis
techniques and interpret their results. Identifying 17
out of 360 (5%) primary dental providers for further
investigation, of which 12 of 17 (71%) have been
evaluated and deemed appropriate for formal
investigation can be considered a successful
outcome. As compared with prior comparative
success rates of roughly 10% (Major & Riedinger
2002), we see great opportunity in building upon this
model in various ways. Future research will dive
deeper, including evaluating specific outlier
techniques relevant to different types of healthcare
fraud, and look more broadly at methods and models
for storing and preserving the scoring metadata and
provenance information to allow for more automated
scoring, model adaptability, and reconstruction. With
this research we hope to both advance the state of the
art in healthcare fraud detection and prevention, as
well as materially assist tax payers and law
enforcement in confronting this important societal
challenge.
REFERENCES
Aggarwal, C. C., 2013. Outlier analysis, New York:
Springer.
Aral, K. D. et al., 2012. A prescription fraud detection
model. Computer Methods and Programs in
Biomedicine, 106(1), pp.37–46.
Bolton, R. J. & Hand, D. J., 2002. Statistical fraud
detection: A review. Statistical Science, 17(3),
pp.235–255.
Colin, C. et al., 1994. Data quality in a DRG-based
information system. International Journal for Quality
in Health Care, 6(3), pp.275–280.
Department of Health and Human Services, 1998.
Medicare A/B Reference Manual - Chapter 21 -
Benefit Integrity and Program Safeguard Contractors.
Available at: https://http://www.novitas- solutions.
com/refman/chapter-21.html [Accessed February 21,
2013].
District of New Jersey U.S. Attorneys Office, 2013. South
Jersey Doctor Admits Making Half-a-Million Dollars
in Fraud Scheme Involving Home Health Care for
Elderly Patients. Available at: http://www.fbi.gov/
newark/press-releases/2013/south-jersey-doctor-
admits-making-half-a-million-dollars-in-fraud-
scheme-involving-home-health-care-for-elderly-
patients [Accessed March 28, 2013].
District of Texas U.S. Attorneys Office, 2013. Physician
Pleads Guilty to Role in Health Care Fraud
Conspiracy. Available at: http://www.fbi.gov/dallas/
press-releases/2013/physician-pleads-guilty-to-role-in-
health-care-fraud-conspiracy [Accessed March 1,
2013].
Forgionne, G. A., Gangopadhyay, A. & Adya, M., 2000.
An intelligent data mining system to detect healthcare
fraud. In Healthcare information systems: challenges
of the new millennium. Hershey PA: IGI Global, pp.
148–169.
Hernández, M. A. & Stolfo, S. J., 1998. Real-world data is
dirty: Data cleansing and the merge/purge problem.
Data mining and knowledge discovery, 2(1), pp.9–37.
Hevner, A. R. et al., 2004. Design Science in Information
Systems Research. MIS Quarterly, 28(1), pp.75–105.
Iyengar, V. S., Hermiz, K. B. & Natarajan, R., 2013.
Computer-aided auditing of prescription drug claims.
Health Care Management Science, (July), pp.1–12.
Kelley, R. R., 2009. Where can $700 billion in waste be
cut annually from the US healthcare system? Ann
Arbor, MI: Thomson Reuters, TR-7261 10/09 LW.
Lu, F. & Boritz, J. E., 2005. Detecting fraud in health
insurance data: Learning to model incomplete
Benford’s law distributions. In Machine Learning:
ECML 2005. Springer, pp. 633–640.
Major, J. A. & Riedinger, D. R., 2002. EFD: A Hybrid
Knowledge/Statistical-Based System for the Detection
Outlier-basedHealthInsuranceFraudDetectionforU.S.MedicaidData
693

of Fraud. Journal of Risk and Insurance, 69(3),
pp.309–324.
Musal, R. M., 2010. Two models to investigate Medicare
fraud within unsupervised databases. Expert Systems
with Applications, 37(12), pp.8628–8633.
Ng, K. S. et al., 2010. Detecting Non-compliant
Consumers in Spatio-Temporal Health Data: A Case
Study from Medicare Australia. In Data Mining
Workshops (ICDMW), 2010 IEEE International
Conference on. pp. 613–622.
Ortega, P. A., Figueroa, C. J. & Ruz, G. A., 2006. A
Medical Claim Fraud/Abuse Detection System based
on Data Mining: A Case Study in Chile. In
Proceedings of the 2006 International Conference on
Data Mining. DMIN. Las Vegas, Nevada, USA:
CSREA Press, pp. 224–231.
Phua, C. et al., 2010. A comprehensive survey of data
mining-based fraud detection research. arXiv preprint
arXiv:1009.6119.
Rousseeuw, P. J. & van Zomeren, B. C., 1990. Unmasking
Multivariate Outliers and Leverage Points. Journal of
the American Statistical Association, 85(411), pp.633–
639.
Shan, Y. et al., 2008. Mining Medical Specialist Billing
Patterns for Health Service Management. In
Proceedings of the 7th Australasian Data Mining
Conference - Volume 87. AusDM ’08. Darlinghurst,
Australia, Australia: Australian Computer Society,
Inc., pp. 105–110.
Shin, H. et al., 2012. A scoring model to detect abusive
billing patterns in health insurance claims. Expert
Systems with Applications, 39(8), pp.7441–7450.
Sparrow, M. K., 2000. License To Steal: How Fraud
bleeds america’s health care system Updated.,
Boulder: Westview Press.
Tang, M. et al., 2011. Unsupervised fraud detection in
Medicare Australia. In Proceedings of the Ninth
Australasian Data Mining Conference-Volume 121.
pp. 103–110.
Thornton, D. et al., 2013. Predicting Healthcare Fraud in
Medicaid: A Multidimensional Data Model and
Analysis Techniques for Fraud Detection. Procedia
Technology, 9, pp.1252–1264.
Travaille, P. et al., 2011. Electronic Fraud Detection in the
US Medicaid Healthcare Program: Lessons Learned
from other Industries.
U.S. Federal Bureau of Investigation, 2013. FBI news
blog. Available at: http://www.fbi.gov/news/
news_blog [Accessed April 18, 2013].
U.S. Government Accountability Office, 2012. Medicare
Fraud Prevention: CMS has Implemented a Predictive
Analytics System, but Needs to Define Measures to
Determine its Effectiveness. Available at:
http://www.gao.gov/products/GAO-13-104 [Accessed
March 28, 2013].
Weng, X. & Shen, J., 2008. Detecting outlier samples in
multivariate time series dataset. Knowledge-Based
Systems, 21(8), pp.807–812.
Yamanishi, K. et al., 2004. On-line unsupervised outlier
detection using finite mixtures with discounting
learning algorithms. Data Mining and Knowledge
Discovery, 8(3), pp.275–300.
Yang, W.-S. & Hwang, S.-Y., 2006. A process-mining
framework for the detection of healthcare fraud and
abuse. Expert Systems with Applications, 31(1),
pp.56–68.
ICEIS2014-16thInternationalConferenceonEnterpriseInformationSystems
694
