
The Impact of High Dropout Rates in a Large Public Brazilian
University
A Quantitative Approach Using Educational Data Mining
Laci Mary Barbosa Manhães
1
, Sérgio Manuel Serra da Cruz
2
and Geraldo Zimbrão
1
1
PESC/COPPE - Programa de Engenharia de Sistemas e Computação, (UFRJ), Rio de Janeiro, Brazil
2
PPGMMC – Programa de Pós-Graduação em Modelagem Matemática e Computacional (UFRRJ), Seropédica, Brazil
Keywords: Educational Data Mining, Dropout Rate, Data Mining, Databases, Algorithms.
Abstract: This paper uses educational data mining techniques to identify the variables that can help educational
managers to detect students that present low performance or are in risk to dropout their undergraduate
education. We investigated real world academic data of students of the largest Public Federal Brazilian
University. We established three categories of students with different academic trajectory in order to
investigate their performance and the dropout rates. This study shows that even analyzing three different
classes of 14.000 students it was possible to have a global precision above 80% for several classification
algorithms. The results of Naïve Bayes model were used to support the quantitative analysis. In this work,
we stress that even few differences between the three classes of students that can be perceived on the basis
of qualitative information.
1 INTRODUCTION
Brazilians agree that the Public Federal Brazilian
Universities (PFBU) high dropout rates require urgent
solutions as do the appallingly low levels of work
readiness for a large number of people. Even
educators, educational managers and policy makers
agree that the Educational System is in desperate need
of reform.
Every year the educational system offers an
increasing number of seats in the public universities.
This is motivated by the necessity to prepare large
quantities of workers for engaging in the Brazilian
emerging economy. It is a nation with social or
business activity in the process of rapid growth and
industrialization. The students who quit of higher
education or take a long time to finish their
undergraduate courses are considered part of a bigger
problem that occurs in many PFBU.
Usually, PFBU offer the best quality education
and are 100% financed by the federal government.
Thus, to be admitted in a public university is an
expectation of the most part of young people.
However, the large amount of students which do not
complete it represent an elevated cost without return
to the government, society and institutions. For
instance, the government misuse lots of public money
to maintain professors, employers, equipments,
laboratories, libraries and empty classrooms, the
students have their future professional career
diminished, and the growth of the companies is
restricted due to the lack of skilled professionals in
the labor market. Last but not least, many students
dream of earning a degree that will help them secure a
job. Many of them, however, will not see that dream
come true.
The deep comprehension about the motivation
behind the phenomenon of dropout is complex.
Several studies have been realized to detect the causes
of high dropout rates in Brazilian educational system
(Soares, 2006) and (Lobo, 2011). There are some
explanation that tries to elucidate such phenomenon:
(i) difficulties to adapt to the academic environment;
(ii) difficulties to attend the courses; (iii) poor
academic background; (iv) lack of parental support or
(v) the needs of balancing long hours of labour and
study, just to name a few.
This paper uses Educational Data Mining (EDM)
techniques in the context of searching and extracting
relevant information from the already existing PFBU
databases. In this study, the real-world records were
extracted from the academic management system of
Universidade Federal do Rio de Janeiro (UFRJ), the
largest PFBU.
124
Mary Barbosa Manhães L., Manuel Serra da Cruz S. and Zimbrão G..
The Impact of High Dropout Rates in a Large Public Brazilian University - A Quantitative Approach Using Educational Data Mining.
DOI: 10.5220/0004958601240129
In Proceedings of the 6th International Conference on Computer Supported Education (CSEDU-2014), pages 124-129
ISBN: 978-989-758-022-2
Copyright
c
2014 SCITEPRESS (Science and Technology Publications, Lda.)

In order to investigate the high rates, we defined three
categories of possible student academic trajectory: (i)
dropout, (ii) still-enrolled and (iii) completer. The
term dropout was awarded to all students with
enrolment status (registration) cancelled by: (1)
student initiative: cancellation of the registration in an
undergraduate course; or (2) institution initiative:
registration cancelled for abandonment of the
undergraduate course, failure to complete curriculum
requirements and others disciplinary actions. The term
still-enrolled (non-completer) was awarded to all
students who are still enrolled, but present slow
progress to achieve their completion. Finally, the last
term, completer was awarded to all students who have
fulfilled all the requirements of the curriculum and
obtained their degrees.
We investigated the key factors about poor
student´s performance that are important to
determine and to identify the three groups that can
get success or fail in get their degrees. Those
characteristics of restriction represent a multi-class
problem. However, not all data mining algorithms
can evaluate a three-class problem. Thus, in order to
circunvent such issue we evaluated several EDM
algorithms and applied them to the records extracted
from the academic management system of UFRJ.
This paper is organized as follows. In Section 2,
related works are presented. Section 3 presents our
approach. In Section 4 presents a case study at
UFRJ. In Section 5 summarizes, the final
considerations and presents future works.
2 RELATED WORKS
In this section, we discuss previous works that
investigated the student dropout and performance
prediction using EDM techniques. At this time, there
are several definitions of the term dropout in the
literature and how to measure its rates. Likewise, the
meaning for still-enrolled or non-completers
(unfinished degrees). Before, starting discussing the
EDM related works; we assume that it is necessary
to define the terms used in this paper. We adopted
the same conceptualization used by the Brazilian
Ministry of Education to guide our work. It is
assumed that undergraduate course (undergraduate
programs) refers to the entire program (or
curriculum) of studies required to get a higher
degree. The term course refers to a unit of
instruction offered during the semester or academic
year to compose an undergraduate course. Some
works (Lykourentzou, 2009) and (Huang, 2011)
consider the term dropout when the student
abandons the course, for us the term dropout is used
to classify the student who fails to complete,
abandon or withdrawn their undergraduate course.
Some PFBU have already investigated dropout
measuring in it singular ways, and many of them
confirmed that non-completers could be strong
candidates to dropout (MEC, 1997), (Soares, 2006)
and (Lobo, 2011). Therefore, those previous works
considered different perspectives than ours: (i)
socioeconomic reasons (keep a job to live or to
support the family; the influence of the family); (ii)
vocational reasons (disappointment with erroneous
course choices); and (iii) academic reasons (failure
in initial courses, poor academic background,
difficulties in professor relationships or with
colleagues). However, the analysis of reasons (i) and
(ii) are multifaceted due to the student data
available. In turn, some features of item (iii) are
based on the information stored in Academic
Management System of the universities.
EDM is an emerging discipline used to handle
huge amounts of educational data spread across
many datasets. With regard to educational databases,
Baker and Yacef (2009) presented EDM as
concerned with developing, researching, and
applying computerized methods to detect patterns in
large collections of educational data that would
otherwise be hard or impossible to analyze due to
the enormous volume of data. Indeed, EDM is a new
approach to support educators, students, academic
manager, governments and society to take advantage
of such knowledge (Baker, 2009, 2011) and
(Romero, 2010, 2013).
Kotsiantis et al. (2003) work was focused on the
prediction of student´s dropout in undergraduate
courses at Hellenic Open University. The authors
analyzed the undergraduate course of “Informatics”
but considered a single online course “Introduction
in Informatics”. Such work compared six data
mining techniques. The authors asserted that the
Naïve Bayes algorithm was the most appropriate and
their conclusions could be widespread in the
majority of distance education curriculum in the
university.
Dekker (2009) investigated the Electrical
Engineering undergraduate course at the Eindhoven
University of Technology. Such study considered
the data collect from 2000 to 2009 from no more
than 648 students in the first year of their
undergraduate course. The author considered the
results of data mining techniques, and the overall
results shown decision tree algorithms as more
suitable for solving the problem. Pal (2012)
predicted the dropout of engineering students solely
TheImpactofHighDropoutRatesinaLargePublicBrazilianUniversity-AQuantitativeApproachUsingEducational
DataMining
125

of the first academic year. This research used four
data mining algorithms, but the emphasis was in the
analysis of the student data.
The above mentioned works are focused in
predicting student dropout in a particular
undergraduate course. In (Lykourentzou, 2009) and
(Huang, 2011) the research was in the context of a
specific course. Those works share similarities, such
as (i) they identify and compare algorithm´s
performance in order to find the most relevant EDM
to solve the problem, or (ii) they identify the
relevant attributes associated with the problem of
dropout.
As far as we are concerned, the key differences
from such related studies to our approach are the
following: (i) in our case, the number of samples
used to construct the subsets for applying EDM is
significantly higher than those works; (ii) the
number of student classes involved in our case was
also bigger; (iii) in our study, all undergraduate
courses of the largest Brazilian PFBU were
analysed, and (iv) we describe a quantitative
approach based on the prediction of EDM algorithm.
Therefore, we identify three different classes of
students that are aligned to common Brazilian
context: (i) dropout, (ii) still-enrolled and (iii)
completer. That classification is based on student’s
progress to complete academic requirements toward
completion. In addition, we create graphics to
represent clearly the students’ features obtained by
NaïveBayes classifier. The analysis evaluated the
performance of the students during 12 semesters
since their enrolment in the University. Besides, we
took into account each of the following semesters
and the distinct classes that the students have
attended.
3 THE PROPOSED APPROACH
High rates of dropping out are issues continually
debated. However, there are few systems that can
analyze the problem and identify the dropout in
advance or still-enrolled (non-completers) students.
Our approach uses techniques to identify and to
evaluate several factors that occur during the student
academic trajectory. The observation of the
performance of the student in every academic
semester represents a particular research to EDM
due to the possibilities of find interesting
information from data collected during a long period
of time. The EDM algorithms must have good
accuracy and to yield interpretable results. The
information obtained after the EDM process may
allow academic managers to trace the main factors
that define more narrowly the activities of students
and their expectations to complete their
undergraduate courses.
Our approach have three goals: (i) evaluate the
attributes available and identified those that
describes the student performance; (ii) testing EDM
algorithms and comparing their accuracy using a
three-class problem, and (iii) finally, present a
quantitative approach of the main observed factors
using the results of most accurate and interpretable
algorithm.
3.1 Description of Dataset
The pre-processing phase of student data must be
executed before the application of EDM techniques.
However, the availability of data is restricted and
selecting the key attributes is a hard job and time
consuming task. In our study, we did not adopt the
use of non-academic information because was out of
the scope of this study to collect non-academic
information for all students of UFRJ. Other authors
used non-academic data, but there is a lack of
information in the literature about the adequate data
for predicting the academic student performance.
Indeed, we emphasize that all of the student data
analyzed in this study was provided by the
Academic Management System of UFRJ.
The following attributes were considered:
anonymized student identification (id),
undergraduate course id, year and semester of
admission, undergraduate course status, CGPA (is a
calculation of the average of all cumulative student's
grades for all courses completed in years of study).
The attributes for the semester are: semester id,
status of the semester id, GPA (it is the average took
in the current semester). We also considered several
attributes about the student enrolled in the courses of
a semester, such as course id, number of credits, the
numeric grade and an alphanumeric grade (course
final situation: approved, failed, absence).
3.2 Selection of Attributes to EDM
The dataset were not ready to be directly used by the
EDM algorithms. Thus, we conducted many
experiments to define the necessary transformation
rules for deriving the best attributes values. Those
initial data transformation experiments were
executed and discussed in a previous work presented
by our research group (Manhães, 2012). Several new
attributes are considered in this work, for instance,
(1) student id is the key to identify the student in the
CSEDU2014-6thInternationalConferenceonComputerSupportedEducation
126

datasets; (2) semester id is used to identify the data
of the semester; (3) a novel attribute to store the
number of courses in which a given student is
enrolled in the semester; (4) number of courses
approved in the semester; (5) the average grade of
the approved courses; (6) number of course, in
which the student fails due to absence or low grade;
(7) number of course that the student failed due to
low grade; (8) GPA; (9) semester enrolment status;
(10) CGPA; and (11) undergraduate course status, it
is used as a class label attribute. Such attribute has
three values that describe the final state of the
student enrolment: dropout, still-enrolled (non-
completer) and completer.
3.3 EDM Techniques
In this work, we select the classifier algorithms for
dealing with a multi-classes problem. Besides, we
considered the accuracy and interpretability model
of well known and more frequent classifiers
algorithms used in data mining. We compared five
Weka classifiers: decision tree J48 (C-4.5) and
SimpleCart, Support Vector Machine (SVM),
probabilistic model (Naïve Bayes), and neural
network (Multilayer Perceptron - MP).
4 A CASE STUDY AT UFRJ
In this work, we have investigated the student
admissions since the first semester of enrolment at
the UFRJ over the period 2003 to 2004. We selected
all records about individual student´s academic
trajectory in each semester from 12 semesters after
first enrolment (up to 2010-2). Our database
includes 155 different undergraduate courses offered
by 28 distinct departments of UFRJ. The Table 1
illustrates the number of student divided into three-
classes established in this study.
Table 1: The number of first year students.
Admission
Y/S
Dropout
Still-
enrolled
Completer Total
2003-1 1448 365 1995 3808
2003-2 1204 342 1494 3040
2004-1 1733 605 1900 4238
2004-2 1255 616 1280 3151
Due to the limit of space, we present only the
results details obtained to the database of students
who were first year enrolled in 2003-1. Another
requirement to apply data mining classification
algorithms is the division of the database, in this
case study, we chose k-fold cross-validation with the
number of sets equal to 10 (k = 10), due to the large
number of samples available in the database. Table 2
presents the results of five classifier algorithms over
the databases identified by student admission in a
year/semester (2003-1).
Table 2: The classifiers, accuracy, the confusion matrix
and True Positive (TP) rate. In the confusion matrix, the
following labels are used for the classes (a) dropout, (b)
still-enrolled and (c) completer.
Classifier Accuracy
Confusion Matrix
a b c
TP
Rate
J48 (C4.5) 82.77 %
1172 68 208
67 126 172
84 57 1854
0,809
0,345
0,929
SimpleCart 83.90 %
1179 59 210
52 165 148
72 72 1851
0,814
0,452
0,928
SVM 87.39 %
1249 64 135
77 184 104
51 49 1895
0,863
0,504
0,950
Naïve
Bayes
79.59 %
1079 150 219
27 243 95
38 248 1709
0,745
0,666
0,857
Multilayer
Perceptron
85.34%
1190 64 194
58 155 152
36 54 1905
0,822
0,425
0,955
The classifiers differ from each other in the run
time (in seconds) to build one model: J48 (0.89),
SimpleCart (29.11), SVM (15.85), Naïve Bayes
(0.13) and MP (4607.21). The more sophisticated
algorithms require longer times to build models.
Otherwise, more simple algorithms lose a little bit in
the accuracy of the model. The accuracy and TP
rates showed a suitable classification models for all
algorithms when applied to the three classes of
students. The results presents in table 2 are very
similar for other databases 2003-2, 2004-1 and
2004-2 (Table 1).
4.1 EDM Quantitative Approach
In this paper, we analyzed the academic trajectory of
about 14.000 students at UFRJ. We investigated 12
academic semesters from the first student enrolment.
In this period, it was possible to observe and
compare the features of the three class of student.
Although, the Naïve Bayes classifier has not
presented the best accuracy when compared to other
algorithms, its overall performance meets the
objectives of this work. The model generated by the
algorithm is easier to be interpreted by humans and
adapted to the process of data visualization.
TheImpactofHighDropoutRatesinaLargePublicBrazilianUniversity-AQuantitativeApproachUsingEducational
DataMining
127
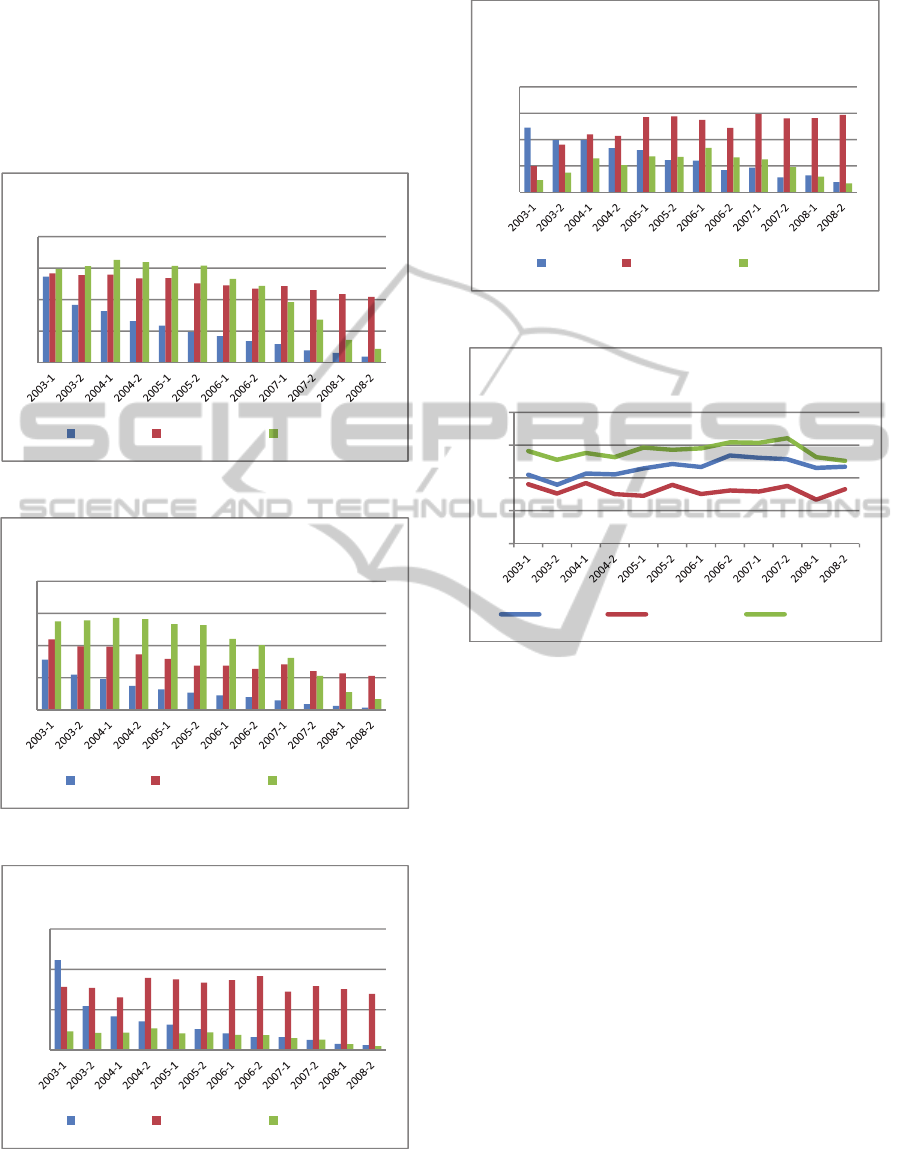
Our quantitative approach was based on the results
obtained with Naïve Bayes classifier; that
information was converted in graphs. The following
graphs show in the x-axis a time interval (semesters)
from 2003-1 to 2008-2, and a colour legend
identifying the three classes of students (dropout,
still-enrolled, completer).
Figure 1: Number of courses registration in each semester.
Figure 2: Number of courses with passing grade.
Figure 3: Number of courses with failing grade.
Figure 4: Number of courses with fail or absent fail grade.
Figure 5: Average grade of passing courses.
4.2 Analysis of the Results
As described in Table 1, the database comprises a
significant number of samples for each subset of
student. Due to space reasons, we present the results
for 3.808 students that were admitted in the first
semester of 2003 (2003-1). However, the same EDM
procedures described above were done with students
which were admitted in three consecutive semesters,
2003-2, 2004-1 and 2004-2. The results obtained were
very similar to those found in the 2003-1database.
We summarized the most relevant features
concerned with the three classes of students analyzed.
The figure 1 shows that, in the first semester, all the
students are enrolled at about 5 to 7 courses; it
depends on the undergraduate grading scheme.
It was observed that students that quit the studies
at UFRJ present the following features: (1) they
reduced the courses enrolment in each semester until
withdraw; (2) they have a decreasing number of
courses with passing grades in each semester; (3) they
have at least one course with fail grade in the first
academic semester; (4) they have at least one course
with fail or absent fail (AF) grading in the first
0
2
4
6
8
NumberofCoursesperSemester
Dropout Still‐enrolled Completer
0
2
4
6
8
NumberofPassCoursesperSemester
Dropout Still‐enrolled Completer
0
0,5
1
1,5
NumberofFailCourseperSemester
Dropout Still‐enrolled Completer
0
0,5
1
1,5
2
NumberofFailorAbsenceCoursesper
Semester
Dropout Still‐enrolled Completer
65
70
75
80
85
AverageGradeofPassingCourses
Dropout Still‐enrolled Completer
CSEDU2014-6thInternationalConferenceonComputerSupportedEducation
128

academic semester; (5) at the end of the first semester,
the students who give up had the average grades of
passing courses lower than completers, and finally,
(6) comparing Figure 1 and Figure 2, the student who
dropped out have a good grade about (74-78), but in
very few courses.
With respect of the still-enrolled students that
were observed in the investigated subset. We
observed that they maintained their enrolment active
by the year/semester of 2009-1. They have the
following features: (1) they are enrolled at about 5
courses during the undergraduate course; (2) they
decrease the number of passing course in each
semester; it is less than completers students but higher
than the ones who quit; (3) during the semesters, they
have higher possibilities of failing a course, compared
to others classes of students, and finally, (4) in the
first semesters they have less than one course with fail
or AF grading, in the following semesters the number
of course is above one; (5) the average of grade of
passing courses is the lowest comparing with two
other classes.
With regard to students who complete the course,
they have the following features: (1) maintain a high
number of courses enrolment in each semester; (2)
have a high rate of pass courses; (3) the number of fail
courses is close to zero throughout during the stay in
the university; (4) the average of courses with fail and
AF grading is less than one; (5) maintain the average
of pass courses close to the value of the CGPA until
the 8th semester of the degree. Students who
completed the degree present a regular behaviour
throughout all semesters; they enrolled in a high
number of courses and got high average passing
grades.
5 CONCLUSIONS
This paper compared five classification algorithms;
the results allowed us to investigate a three-class
problem related to the situation of the students of the
largest Brazilian PFBU. The SVM algorithm was
unfeasible to be used because the time spent to
construct the model was too high. The algorithm
Naïve Bayes has an interpretable model and its
numerical results can easily be converted into graphs.
In this paper, we presented a quantitative approach
using the results of such algorithm. The quality of the
results opens the novel possibilities of further
investigations, the development of an information
system capable of facilitating the management of
academic universities. The direct benefits of applying
data mining in this context are: (i) identify the course
students more likely to dropout and still-enrolled
students; (ii) allow the FPBU to use not only
statistical analysis of facing the problem of high
dropout rate.
REFERENCES
Baker, R. S. J. D., Yacef, K., 2009. The state of educational
data mining in 2009: A review and future visions. J. of
Educational Data Mining 1.1, 3-17.
Baker, R., Isotani, S., Carvalho, A., 2011. Mineração de
Dados Educacionais: Oportunidades para o Brasil.
Revista Brasileira de Informática na Educação.
Dekker, G., Pechenizkiy, M., Vleeshouwers, J., 2009.
Predicting Students Drop Out: A Case Study. In
Proceedings of the int. Conf. on Educational Data
Mining. Cordoba, Spain, 41-50.
Huang, S., 2011. Predictive Modeling and Analysis of
Student Academic Performance in an Engineering
Dynamics Course. Ph.D. Thesis, Utah State University,
Logan, USA.
Kotsiantis, S., Pierrakeas, C., Pintelas, P., 2003. Preventing
student dropout in distance learning using machine
learning techniques. KES, eds. V. Palade, R. Howlett &
L. Jain, Springer, v. 2774 LNCS, pp. 267–274, 1087-
6545.
Lobo, M. B. C. M., 2011. Panorama da evasão no ensino
superior brasileiro: aspectos gerais das causas e
soluções. Instituto Lobo & Associados Consultoria.
Lykourentzou, I. et al., 2009. Dropout prediction in e-
learning courses through the combination of machine
learning techniques, Computers & Education, v. 53, N.
3, pp. 950-965.
Manhães, L. M. B., Cruz, S. M. S., Costa, R. J. M, Zavaleta,
J. and Zimbrão. Identificação dos Fatores que
Influenciam a Evasão em Cursos de Graduação através
de Sistemas Baseados em Mineração de Dados: Uma
abordagem Quantitativa. In: VIII Simpósio Brasileiro de
Sistemas de Informação (SBSI 2012) (São Paulo, Brasil,
May 16-18, 2012), 468-479.
MEC, 1997. Ministério da Educação e Cultura. Diplomação,
Retenção e Evasão nos Cursos de Graduação em
Instituições de Ensino Superior Públicas.
Pal, S., 2012. Mining educational data to reduce dropout
rates of engineering students. International Journal of
Information Engineering and Electronic Business
(IJIEEB), 4(2), 1.
Romero, C., Ventura, S., 2010. Educational Data Mining: A
Review of the State of the Art, Systems, Man, and
Cybernetics, Part C: Applications and Reviews, IEEE
Transactions, v.40, n.6, 601-618.
Romero, C., Ventura, S., 2013. Data Mining in Education.
Wiley Interdisciplinary Reviews: Data Mining and
Knowledge Discovery, In Press. v. 3, n. 1, 12-27.
Soares, I. S. 2006. Evasão, retenção e orientação acadêmica:
UFRJ. In: Anais do XXXIV COBENGE - Congresso
Brasileiro de Ensino de Engenharia.
TheImpactofHighDropoutRatesinaLargePublicBrazilianUniversity-AQuantitativeApproachUsingEducational
DataMining
129
