
How do Student Evaluations of Courses and of Instructors Relate?
Tamara Sliusarenko, Line H. Clemmensen and Bjarne Kjær Ersbøll
Department of Applied Mathematics and Computer Science, Technical University of Denmark, Matematiktorvet, Building
324, Kgs. Lyngby, Denmark
Keywords:
Course Evaluation, Teacher Evaluation, Canonical Correlation Analysis.
Abstract:
Course evaluations are widely used by educational institutions to assess the quality of teaching. At the course
evaluations, students are usually asked to rate different aspects of the course and of the teaching. We pro-
pose to apply canonical correlation analysis (CCA) in order to investigate the degree of association between
how students evaluate the course and how students evaluate the teacher. Additionally it is possible to reveal
the structure of this association. Student evaluations data is characterized by high correlations between the
variables within each set of variables, therefore two modifications of the CCA method; regularized CCA and
sparse CCA, together with classical CCA were applied to find the most interpretable model. Both methods
give results with increased interpretability over traditional CCA on the present student evaluation data. The
method shows robustness when evaluations over several years are examined.
1 INTRODUCTION
Teacher evaluations and overall course quality evalu-
ations are widely used in higher education. Students
usually submit their feedback about the teacher and
the course anonymously at the end of the course. The
results are usually employed to improve the courses
for future students and to improve the instructor’s ef-
fectiveness.
The research on student evaluations is important
to make improvements in course construction and
teaching methods. Student evaluation of teaching
(SET) is a very well documented and studied tool. An
overview of research on student ratings of instruction
by Marsh (2007) demonstrates that student ratings
are multidimensional, quite reliable, reasonably valid,
and a useful tool for students, faculty and university
administrators. The author also states that SETs pri-
marily are a function of the instructor who teaches a
course rather than the course that is taught.
Several studies on SET data investigate the rela-
tionship between student ratings and student achieve-
ments (Cohen, 1981; Feldman, 1989; Abrami et al.,
1997). The main conclusion is that a student’s
achievement is correlated with a student’s evaluation
of the teacher and the course. Other issues, that are
often discussed are relationships between the SET
scores and various student-specific, course-specific
and instructor-specific characteristics (Marsh, 1987).
This paper analyses the student evaluations from
another angle; by investigating the correlation be-
tween how students evaluate the course and how stu-
dents evaluate the teacher. The objective is to analyze
the degree of association and in this way obtain a dif-
ferent angle on the perspective in Marsh’s paper: that
SETs primarily is a function of the instructor rather
than the course. As a subject we have chosen to study
a single course over time.
2 LITERATURE REVIEW
The most common method used to investigate the cor-
relation amongst two sets of variables is canonical
correlation analysis (CCA), introduced by Hotelling
(1935). CCA can also be used to produce a model
which relates the two sets of variables through linear
combinations. The method has similarities with both
multivariate regression and principal component anal-
ysis.
Application of CCA when variables in the sets are
highly correlated or when the sample size is insuffi-
cient can lead to computational problems, inaccurate
estimates of parameters or non-generalizable results.
One way to deal with these problems is to introduce a
regularization step into the calculations.
The first attempt to introduce the ridge regression
technique, developed by Hoerl and Kennard (1970),
280
Sliusarenko T., H. Clemmensen L. and Kjær Ersbøll B..
How do Student Evaluations of Courses and of Instructors Relate?.
DOI: 10.5220/0004945902800287
In Proceedings of the 6th International Conference on Computer Supported Education (CSEDU-2014), pages 280-287
ISBN: 978-989-758-021-5
Copyright
c
2014 SCITEPRESS (Science and Technology Publications, Lda.)

to the problem of canonical correlation analysis was
proposed by Vinod (1976) and later developed by
Leurgans et al. (1993).
The first development of Sparse CCA, a method
that incorporates variable selection and produces lin-
ear combinations of small subsets of variables, was
presented in Parkhomenko et al. (2007). They pro-
posed an iterative algorithm that uses soft threshold-
ing for feature selection. Waaijenborg et al. (2007)
adapted the elastic net (Zou and Hastie, 2005) to
canonical correlation analysis. Various approaches to
introduce sparsity into the CCA framework were pro-
posed in more recent works by LeCao et al. (2009),
Witten and Tibshirani (2009), Hardoon and Shawe-
Taylor (2011). Sparse CCA solves the problem of in-
terpretability providing sparse sets of associated vari-
ables. These results are expected to be more robust
and generalize better outside the particular study.
3 METHODOLOGY
3.1 Canonical Correlation Analysis
Canonical correlation analysis (CCA) was used to in-
vestigate the degree of association between the evalu-
ation of the teacher and the evaluation of the course.
CCA finds linear combinations of variables with the
highest correlation between two sets of variables.
The method considers two matrices X and Y of
order n × p and n × q respectively. The columns of
X and Y correspond to variables and the rows corre-
spond to experimental units. Classical CCA assumes
p ≤ n and q ≤ n. The main idea behind CCA is to find
canonical variables in the form of two linear combi-
nations:
w
1
= a
11
x
1
+ a
21
x
2
+ ... + a
p1
x
p
v
1
= b
11
y
1
+ b
21
y
2
+ ... + b
q1
y
q
(1)
such that the coefficients a
i1
and b
i1
maximize the
correlation between two canonical variables w
1
, and
v
1
. In other words, the problem consists in solving
R
1
= corr (v
1
, w
1
) = max
a,b
corr
a
T
X, b
T
Y
(2)
This maximal correlation between the two canon-
ical variables v
1
and w
1
that are sometimes called
canonical variates, is called the first canonical corre-
lation. The coefficients of the linear combinations are
called canonical coefficients or canonical weights.
The method continues by finding a second set of
canonical variables, uncorrelated with the first pair
that has maximal correlation. Wilks’s lambda is used
to test the significance of the canonical correlations.
Figure 1 illustrates the variable relationships in
a hypothetical CCA. To answer the question ”which
variables are contributing to the relationship between
the two sets?” the standardized canonical weights
(i.e. coefficients used in linear equations that com-
bine observed variables into latent canonical variable)
and structure coefficients, also called canonical fac-
tor loadings, (i.e. correlations between observed vari-
ables and latent canonical variables) for the first sig-
nificant canonical dimensions should be investigated.
Figure 1: Visualization of CCA results.
Canonical correlation analysis helps to identify
the major association between evaluation of the
course and evaluations of the teacher. To perform
classical CCA the R package CCA, developed by De-
jean and Gonzalez (2009) was used. The package is
freely available from the Comprehensive R Archive
Network (CRAN) at www.r-project.org
3.2 Regularized Canonical Correlation
Analysis
CCA cannot be performed when the variables
x
1
, x
2
, ..., x
p
and/or y
1
, y
2
, ..., y
q
are highly correlated.
In this case the correlation matrices, that are used in
the computational process, tend to be ill-conditioned
and their inverses unreliable. To deal with this prob-
lem a regularization step can be included in the calcu-
lations.
In CCA the regularization is achieved by adding
a corresponding identity matrix multiplied by a regu-
larization parameter to the correlation matrices.
Σ
XX
(λ
a
2
) = Σ
XX
+ λ
a
2
I
p
Σ
YY
(λ
b
2
) = Σ
YY
+ λ
b
2
I
q
(3)
As the result the matrices become non-singular
and a unique solution can be achieved. In order to
choose ”good” values of regularization parameters λ
a
2
and λ
b
2
, the k-fold cross-validation procedure can be
used (Gonz
´
alez et al., 2009).
HowdoStudentEvaluationsofCoursesandofInstructorsRelate?
281

3.3 Sparse Canonical Correlation
Analysis
Sparse CCA (SCCA) is an extension of CCA that per-
forms a selection of variables jointly with the analysis
of the two data sets. SCCA can also help to solve the
problem of interpretability providing sparse sets of as-
sociated variables by setting the canonical correlation
weights to zero.
As was mentioned above, CCA finds the vectors
a and b, that maximizes corr(a
T
X, b
T
Y ). The way
to obtain penalized canonical variates is to impose
L
1
penalties on vectors a and b. So the optimization
problem can be written as:
max
a,b
a
T
X
T
Y b
s.t.
k
a
k
2
2
≤ 1,
k
b
k
2
2
≤ 1,
k
a
k
1
≤ λ
a
1
,
k
b
k
1
≤ λ
b
1
(4)
This problem can be solved using the penalized
matrix decomposition (PMA) approach, proposed by
Witten et al. (2009). When λ
a
1
and λ
b
1
are small,
some elements of a and b will be exactly zero. The
algorithm yields sparse vectors a and b that maximize
cor(X a, Y b). Values of regularization parameters λ
a
1
and λ
b
1
can be chosen using cross-validation.
To perform sparse CCA, the R package ”PMA”
(Witten et al., 2013) was used. The package also con-
tains a function that helps to select tuning parameters
by using cross validation.
4 DATA DESCRIPTION
Students at the Technical University of Denmark reg-
ularly evaluate courses by filling in web-forms a week
before the final week of the course. The evalua-
tions are intended to be a tool for quality assurance
for: teachers, the department educational boards, and
the department and university managements. On-line
course evaluation at the university consists of three
forms: Form A contains specific quantitative ques-
tions about the course, Form B contains specific quan-
titative questions about the teacher and Form C gives
students an opportunity to write their qualitative feed-
back. This particular analysis is based on investiga-
tion of the relationship between answers in Form A
and Form B.
A.1.1 (Learning a lot): I think I am learning a lot in
this course.
A.1.2 (TM activates): I think the teaching method
encourages my active participation.
A.1.3 (Material): I think the teaching material is
good.
A.1.4 (Feedback): I think that throughout the course,
the teacher has clearly communicated to me where
I stand academically.
A.1.5 (TA continuity): I think the teacher creates
good continuity between the different teaching ac-
tivities.
A.1.6 (Workload): 5 points is equivalent to 9 hours
per week. I think my performance during the
course is.
A.1.7 (Prerequisites): I think the course descrip-
tion’s prerequisites are.
A.1.8 (General): In general, I think this is a good
course.
B.1.1 (Good grasp): I think that the teacher gives
me a good grasp of the academic content of the
course.
B.1.2 (Communication): I think the teacher is good
at communicating the subject.
B.1.3 (Motivate activity): I think the teacher moti-
vates us to actively follow the class.
B.2.1 (Instructions): I think that I generally un-
derstand what I am to do in our practical as-
signments/lab courses/group computation/group
work/project work.
B.2.2 (Understanding): I think the teacher is good at
helping me understand the academic content.
B.2.3 (Feedback): I think the teacher gives me useful
feedback on my work.
The students rate the questions on a 5 point Likert
scale (1932) from 5 to 1, where 5 corresponds to the
student strongly agreeing with the underlying state-
ment and 1 corresponds to the student strongly dis-
agreeing with the statement. For questions A.1.6 and
A.1.7, a 5 corresponds to too high and 1 to too low.
In a sense for these two questions a 3 corresponds to
satisfactory and anything else (higher or lower) corre-
sponds to less satisfactory.
It is common practice to only include the first 3
questions for the teacher evaluation (B.1.1-B.1.3) for
large courses. In such cases, the second part of the
form B (questions B.2.1-B.2.3) is active for the teach-
ing assistants only. Here, we examine one course ”In-
troductory Programming with Matlab”. The course is
one of the largest courses at the university where all
6 questions from the teacher evaluation (Form B) are
usually active.
The Introductory Programming with Matlab
course is available 4 times per year: twice as a 13-
week course (fall and spring semesters) and twice as
an intensive 3-week course (January and June). The
numbers of students that follow the course are very
different from semester to semester. Here we will fo-
cus on the intensive 3-week version of the course.
June courses are more popular (approximately 300
CSEDU2014-6thInternationalConferenceonComputerSupportedEducation
282
students) than the January courses (around 100-150
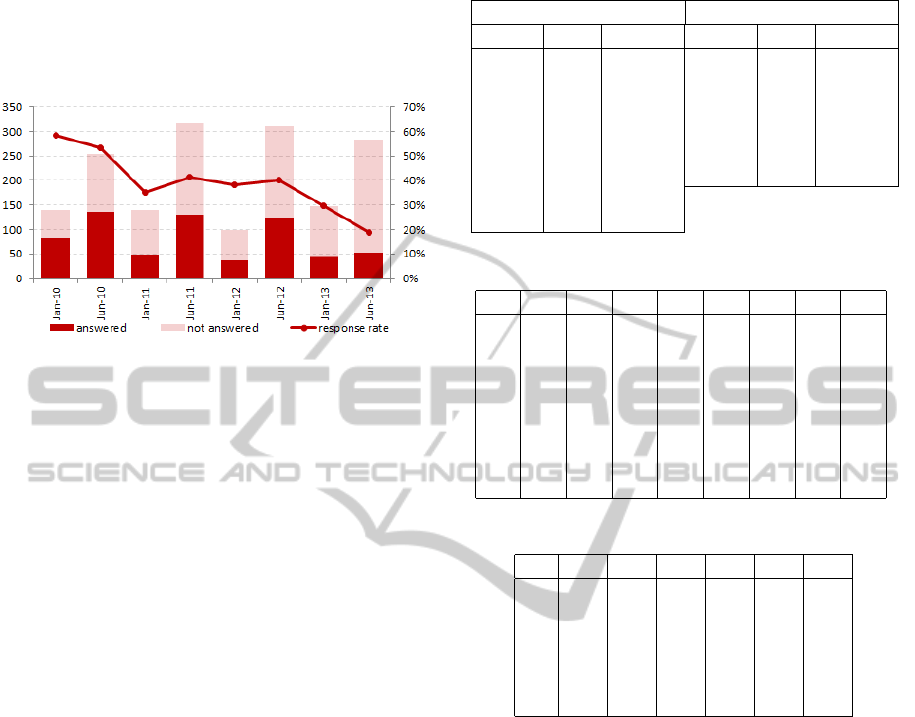
students). Figure 2 shows the number of students reg-
istered for the course and the course evaluation re-
sponse rate over the period from January 2010 to June
2013.
Figure 2: Number of course participants and evaluation re-
sponse rate from January 2010 to June 2013.
For the comparison of methods we use results
from one semester (January 2010), and for the robust-
ness study we examine the same course at two other
time points (June 2011 and June 2012). It should be
noted, that students who participate in the course have
very different backgrounds. Students at the univer-
sity are obligated to take one programming course.
Therefore the ”Introductory Programming with Mat-
lab” is a quite popular course among students on non-
programming study-lines.
5 RESULTS
This section first presents a summary of the data, sec-
ondly the results of three versions of the canonical
correlation analysis performed on the same data. Fi-
nally, the results of the robustness study are presented.
5.1 Evidence from the Data
The data set under investigation consists of 69 ob-
servations from the ”Introductory Programming with
Matlab” course held in January 2010. The course is
one of the largest courses at the university, where the
teacher is evaluated using all 6 questions from form
B. Table 1 presents means and standard deviations of
the answers from the responders. On average students
gave rates below 3 to both the teacher and the course.
Question A.1.2 (I think the teaching method en-
courages my active participation) got the lowest aver-
age grade among course-related questions and ques-
tion B.2.1 (I think that I generally understand what I
am to do in our practical assignments) got the lowest
average grade among teacher-related questions.
Table 1: Variable Mean and Standard Deviation.
Evaluation of the course Evaluation of the teacher
Question Mean St. Dev. Question Mean St. Dev.
A.1.1 2.46 1.16 B.1.1 2.57 1.10
A.1.2 2.11 1.09 B.1.2 2.80 1.30
A.1.3 2.62 1.18 B.1.3 3.01 1.29
A.1.4 2.43 0.98 B.2.1 2.22 1.08
A.1.5 2.58 1.03 B.2.2 2.50 1.11
A.1.6 2.67 0.83 B.2.3 2.42 1.05
A.1.7 3.06 0.45
A.1.8 2.36 1.06
Table 2: Correlations among the Form A variables.
A.1.1A.1.2A.1.3A.1.4A.1.5A.1.6A.1.7A.1.8
A.1.11.00
A.1.20.72 1.00
A.1.30.57 0.48 1.00
A.1.40.34 0.24 0.44 1.00
A.1.50.55 0.54 0.53 0.45 1.00
A.1.6-0.34 -0.21 -0.11 0.07 -0.16 1.00
A.1.70.01 0.19 0.21 0.24 0.15 0.29 1.00
A.1.80.83 0.77 0.61 0.37 0.56 -0.24 0.08 1.00
Table 3: Correlations among the Form B variables.
B.1.1 B.1.2 B.1.3 B.2.1 B.2.2 B.2.3
B.1.1 1.00
B.1.2 0.81 1.00
B.1.3 0.81 0.85 1.00
B.2.1 0.47 0.49 0.43 1.00
B.2.2 0.78 0.74 0.77 0.58 1.00
B.2.3 0.64 0.57 0.67 0.55 0.78 1.00
Table 2 and Table 3 present the correlations be-
tween the variables from Form A and Form B. The
correlations appear to be quite high especially within
Form B. This can lead to uninterpretable results of
classical CCA.
Figure 3 presents the average SET scores of the
evaluation of the course (Form A) starting from Jan-
uary 2010 until June 2013.
There were some changes to the course during the
period. In June 2010 the course was run by a new
teacher, who introduced a new textbook, which seems
much better than the Matlab notes used before as the
course material got better feedback after this (A.1.3).
Additionally, the course responsible team continu-
ously works on improvement of the course and on
making it less dependent on teacher and teaching as-
sistants. Overall, there is a tendency of improvement
of SET scores over the period from January 2010 to
June 2013, with exception of the June 2012 semester,
when the course got lower evaluation results.
HowdoStudentEvaluationsofCoursesandofInstructorsRelate?
283
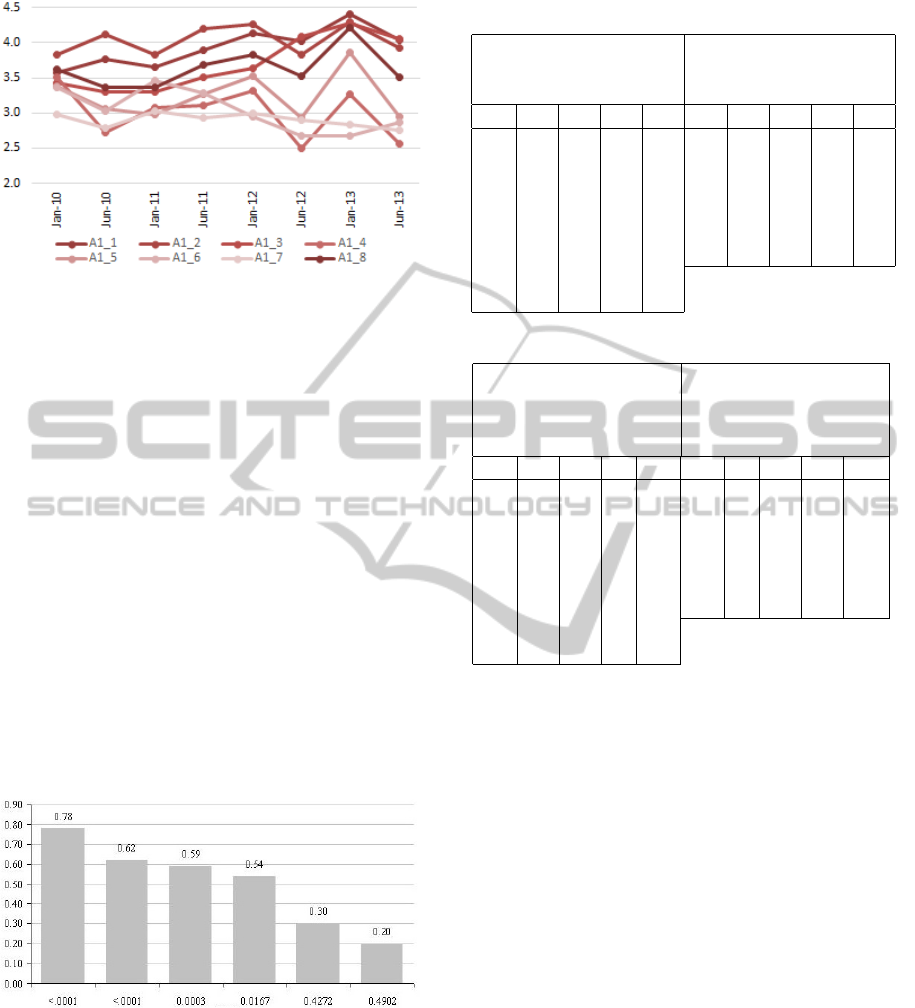
Figure 3: Results of the evaluation of the course from Jan-
uary 2010 to June 2013.
5.2 CCA Results
Figure 4 presents the canonical correlations and
corresponding p-values for the significance test of
each canonical correlation. In general the number of
canonical correlations is equal to the number of vari-
ables in the smallest set. However, the test shows that
only the first 4 canonical correlations are statistically
significant. This means that the structure of the asso-
ciation between course and teacher evaluations lies in
4 dimensions, which is hard to interpret. The values
of canonical correlations give an overall indication of
a strong association between teacher and course eval-
uation.
Table 4 presents the standardized canonical coef-
ficients and table 5 presents the correlations between
the variables and their canonical variates. These coef-
ficients are used to find the structure of the canonical
correlations.
Figure 4: Canonical correlations and corresponding p-
values.
For the first canonical correlation, questions A.1.5
(continuity between the different teaching activities)
and A.1.8 (overall course quality) from the course re-
lated questions are the most important. Among the
teacher related, question B.1.1 (good grasp of the aca-
demic content) is the most important. However, due
to high correlations between questions within each set
of variables, canonical factor loadings indicate that
Table 4: Standardized canonical coefficients.
Standardized Canoni-
cal Coefficients for the
Form A variables
Standardized Canoni-
cal Coefficients for the
Form B variables
V1 V2 V3 V4 W1 W2 W3 W4
A.1.1-0.03-0.31 0.86 -1.12B.1.1 0.80 -0.86 0.65 -0.77
A.1.2-0.16 0.08 0.33 0.34 B.1.2 0.28 1.37 -0.33 0.75
A.1.3 0.34 0.90 -0.12-0.70B.1.3 0.18 -0.25-1.19-0.28
A.1.4-0.10-0.50 0.78 0.06 B.2.1-0.03 0.68 0.61 -0.08
A.1.5 0.60 -0.67-0.54 0.26 B.2.2-0.17-0.25 0.59 -0.72
A.1.6-0.11 0.09 0.35 0.08 B.2.3-0.09-0.48 0.06 1.55
A.1.7-0.12 0.39 0.16 0.39
A.1.8 0.42 0.38 -0.55 1.17
Table 5: Canonical structure.
Correlations between
the Form A variables
and their canonical
variables
Correlations between
the Form B variables
and their canonical
variables
V1 V2 V3 V4 W1 W2 W3 W4
A.1.1 0.73 0.01 0.42-0.16B.1.10.97-0.14 0.20 0.01
A.1.2 0.60 0.15 0.33 0.31 B.1.20.89 0.33 -0.06 0.20
A.1.3 0.76 0.49 0.24-0.23B.1.30.87 0.00 -0.21 0.21
A.1.4 0.38 -0.240.71 0.11 B.2.10.42 0.43 0.62 0.24
A.1.5 0.87 -0.280.05 0.19 B.2.20.71-0.07 0.35 0.20
A.1.6-0.35 0.17 0.32 0.25 B.2.30.56-0.24 0.29 0.69
A.1.7-0.02 0.43 0.37 0.48
A.1.8 0.79 0.18 0.26 0.25
the questions: A.1.1, A.1.2, A.1.3 from Form A and
questions: B.1.2, B.1.3, B.2.2, B.2.3 from Form B are
also important for the first canonical correlation. The
structures of the other 3 canonical correlations can be
found by similar analyses of the corresponding coef-
ficients.
The square root of the first canonical correlation
shows the proportion of the variance in the first canon-
ical variate of one set of variables explained by the
first canonical variate of the other set of variables. For
the first canonical varite the proportion of explained
variance is 61%.
The canonical redundancy analysis shows that
neither of the first pair of canonical variables is a
good overall predictor of the opposite set of variables,
the proportions of variance explained being 0.24 and
0.35 for evaluation of the course and evaluation of the
teacher respectively.
A four-dimensional structure of association be-
tween student evaluation of the course and student
evaluation of the instructor can be a signal of data
over-fitting due to an insufficient sample size. An-
other problem is that correlations between the vari-
ables within Form A and Form B are quite high.
CSEDU2014-6thInternationalConferenceonComputerSupportedEducation
284
Therefore, the CCA results are hard to interpret.
Dimension reduction methods such as regularized
and sparse versions of canonical correlation analysis
should be used to obtain easier interpretable results.
5.3 Regularized CCA Results
The regularization was achieved by adding to the
correlation matrices a corresponding identity ma-
trix multiplied by a regularization parameter as de-
scribed in the methods section. The cross-validation
procedure was used to find the optimal regulariza-
tion parameters. Only the first canonical correlation,
equal to 0.70, appeared to be statistically significant
(p − value = 0.025). Thus, this canonical correla-
tion structure has only one dimension, compared to
the four-dimensional result of classical CCA. This re-
sults in a simpler and more generalizable model of
the association between evaluation of the course and
evaluation of the teacher.
The interpretation of the results of regularized
canonical correlation analysis is similar to the inter-
pretation of the results of classical CCA. To inves-
tigate the structure of the canonical correlation, the
standardized canonical coefficients and the structure
canonical coefficients (canonical factor loadings and
canonical factor cross-ladings) reported in Table 6
should be analyzed.
Table 6: Canonical weights and structure coefficients.
Evaluation of the course Evaluation of the teacher
(1) (2) (3) (1) (2) (3)
A.1.1 -0.08 -0.81 -0.57 B.1.1 -0.53 -0.96 -0.75
A.1.2 -0.03 -0.72 -0.51 B.1.2 -0.33 -0.93 -0.69
A.1.3 -0.33 -0.82 -0.62 B.1.3 -0.10 -0.88 -0.63
A.1.4 -0.03 -0.49 -0.34 B.2.1 -0,11 -0.58 -0.42
A.1.5 -0.38 -0.83 -0.65 B.2.2 -0.03 -0.82 -0.58
A.1.6 0.05 0.28 0.21 B.2.3 -0.03 -0.66 -0.46
A.1.7 0.03 -0.12 0.05
A.1.8 -0.29 -0.85 0.65
(1) - Standardized canonical weights; (2) - Canoni-
cal factor loadings; (3) - Canonical cross - loadings.
The analysis of the standardized canonical
weights shows that questions A.1.3 (teaching mate-
rial is good), in addition to A.1.5 and A.1.8 seen in the
classical CCA, from the course related questions are
the most important variables. Among the teacher re-
lated questions, B.1.1 (teacher gives me a good grasp
of the academic content) and B.1.2 (teacher is good at
communicating the subject) are the most important.
An analysis of the canonical factor loadings and the
cross-loadings shows that A.1.1 and A.1.2 from Form
A and questions B.1.3 and B.2.2 from Form B also
contribute to the canonical correlation.
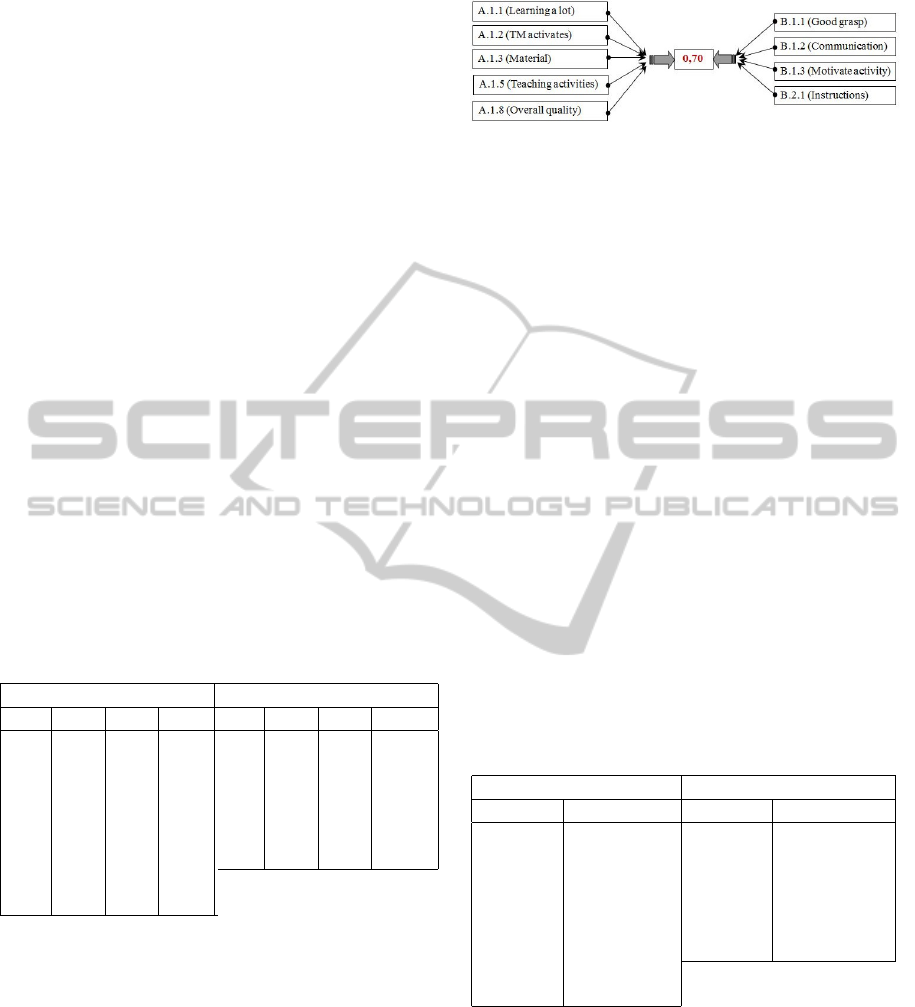
Figure 5: RCCA: Questions that contribute to canonical
correlation.
Figure 5 presents the variables from Form A and
Form B that contribute to the latent canonical vari-
ables.
An overall conclusion that can be made is that the
correlation of 0.70 in the ”Introductory Programming
with Matlab” course is mainly due to the relationship
between the content of the course, the teaching meth-
ods, the continuity between teaching activities in the
course, the teaching material and the overall quality
of the course from one side and the teachers ability
to give a good grasp of the academic content of the
course, the teachers ability to motivate the students,
the teachers communication about the subject and the
understanding of practical assignments on the other
side.
5.4 Sparse CCA Results
The first canonical correlation of the sparse CCA was
found to be equal to 0.75, which is the correlation be-
tween a linear combination of 4 variables from Form
A and a linear combination of 3 variables from Form
B. Table 7 presents the coefficients that correspond
to these linear combinations.
Table 7: Sparse canonical coefficients.
Evaluation of the course Evaluation of the teacher
question coef. question coef.
A.1.1 -0.08 B.1.1 -0.94
A.1.2 0 B.1.2 -0.32
A.1.3 -0.17 B.1.3 -0.14
A.1.4 0 B.2.1 0
A.1.5 -0.83 B.2.2 0
A.1.6 0 B.2.3 0
A.1.7 0
A.1.8 -0.53
From Form A, the questions: A.1.1, A.1.3, A.1.5
and A.1.8 contribute to the course related latent
canonical variable while from Form B, the questions:
B.1.1, B.1.2 and B.1.3 contribute to the teacher re-
lated latent canonical variable. This model is also
simpler than the one obtained from classical CCA.
Furthermore, it also involves less variables than the
model obtained from the regularized version of CCA
(it does not contain questions A.1.2, A.1.4, A.1.6,
A.1.7, B.2.1, B.2.2, and B.2.3).
HowdoStudentEvaluationsofCoursesandofInstructorsRelate?
285
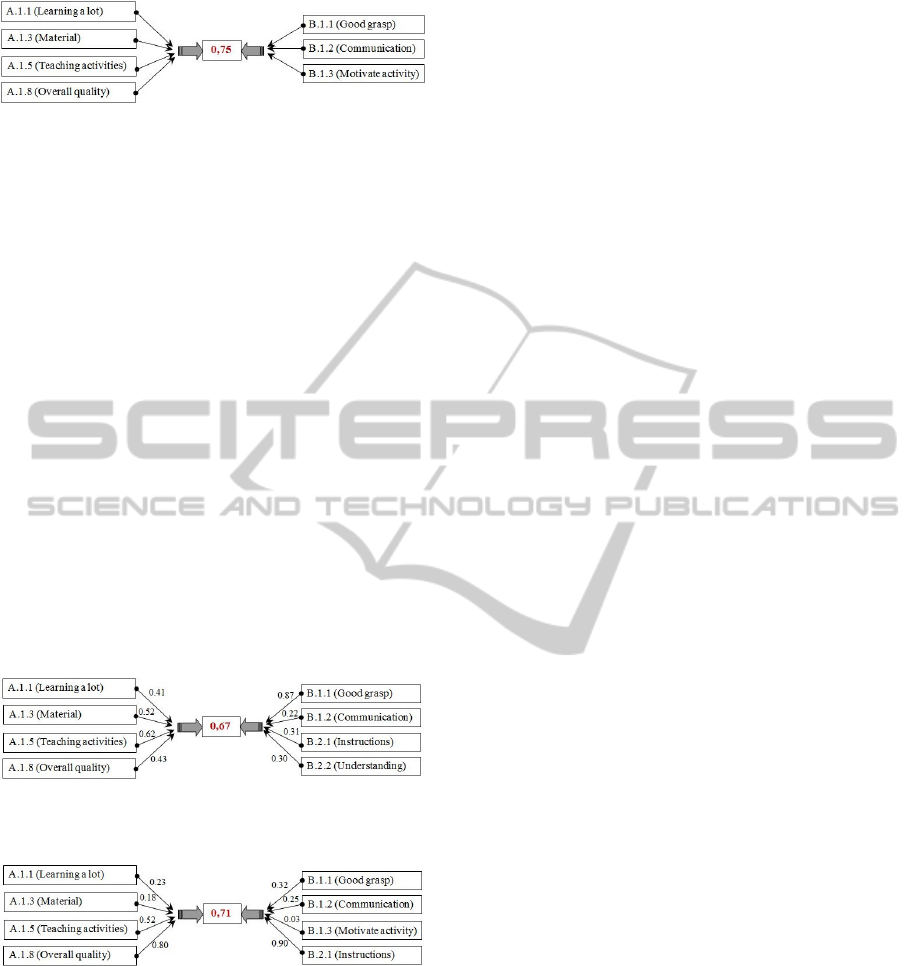
Figure 6: SCCA: Questions that contribute to canonical cor-
relation.
Figure 6 presents the variables from Form A and
Form B that contribute to the latent canonical vari-
ables. The conclusion is that the canonical correla-
tion of 0.75 in the ”Introductory Programming with
Matlab” course is mainly due to the relationship be-
tween the good continuity between teaching activities
in the course, content of the course, teaching material
and overall quality of the course from one side and
teachers ability to give a good grasp of the academic
content of the course, teachers ability to motivate the
students and teachers good communication about the
subject on the other side.
5.5 Stability of the Results
To check for the stability of the correlation structures,
subsequent years of the course should be analyzed.
Figure 7 and figure 8 present the canonical correlation
structures for the association between evaluation of
the course and evaluation of the teacher in June 2011
and June 2012, respectively.
Figure 7: The structure of canonical correlation between the
two parts of course evaluation in June 2011.
Figure 8: The structure of canonical correlation between the
two parts of course evaluation in June 2012.
Overall, the two structures are similar. The only
difference was on the evaluation of the teacher, where
question B.2.2 (teacher’s help to understand the aca-
demic content) form the structure in 2011, while B.1.3
(The teacher motivates us to actively follow the class)
was in the canonical correlation structure for 2012.
Figures also show the weights, each variable had in
the latent canonical variable. The weights were dif-
ferent in the two years. However the changes in the
canonical correlation structures can be explained by
the fact that the main teachers of the course for all
three semesters (January 2010, June 2011 and June
2012) were different.
6 DISCUSSION
The study have found that association between how
students evaluate the course and how they evaluate the
teacher of the course is strong (correlation is around
70 %), and the structure of this association is rela-
tively stable over time. The square root of the first
canonical correlation shows the proportion of the vari-
ance in the first canonical variate of one set of vari-
ables explained by the first canonical variate of the
other set of variables (around 50%).
Having this strong relationship, better courses and
therefore better SET results can be achieved in several
different ways: improvement in a course can lead to
better evaluation of teacher, and improvement of the
teacher qualities, can lead to better evaluation of the
course. However, Marsh (2007) indicated that stu-
dents primarily evaluate the teacher rather than the
course. But there is still some 30% left of this di-
mension, and there are the orthogonal dimensions as
well.
The canonical redundancy analysis for the tradi-
tional CCA shows that neither of the first pair of
canonical variables is a good overall predictor of the
opposite set of variables, the proportions of vari-
ance explained being 0.24 and 0.35 for evaluation of
the course and evaluation of the teacher respectively.
There is no guarantee that what students answer on
the course evaluation is not a function of the teacher,
but the students do have some parts of non-correlating
responses for the two parts of evaluation although
there is also a strong association.
In case the structure of association between eval-
uation of the course and evaluation of the teacher is
stable, SET administrators might consider to reduce
the number of questions in the questionnaire in order
to gain better response rates. However, that should
be done very carefully. SETs must be multidimen-
sional, in order to reflect multidimensionality of such
a complex activity as teaching. According to Marsh
and Roche (1997) , the strongest support for the mul-
tidimensionality of SETs is based on the nine fac-
tors: Learning/Value, Instructor Enthusiasm, Organi-
zation/Clarity, Group Interaction, Individual Report,
Breadth of Coverage, Examinations/Grading, Assign-
ments/Readings, and Workload/Difficulty. The ques-
tionnaire, currently used at DTU is already small, but
an analysis similar to this could be used by other ed-
ucational institutions.
CSEDU2014-6thInternationalConferenceonComputerSupportedEducation
286

7 CONCLUSIONS
This study analyzed the association between how stu-
dents evaluate a course and how students evaluate a
teacher using canonical correlation analysis (CCA).
Data from student evaluations is characterized by high
correlations between the variables within each set of
variables, therefore two modifications of the CCA
method; regularized CCA and sparse CCA, together
with classical CCA were applied to find the most
interpretable model of association between the two
evaluations.
The association between how students evaluate
the course and how students evaluate the teacher was
found to be quite strong in all three cases. How-
ever, applications of regularized and sparse CCA to
the present student evaluation data give results with
increased interpretability over traditional CCA.
The simplest model was obtained from sparse
canonical correlation analysis, where an association
between how students evaluate the course and how
students evaluate the teacher was found to be due to
the relationship between the good continuity between
teaching activities in the course, the content of the
course, the teaching material, and the overall qual-
ity of the course from the course side; and teachers
ability to give a good grasp of the academic content
of the course, the teachers ability to motivate the stu-
dents and the teachers good communication about the
subject on the teacher side.
Analysis of subsequent evaluations of the same
course showed that the association between how stu-
dents rate the teacher and the course was found to be
subject to subtle changes with the change of teach-
ing methods and with the change of instructor. These
changes in the correlation structure were seen on the
instructor side and not on the course side.
REFERENCES
Abrami, P. C., d’Apollonia, S., and Rosenfield, S. (1997).
The dimensionality of student ratings of instruction:
what we know and what we do not. Perry, R.P., Smart
J.C., editors: effective teaching in higher education:
research and practice. New York: Agathon Press.
Cohen, P. A. (1981). Student rating of instruction and stu-
dent achievement. Review of Educational Research,
51(3):281–309.
D
´
ejean, S. and Gonz
´
alez, I. (2009). Package ”CCA: Canon-
ical correlation analysis”. CRAN.
Feldman, K. A. (1989). The association between student
ratings of specific instructional dimensions and stu-
dent achievement: Refining and extending the syn-
thesis of data from multisection validity studies. Re-
search in Higher education, 30(6).
Gonz
´
alez, I., D
´
ejean, S., Martin, P. G. P., and Baccini,
A. (2009). Highlighting relationships between het-
erogeneous biological data through graphical displays
based on regularized canonical correlation analysis.
Journal of Biological Systems, 17(2):173–199.
Hardoon, D. R. and Shawe-Taylor, J. (2011). Sparse
canonical correlation analysis. Machine Learning,
83(3):331–353.
Hoerl, A. and R.W., K. (1970). Ridge regression: Biased es-
timation for nonorthogonal problems. Technometrics,
12:55–67.
Hotelling, H. (1935). The most predictable criterion. Jour-
nal of Educational Psychology, 26:139–142.
Le Cao, K.-A., Martin, P. G. P., Christele, R., and Besse,
P. (2009). Sparse canonical methods for biological
data integration: application to a cross-platform study.
BMC Bioinformatics, 10:Article 34.
Leurgans, S., Moyeed, R., and Silverman, B. (1993).
Canonical correlation analysis when the data are
curves. Journal of the Royal Statistical Society B,
55(3):725–740.
Likert, R. (1932). A technique for the measurement of atti-
tudes. Archives of Psychology, 140:155.
Marsh, H. W. (1987). Students’ evaluations of university
teaching: Research findings, methodological issues,
and directions for future research. International Jour-
nal of Educational Research, 11(3):253 – 388.
Marsh, H. W. (2007). Students evaluations of university
teaching: Dimensionality, reliability, validity, poten-
tial biases and usefulness. R.P. Perry and J.C. Smart
(eds.), The Scholarship of Teaching and Learning in
Higher Education: An Evidence-Based Perspective,
pages 319 –383.
Marsh, H. W. and Roche, L. A. (1997). Making students’
evaluations of teaching effectiveness effective: The
critical issues of validity, bias, and utility. American
Psychologist, 52(11):1187.
Parkhomenko, E., Tritchler, D., and Beyene, J. (2007).
Genome-wide sparse canonical correlation of gene ex-
pression with genotypes. BMC Proceedings, 1.
Vinod, H. D. (1976). Canonical ridge and econometrics of
joint production. Journal of Econometrics, 4(2):147–
166.
Waaijenborg, S. and Zwinderman, A. (2007). Penalized
canonical correlation analysis to quantify the associa-
tion between gene expression and dna markers. BMC
Proceedings, 1(Suppl 1):S122.
Witten, D. M., Tibshirani, R., and Gross, S. (2013). Package
”PMA”: Penalized multivariate analysis.
Witten, D. M., Tibshirani, R., and Hastie, T. (2009). A
penalized matrix decomposition, with applications to
sparse principal components and canonical correlation
analysis. Biostat, 10(3):515–534.
Zou, H. and Hastie, T. (2005). Regularization and variable
selection via the elastic net. Journal of the Royal Sta-
tistical Society, Series B, 67:301320.
HowdoStudentEvaluationsofCoursesandofInstructorsRelate?
287
