
Development and Practical Application of a Relationship
Diagram-creation Tool Centering on Automatic Creation
Functionality
Norio Ishii
1
, Yuri Suzuki
2
and Saori Sakuma
3
1
Aichi Kiwami College of Nursing, 5-4-1 Jogan-dori, Ichinomiya, Aichi, Japan
2
College of Engineering, Chubu University, 1200 Matsumoto-cho, Kasugai, Aichi, Japan
3
School of Nursing, Seirei Christopher University, 3453 Mikatahara-cho, Kita-ku, Hamamatsu, Shizuoka, Japan
Keywords: Nursing Education, Learning Support Tool, Relationship Diagram, Automatic Creation.
Abstract: In nursing education, learning the effects of relationship diagrams drawn by students is useful in
understanding patients and the entire nursing process. However, drawing these diagrams is time consuming,
and the diagram creation process is strenuous for students. In this study, we have developed a relationship-
diagram creation tool that further reduces the difficulty of node organization. In particular, we have
developed a tool that implements an automatic drawing function in which the tool, rather than the student,
organizes information in the diagram. We conducted lectures on methods to use the tool at a nursing college
as well as a questionnaire survey to evaluate its efficacy. On the basis of these results, we confirmed the
improvements in the tool’s usability and efficacy.
1 INTRODUCTION
The creation of relationship diagrams is important in
the nursing process. Relationship diagrams are
“concept maps” or “concept networks” that logically
use arrows to depict the causes of illness, organic
changes, functional changes, symptoms, and
decreasing lifestyle activity to understand a patient.
Relationship diagrams are used in basic nursing
education to organize and integrate related
information and present an overall image of a
patient. They are important in determining the
course the nursing process takes (Akinsanya and
Williams, 2004; Hsu and Hsieh, 2005).
Earlier research has reported the use of
relationship diagrams in nursing education to
reinforce logical thinking and understanding
(Sugisaki and Ogawa, 2006; Yakushijin et al., 2006).
This study has noted that consolidating information
improves learning and critical thinking abilities.
However, it has been pointed out that the placement
of nodes and lines in relationship diagrams make
them difficult to draw and revise (Sugisaki and
Ogawa, 2006). This suggests that, for students, the
creation of relationship diagrams is a complex and
difficult activity that requires an understanding of
the patient, an ability to follow the nursing process,
and critical thinking capabilities.
As the earlier study suggested, creating
relationship diagrams has merits, such as (1)
promoting understanding of the patient as a whole
and (2) improving logical and critical thinking
capabilities. The current study focuses on (1) and
aims to construct a learning environment for
beginners to support the understanding of the patient
as a whole.
Earlier studies tested a number of methods to
increase the effectiveness of relationship diagrams
as a learning tool, as described in (1), by avoiding
confusing the students with detailed rules, including
giving students rules for drawing diagrams that
distinguish between actual and potential conditions
and depicting different elements of information with
different colors (All and Havens, 1997; Schuster,
2002; Toyoshima et al., 2005). These practical
studies can be seen as a research approach that
supports students by proposing effective rules for
drawing relationship diagrams, which have not had
clear and established drawing rules.
In contrast, the authors have performed research
based on the development of a learning support tool
for creating relationship diagrams and constructing a
394
Ishii N., Suzuki Y. and Sakuma S..
Development and Practical Application of a Relationship Diagram-creation Tool Centering on Automatic Creation Functionality.
DOI: 10.5220/0004944903940401
In Proceedings of the 6th International Conference on Computer Supported Education (CSEDU-2014), pages 394-401
ISBN: 978-989-758-021-5
Copyright
c
2014 SCITEPRESS (Science and Technology Publications, Lda.)
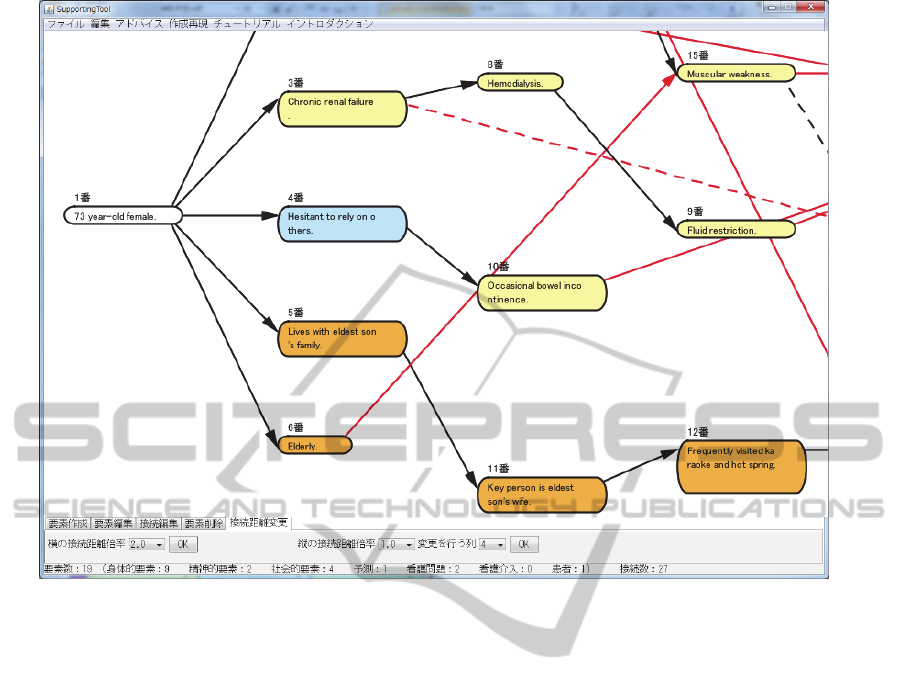
Figure 1: Relationship-diagram creation tool.
learning environment that reduces the previously
mentioned student difficulties. In previous research,
we developed a computer-based tool for simple
creation of relationship diagrams using Microsoft
Excel VBA and introduced this program into the
classroom in an attempt to reduce the burden of
diagram creation (Ishii and Sakuma, 2011). Using
this tool allowed students to easily create and
organize relationship diagram nodes and links. In
practical use, the tool received positive evaluations
from students in terms of creating and editing
diagrams. However, no difference was seen in the
amount of time required to create a diagram with the
tool and the time to create a diagram by hand. We
inferred that this was because the time spent by
students on editing tool-generated diagrams was
greater than that spent on hand-drawn diagrams
since the tool allowed students to easily rearrange
nodes.
In this study, we have developed a relationship
diagram-creation tool that further reduces the burden
of node organization. Specifically, we developed a
tool that implements an automatic drawing function
in which the tool rather than the student organizes
information in a diagram. We then deployed this
program in a classroom. In addition, we made
improvements to the tool based on student
evaluations, and we investigated the effects of the
improvements by introducing the program in the
classroom once again during the following academic
year.
2 A RELATIONSHIP
DIAGRAM-CREATION TOOL
2.1 Development Environment
We developed the tool in the Java development
language under the Windows operating system.
During development, we used three libraries:
Processing, which is specialized for graphics
functions; Apache POI, which reads and writes files
in formats for Microsoft applications such as Excel
and Word; and JFreeChart, which allows creation
graphs from Java applications.
2.2 Tool Functions
In this study, we developed a relationship diagram-
creation tool with three functions: an automatic
drawing function, a creation process replay function,
and an evaluation support function (Figure 1).
DevelopmentandPracticalApplicationofaRelationshipDiagram-creationToolCenteringonAutomaticCreation
Functionality
395

2.2.1 Automatic Drawing Function
The tool automatically creates diagrams based on
information entered by the student. We call this the
automatic drawing function. The diagrams are
composed of nodes and links, and nodes are
hierarchically organized from left to right.
Relationship diagrams are generally composed in a
radial shape; however, based on interviews with
nursing instructors, we have adopted a hierarchical
composition, which was assessed as easy to read.
To create a node, the user selects the “create
element” tab from the lower part of the tool. After
inputting the target information for the new element,
the user selects element properties and connecting
element numbers (a node number pointing to a
higher level in the hierarchy) from the menu. This
automatically creates a new node in a color based on
its properties and places the node in the diagram.
The node is also automatically assigned a number in
order of creation. There are six element properties:
(1) physical attributes (height, weight, ailments,
etc.), (2) social background elements (family
composition, household environment, etc.), (3)
psychological state elements (mental state, mental
issues, etc.), (4) expectations (future expectations
regarding the patient), (5) nursing obstacles (critical
issues concerning nursing), and (6) nursing
intervention (nursing activity for the subject patient).
To edit node information, the user selects the
“edit element” tab, and then selects the number of
the node they wish to edit from the pulldown menu.
Current information is shown in the content field of
the element. Current information can be edited.
When the OK button is pressed, these changes are
reflected in the diagram. Nodes can be deleted by
selecting the “delete node” tab and selecting the
number of the node to be deleted from the pulldown
menu. However, to preserve links, only nodes with
no lower level nodes can be deleted.
Links between nodes are automatically
generated, and normal links are indicated by solid
arrows. Prediction links are indicated by dotted
arrows. To add a link between nodes, the user
chooses the “edit connections” tab and enters edit
mode to select the number of nodes to be connected
from the pulldown menu. The added link is shown
with a red arrow. To delete a node, after selecting
deletion mode, the user must then choose the
number of the node to be deleted in a similar
fashion.
Finally, as nodes and links are created
automatically, the student cannot change their
placement; however, by selecting the “change
connection distance” tab, the users can adjust the
spacing between nodes.
2.2.2 Creation Process Replay Function
The tool automatically logs the creation process of
the relationship diagram and can recreate this
process step by step after creation. This is called the
creation process replay function. The creation
process replay includes the deletion as well as
addition of elements and connections. This function
allows students and instructors to confirm a
student’s creation process.
2.2.3 Evaluation Support Function
After the creation of a relationship diagram, this tool
can display an evaluation sheet that shows the
number of links and nodes of each type in a table as
well as the proportion of nodes of each type as a
graph. This is called the evaluation support function.
Evaluation sheets are output in a Microsoft Excel-
compatible format.
3 INTRODUCING THE TOOL
IN THE CLASSROOM
3.1 Course and Object of Study
In this study, we introduced the developed
relationship diagram-creation tool into a classroom.
The target course was “The Nursing Process,” a first
year open lecture at a short-term nursing school. One
of the course’s fifteen total classes focuses on the
creation of relationship diagrams. There were 88
first-year short-term nursing college (school of
nursing) students in the class.
3.2 Class Design
The class content was composed of three steps:
introduction of the tool, creation of relationship
diagrams, and evaluation and improvement of
diagrams.
In the first step, students received a basic
explanation of the fundamentals of the tool.
Specifically, students received an explanation
regarding the creation, revision, and deletion of
nodes as well as the addition of nodes and
adjustment of spacing between nodes. The procedure
for saving files was also explained.
In the second step, students were divided into
groups of two to three and created one full image
CSEDU2014-6thInternationalConferenceonComputerSupportedEducation
396

Table 1: Evaluation items.
relationship diagram based on a given case
(symptoms associated with stroke, physical changes
associated with aging, and the effects of these
symptoms on daily life). Because the students are
beginners at creating diagrams, we distributed a data
file in which one portion related to the illness was
created in advance. Students completed a
relationship diagram by adding information to the
distributed diagram.
In the third step, students used the evaluation
sheet provided by the tool to assess the created
relationship diagram. Students then added
supplementary information and revised incorrect
information. Finally, students reviewed the creation
process using the creation process replay function.
After the diagram creation process finished, students
assessed the tool following the same process used in
earlier research (Ishii and Sakuma, 2011). More
specifically, a system usability scale (Brooke, 1996)
(10 items, 5-rank evaluation) was used to assess
usability. Evaluation items based on points that the
students considered difficult in earlier research were
also used (10 items, 4-rank evaluation) to assess
efficiency. The evaluation items are shown in Table
1.
3.3 Student Evaluation of the Tool
In our evaluation of the tool, we first compared
evaluations received from students in this study with
those obtained in earlier research (Ishii and Sakuma,
2011) regarding the previous relationship diagram
tool. As explained in Section 1, the tool in this
research varied from the previously developed tool
as follows: (1) nodes were automatically created by
entering information but students manually
organized the diagram; (2) similar to nodes, links
were also manually organized by the students; and
(3) the creation process replay functionality and
evaluation support functionality were not
implemented. In addition, creation of the
relationship diagram was performed over two
classes in previous studies, whereas in this study, the
relationship diagram was created in a single class
period.
3.3.1 Usability Evaluation
Figure 2 shows usability evaluations for the previous
and proposed tools. The system usability scale
utilized in this study included inverted evaluation
items. In Figure 2, positive evaluations are
represented with higher values.
Figure 2 shows that the evaluations were higher
for the proposed tool than the previous tool for all 10
evaluation items. A non-corresponding t-test
performed for the average difference in total
usability points between the previous and proposed
tools confirmed that the proposed tool obtained a
significantly higher average point total (33.9) than
the previous tool’s average (31.1) (t(146)=3.572,
p<.01). However, the average point values were less
than 3.0 for items 4, 9, and 10 in the evaluations of
the proposed tool.
3.3.2 Efficiency Evaluation
Figure 3 shows efficiency evaluation results for the
proposed and previous tools. A non-corresponding t-
test performed for the average difference for items 1
to 10 confirmed that the proposed tool obtained a
significantly lower average than the previous tool’s
No. Usability Efficiency
1 I think that I would like to use this tool frequently. It didn't take long.
2 I found the tool unnecessarily comp lex. It was p ossible to draw diagrams easily .
3 I thought the tool was easy to use. It was p ossible to draw diagrams neatly .
4
I think that I would need the sup p ort of a technical p erson
to be able to use this tool.
It was p ossible to draw diagrams in detail.
5 I found the various functions in this tool were well integrated. It was easy to erase nodes or links.
6 I thought there was too much inconsistency in this tool. It was easy to revise diagrams.
7
I would imagine that most peop le would learn to use this tool
very quickly.
It was easy to rearrange nodes or links.
8 I found the tool very cumbersome to use.
It was useful to classify information
by kinds of color or line.
9 I felt very confident using the tool. It was easy to organiz e informat ion.
10
I needed to learn a lot of things before I could get going with
this tool.
It was easy to consider relationship .
DevelopmentandPracticalApplicationofaRelationshipDiagram-creationToolCenteringonAutomaticCreation
Functionality
397
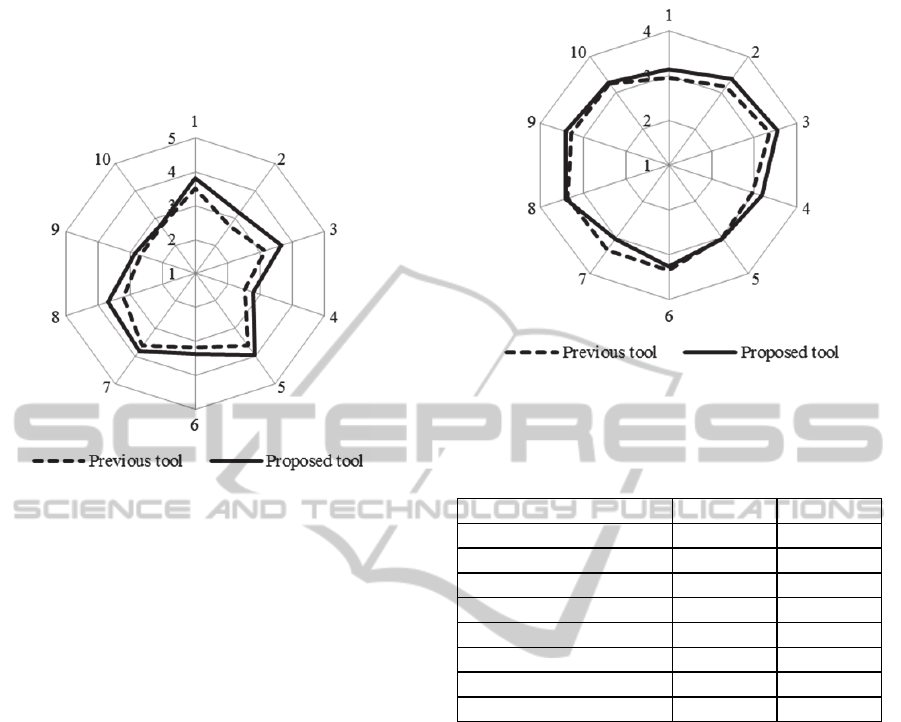
average for item 7 (t(146)=2.377, p<.05). While the
proposed tool received higher point totals in most
evaluation categories, we did not find a significant
difference.
Figure 2: Result of usability evaluations using the previous
and proposed tools.
3.4 Evaluations of Student Created
Relationship Diagrams
To show the effect of the proposed tool on learning,
we evaluated the relationship diagrams created by
students and conducted student evaluations of the
tool. This study established evaluation items for (1)
the number of nodes for each type and (2) the
number of links (excluding the crossing links
mentioned below), which express the amount of
information in the diagram, and (3) the number of
crossing links (links that cross node levels; we
observed activity when links were added to
previously created nodes), which are used as an
evaluation item in representative earlier research
(Novak and Gowin, 1984). The subjects of analysis
were relationship diagrams (14 from the previous
tool, 30 from the proposed tool) created by
consenting student groups.
Table 2 shows the results of analyzing the
relationship diagrams created in experiments using
the previous and proposed tools. Each item is
represented by a number; however, this excludes
data included in data files provided at the beginning
of diagram creation. A non-corresponding t-test
performed for the average difference for each
evaluation item confirmed that diagrams created by
the proposed tool had significantly more expectation
nodes (t(42)=2.330, p<.05) and crossing links.
Figure 3: Result of efficiency evaluations using the
previous and proposed tools.
Table 2: Results of analyzing the relationship diagrams
using the previous and proposed tools.
(t(42)=3.865, p<.01) compared with those created by
the previous tool. We also found that the relationship
diagrams created with the previous tool had a
significantly larger number of nodes regarding social
background elements (t(42)=4.505, p<.01).
3.5 Discussion
Usability evaluations of the tool confirmed that the
proposed tool received higher overall evaluations
than the previously developed tool. This suggests
that the control methods and interface developed in
this study were easy for the students to understand.
No significant difference between the previous
and proposed tool was seen in evaluation of tool
efficiency. Low evaluation of the proposed tool’s
ability to change the organization was due to the
specifications of the proposed tool; students could
not reorganize the diagram. As no difference was
seen in other items, we hypothesize that this
specification did not have a large overall effect on
relationship diagram creation.
Evaluation items Previous tool Proposed tool
Phy sical attributes 4.7 5.2
Social background elements 1.6 0.3
Psy chological state elements 2.9 3.7
Expectations 1.1 2.2
Nursing obstacles 1.7 1.3
Nursing intervention 2.8 3.0
Links 15.7 14.8
Crossing links 2.9 6.8
CSEDU2014-6thInternationalConferenceonComputerSupportedEducation
398

Analysis of the relationship diagrams created by
students confirmed that the number of prediction
nodes and crossing links increased with the proposed
tool. This suggests that students actively investigated
the possibility of future occurrences based on the
provided information as well as the relationships
among the information. Diagram creation required
two class periods with the previous tool, whereas the
proposed tool used only one. This indicates the
efficiency of the proposed tool.
Future improvements could include
strengthening support functions for promoting link
creation and diagram nodes. In particular, the results
showed that few social background elements were
created by the proposed tool. In future, we aim to
add additional functions to promote entry of such
elements.
4 IMPROVING THE
RELATIONSHIP
DIAGRAM-CREATION TOOL
4.1 Adding Functions to the Tool
To increase the efficiency of the relationship
diagram-creation tool introduced to the classroom in
Section 3, we have implemented the following
additional functions: an initial information entry
function and a nursing problem extraction function.
4.1.1 Initial Information Entry Function
The initial information entry function supports
activity at the beginning of the relationship diagram
creation process. Students enter basic information
regarding the patient using a template displayed in
list format (age, sex, family composition,
occupation, medical history, and disease name). This
data is saved as an initial information file. By
importing the initial information file through the tool
menu, a relationship diagram based on all the
information is displayed.
This function is expected to promote the creation
of social background elements and physical
attributes related to the target patient. We also
expect this function to increase productivity of
student data entry during the initial creation of the
relationship diagram, reducing both data omissions
and time required to create a diagram.
4.1.2 Nursing Problem Extraction Function
The nursing problem extraction function supports
evaluations after creation of the relationship
diagram. As stated in Section 2.2.3, we implemented
an evaluation support function that provided
quantitative information related to the relationship
diagram. However, evaluating the content of the
created relationship diagram was difficult with this
function. Thus, we implemented the nursing issue
extraction function to assess the content of the
relationship map effectively. By selecting this
function, links are extracted from the initial
information nodes to the nursing issue (crucial issues
in nursing) nodes and displayed in another window
(for example, “76-year-old woman > stroke >
incontinence > damp skin > bedsores).
This function is expected to make it easy for
students to conduct an evaluation by reviewing their
thought process through a large quantity of
information, which can promote understanding of
the subject.
4.2 Introducing the Improved Tool into
the Classroom
We introduced the improved tool in a class to assess
the effects of the improvements. As with the
experiment described in Section 3.1, we used one
class period of “The Nursing Process,” a first-year
open lecture at a short-term nursing university.
There were 82 first-year short-term nursing college
(school of nursing) students in the class.
The class design was approximately the same as
the previous class, with the following changes. (1)
We added an explanation of the initial information
entry function at the first step. (2) In the second step,
students created a relationship diagram using the
initial information entry function (students were
given a printed sheet of information rather than a
data file). (3) In the third step, the relationship
diagrams were assessed using the nursing issue
extraction function in addition to the evaluation
sheet and creation process replay function. After the
class, tool evaluation was performed using the same
questionnaire. 66 students were targets of this
analysis.
4.3 Student Evaluations of the
Improved Tool
In Section 3, we assessed the tool through
comparison with the previously developed tool. Here
we compare student evaluations of the proposed tool
before and after implementing the improvements
described in Sections 4.1.1 and 4.1.2.
DevelopmentandPracticalApplicationofaRelationshipDiagram-creationToolCenteringonAutomaticCreation
Functionality
399
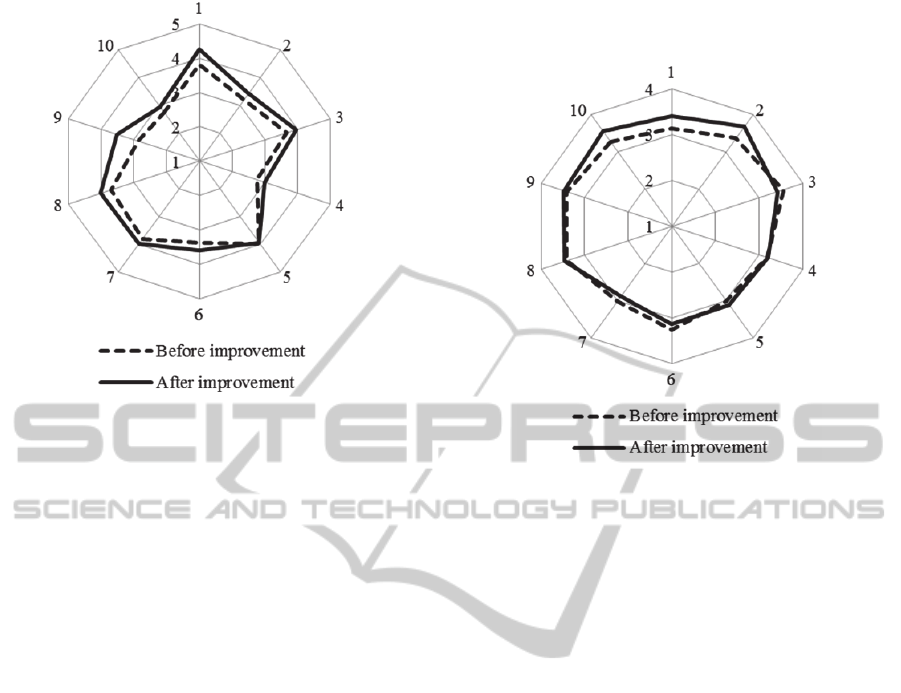
Figure 4: Result of usability evaluations of the tool before
and after improvement.
4.4 Student Evaluations of the
Improved Tool
In Section 3, we assessed the tool through
comparison with the previously developed tool. Here
we compare student evaluations of the proposed tool
before and after implementing the improvements
described in Sections 4.1.1 and 4.1.2.
4.4.1 Usability Evaluation
Figure 4 shows the usability evaluations of the tool
as points before and after improvement. Figure 4
shows that the evaluations of the tool after
improvement were higher in every item except 5. A
non-corresponding t-test performed for the average
difference in total points of usability for the tool
before (33.9) and after improvement (36.6) showed
that the improved tool received significantly higher
average point totals (t(135)=2.855, p<.01). Items 4,
9, and 10, which received evaluations with average
point scores below 3.0 prior to improvement, rose
above 3.0 after the improvements were
implemented.
4.4.2 Efficiency Evaluation
Figure 5 shows efficiency evaluation results of the
tool before and after improvement. A non-
corresponding t-test performed for the average
difference in points for each evaluation item
confirmed that the improved tool received
significantly higher evaluations in items 1
(t(144)=2.365, p<.05), 2 (t(144)=3.706, p<.01),
and10 (t(133)=2.882, p<.01). No evaluations were
significantly lower after improving the tool.
Figure 5: Result of efficiency evaluations of the tool
before and after improvement.
4.5 Evaluation of the Relationship
Diagrams Created by Students
As with the relationship diagrams created with the
proposed and previous tools, we assessed the
diagrams created before and after improvement of
the proposed tool. The subjects of analysis were
relationship diagrams (30 with the unimproved tool,
20 with the improved tool) created by consenting
student groups.
Table 3 shows the results of analyzing the
relationship diagrams created using the tool before
and after improvement. As in Table 2, the numerical
values exclude information included in the data file.
A non-corresponding t-test performed for the
average difference in points for each item confirmed
that diagrams created with the improved tool
contained significantly higher nodes containing
physical attributes (t(48)=3.751, p<.01) and social
background elements (t(48)=2.317, p<.05). In
contrast, we found that psychological state elements
were significantly more numerous in the relationship
diagrams created with the tool prior to improvement
(t(48)=2.911, p<.01).
4.6 Discussion
Usability evaluations confirmed that the improved
tool received higher overall evaluations than the tool
prior to improvement. This suggests that the
additional functions improved usability even further
CSEDU2014-6thInternationalConferenceonComputerSupportedEducation
400

when creating new relationship diagrams and
assessing the created diagrams.
Table 3: Results of analyzing the relationship diagrams
using the tool before and after improvement.
In addition, efficiency evaluations of the tool
showed improvement in three evaluation items; in
particular, 1, which considered creating diagrams,
improved. The reason for this is thought to be that
by adding the initial information entry function, it
was possible to reduce the time required for students
to enter information. In addition, 10, which
considered the ease of thinking about relationships,
also improved. This suggests that the nursing issue
extraction function was effective in making
relationships easier to grasp.
Analysis of the relationship diagrams created by
the students confirmed that physical attributes and
social background elements increased in the
improved tool. This is thought to be because the
improved tool reflects the results of continuing
creation while the student focuses on social
background elements, such as occupation and family
composition, and physical attributes, such as
medical history, through the initial information entry
function implemented in the tool. We hypothesize
that the reduction in psychological state elements
was due to the absence of psychological state
elements in the initial information.
In this study, during creation of the initial
information we selected the basic information that
we wanted students to enter in the relationship
diagram. If the selected information had a strong
effect on the content of the relationship diagram, we
considered that it should include information that
would serve to develop opportunities for further
consideration; for example, problems during
hospitalization and psychological state elements,
such as what the patient does not want to do. In
future, we aim to investigate this point through
practical experiments.
5 CONCLUSIONS
The relationship diagram-creation tool developed in
this study received more positive evaluation than
tools developed in earlier research. We have also
examined the effects of further improving the tool.
While this study conducted an analysis of the
relationship diagrams created by the students, future
research is aimed at performing detailed analysis of
the creation process and experimentally
investigating the effect of each function
implemented to facilitate addition of knowledge
obtained in the current study. Based on the results of
this analysis, we hope to improve the tool further
and create a more effective learning environment.
REFERENCES
Akinsanya, C., Williams, M., 2004. Concept mapping for
meaningful learning. Nurse Education Today, 13(1),
41-46.
All, A., Havens, R., 1997. Cognitive/Concept mapping: A
teaching strategy in nursing. Journal of Advanced
Nursing, 25(6), 1210-1219.
Brooke, J., 1996. SUS: A “quick and dirty” usability scale.
In Jordan, P. W. et al., (eds.), Usability Evaluation in
Industry. Taylor and Francis.
Hsu, L., Hsieh, S., 2005. Concept maps as assessment tool
in a nursing course. Journal of Professional Nursing,
21(3), 141-149.
Ishii, N., Sakuma, S, 2011. Supporting the creation of
sequence of events in nursing education. International
Journal of Education and Information Technologies,
5(2), 199-206.
Novak, J. D., Gowin, D. B.,1984. Learning How to Learn.
Cambridge University Press.
Schuster, P. M., 2002. Concept Mapping: A Critical
Thinking Approach to Care Planning. F.A. Davis.
Sugisaki, H., Ogawa, I., 2006. Learning effects of use of
sequence of events in adult nursing practicum (Acute
period). Bulletin of Nara Medical University School of
Nursing, 2, 1-6.
Toyoshima, Y., Itou, F., Hagi, Y., Nishibori, Y., Kazaoka,
T., Kishita, S., Itou, S., 2005. Evaluation of student
learning about the nursing process using written
simulation in adult nursing course (Part 3): Analysis of
student self-evaluation in learning with sequence of
events. Bulletin of Department of Nursing Seirei
Christopher College, 13, 81-90.
Yakushijin, Y., Murakami, E., Nakamura, K., 2006.
Learning effectiveness of using concept maps in
pediatric clinical nursing practice. Journal of Japanese
Society of Child Health Nursing, 15(2), 8-14.
Evaluation items
Before
improvement
After
improvement
Phy sical attributes 5.2 8.8
Social background elements 0.3 0.9
Psy chological state element s 3.7 2.3
Expectations 2.2 1.7
Nursing obstacles 1.3 0.7
Nursing intervention 3.0 3.5
Links 14.8 15.7
Crossing links 6.8 7.6
DevelopmentandPracticalApplicationofaRelationshipDiagram-creationToolCenteringonAutomaticCreation
Functionality
401
