
Development of an Automatic System for Persistent Collection
of Physiological Information
Toward Long-term Application in Biorhythm Monitoring and Healthcare
Wenxi Chen
1
and Xun Gong
2
1
Biomedical Information Technology Lab., The University of Aizu, Tsuruga, Aizu-wakamatsu, Fukushima, Japan
2
NEC Engineering, Ltd., 1753 Shimonumabe, Nakahara-ku, Kawasaki, Kanagawa, Japan
Keywords: Daily Monitoring, Long-term, Physiological Information, Pulse Rate, SpO
2
, Biorhythm, Healthcare.
Abstract: This study aims to develop an automatic system for persistent collection of physiological information such
as pulse rate and SpO
2
in daily environment. The system includes a home-based user terminal and an
Internet database server. The user terminal consists of a SpO
2
sensor and a bedside box. The bedside box
receives the physiological data from the sensor by Bluetooth connection and relays the data to an Internet-
based database server. This system was used to collect the data during daily sleep from a female volunteer at
her thirties for a period of more than 15 months. Superior persistence characteristic in daily data collection
was confirmed and achieved up to 93.1% of data collection rate comparing with many allied devices or
systems that usually ranged about 25% or even less. Average length of menstrual cycles in the female
subject was estimated 24.9 days by the cosinor analysis method using the collected data. The result showed
satisfactorily accurate with comparing self-recorded length of 27.5±1.3 days. This system is expected to
serve as a significant approach for long-term data collection and to obtain more reliable results for the
purpose of tracking biorhythm and health condition change.
1 INTRODUCTION
Persistence characteristic in data collection is of fatal
importance in daily healthcare application because
tracking of biorhythmic change and health condition
change requires reliable data accumulation over a
long-term period. Inconvenient ways used in daily
environment often disturb daily activities and lead to
a lower rate in data collection which links to
unreliable outcomes in deep mining of physiological
data. This issue is usually treated by two ways: one
is to generate surrogate data by missing data analysis,
and another is to increase data collection rate by
usability improved approaches.
Missing data can be estimated by diversified
surrogate methods such as linear or cubic
interpolation, bootstrapping, maximum likelihood,
multiple imputation and other statistics-based
methods. However, surrogate data commonly differs
from the real measured data in many aspects such as
intrinsic data features and statistical behaviours. A
series of studies aimed at investigating these effects
on HRV in temporal and frequency domains as well
as nonlinear aspect had been conducted using
different methods (Kim et al., 2007, 2009, 2011).
On the other hand, diversified modalities for
conveniently monitoring various physiological data
were explored in the past decades. ECG or pulse can
be recorded not only on a bed during sleep (Ishijima,
1993; Watanabe et al., 2003; Chen et al., 2005; Lim
et al., 2007), but also on a chair during sitting (Lim
et al., 2006), and even in a bathtub during bathing
(Tamura et al., 1997, 1998).
This study serves two purposes. The first is to
develop an automatic Internet-based system suitable
for persistent collection of multiple physiological
information in daily life environment over long-term
period without much discomfort to the user. The
second is to assess physiological interpretation of
such long-term data through various mathematical
means. This paper will demonstrate the outcome in
estimating biorhythmic change such as a female’s
menstrual cycle by applying the cosinor analysis
method to these data. Finally, we will discuss its
potential application in long-term biorhythm
monitoring and health condition tracking for daily
health management.
289
Chen W. and Gong X..
Development of an Automatic System for Persistent Collection of Physiological Information - Toward Long-Term Application in Biorhythm Monitoring and
Healthcare.
DOI: 10.5220/0004923902890294
In Proceedings of the International Conference on Biomedical Electronics and Devices (BIODEVICES-2014), pages 289-294
ISBN: 978-989-758-013-0
Copyright
c
2014 SCITEPRESS (Science and Technology Publications, Lda.)
2 METHOD
This system includes two parts: a user terminal and
an Internet-based database server.
Outline of the system is showed in Figure 1. The
user terminal consists of a SpO
2
sensor and a
bedside box for physiological measurement at home.
The database server at remote serves for data storage
and further data analysis.
Figure 1: Schematic of pulse rate and SpO
2
data collection
during sleep. By attaching a Bluetooth-enabled SpO
2
sensor to a fingertip, the nearby bedside box establishes a
Bluetooth connection with the sensor automatically, and
receives the data from the sensor continuously. These data
are transmitted to a database server via Internet
connection.
When the user goes to bed and inserts a finger into
the sensor device, the device will be initiated
automatically and connected to a Bluetooth module
inside the bedside box.
The physiological data such as pulse rate and
SpO
2
is measured and transmitted to the bedside box
by Bluetooth connection. The bedside box will
receive and unpack the data packet sent by the
sensor device, extract useful information and repack
these data in a packet, and send one packet to the
remote database server every minute via the Internet
connection.
The server unpacks the received data and stores
the data in the database. The daily accumulated data
will be analysed and its outcomes will be visualized
on webpage.
2.1 User Terminal
There are two separate parts in a user terminal. A
Bluetooth-enabled wristwatch type pulse oximeter
(Model 4100, Nonin Medical, Inc., USA) is used as
a sensor device. A bedside box consists of two main
modules: AKI-H8/3069F LAN board (Akizuki Inc.,
Japan) and Parani ESD 200 Bluetooth module
(SENA Technologies Inc., Japan).
The AKI-H8 board contains a RTL8019AS full-
duplex Ethernet controller and a LAN port, which
allows TCP/IP protocol stacks to be used.
Parani-ESD 200 is a module for short range
wireless communication using Bluetooth technology.
It can communicate with other Bluetooth devices
that support the Serial Port Profile (SPP). This
module is registered to the sensor device and will
create a connection automatically when the sensor
device is turned on.
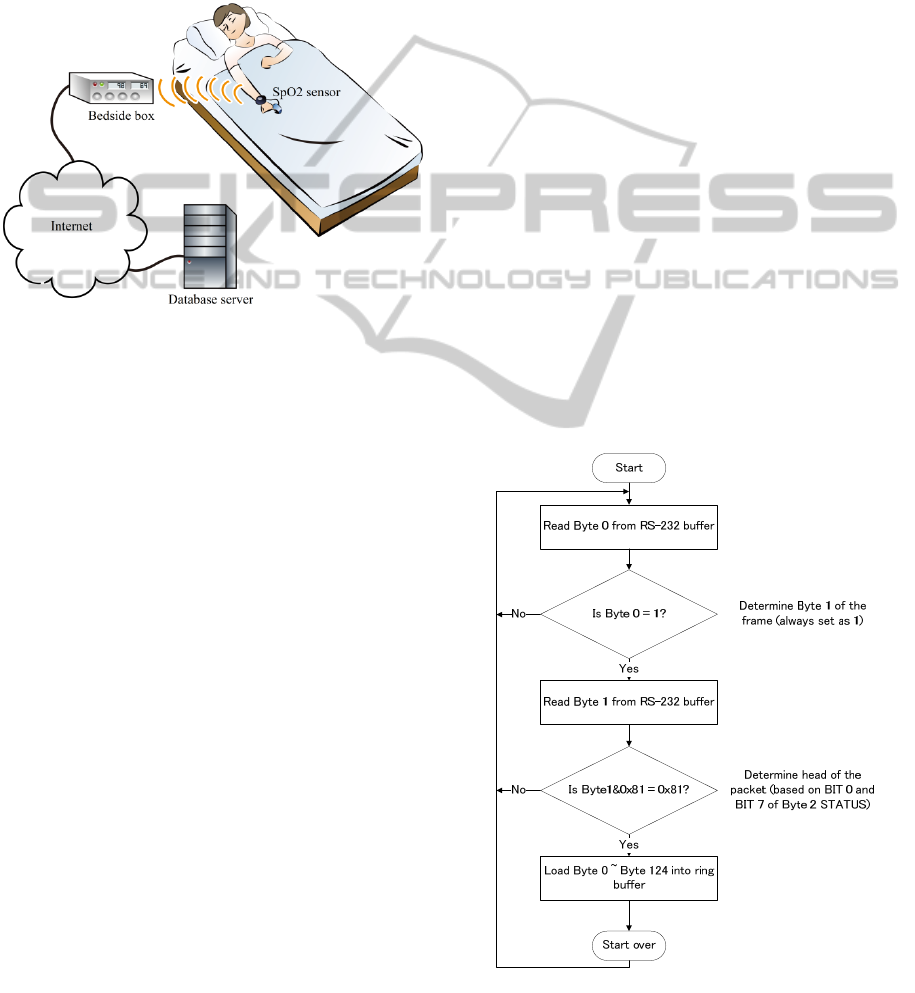
Data received from the sensor device will be
transmitted to the H8/3069F board through RS-232
interface. After the connection between ESD 200
and the sensor device is established, the data transfer
is ready. The application starts to read each byte
from the RS-232 buffer. If this byte turns out to be 1,
then read the next byte and determine whether it is
the first frame. When the first frame is found, the
application will receive the rest of the packet and
decode the pulse rate, SpO
2
, signal status and battery
status.
After one packet is received in the ring buffer,
data such as pulse rate, SpO
2
, signal status and
battery status can be decoded. The detailed
flowchart of decoding data from the sensor device is
showed in Figure 2.
Figure 2: Procedure for decoding data stream from the
sensor device.
BIODEVICES2014-InternationalConferenceonBiomedicalElectronicsandDevices
290

When the power of the sensor device is turned
on automatically due to a fingertip insertion, it will
attempt to connect a registered host Bluetooth device.
Once the connection with a paired bedside box is
successfully established, the sensor device will start
sending data packets including pulse rate, SpO
2
and
status data such as signal quality and battery status.
Range of data transmission is roughly 10 meters
which is enough for a daily sleep environment in a
bedroom. The radio frequency band is 2.4 GHz. The
Bluetooth profile for data transmission between the
bedside box and the sensor device is the Serial Port
Profile (SPP).
The sensor device transmits data to the bedside
box by a packet format consisting of 25 frames.
Each frame consists of 5 bytes. Three packets, or
totally 75 frames, are transmitted every second.
The bedside box has two major functions as
follows.
1. Connect to the Bluetooth-enabled sensor device
wirelessly, and receive, unpack and reorganize
the data transmitted from the sensor device.
2. Send the reorganized data packets to the database
server once a minute.
There are totally 264 bytes as two sections, a
head section and a data section, in a reorganized data
packet. The head section consists of the first 24
bytes and contains auxiliary information such as
software version, bedside box ID, sensor device ID
and some reserved bytes. The bedside box ID is
bonded with user information, so that the uploaded
data can be saved and retrieved using a user ID.
The data section includes information such as
pulse rate, SpO
2
, battery status and signal quality in
the previous minute, and has totally 240 bytes.
The bedside box receives three packets from the
sensor device every second. Since the data
transmission rate is fixed, the application will pick
up the first packet among these three packets,
decode the packet and repack the necessary data into
the data section with combining the head section in
order to reorganize an upload packet.
Once sixty upload packets are fulfilled, the
bedside box will send the upload packet including
the head section and the data section up to the
database server every minute.
If the sensor device is turned off when the user’s
finger leaves the sensor, data transfer will stop.
However, the data already in the upload packet
buffer still exist. Once the data transfer resumes,
those unsent data will be uploaded to the database
server at the wrong time stamp. The application will
prevent this mistake by adding a 1-second timer.
When the receiving procedure starts in the
bedside box, a 1-second timer will be started. After
any packet is received, the application will check
and clear the 1-second timer. If the timer has already
ran out, which means that the application hasn’t
receive any packet in 1 second, the application
would clear the whole upload buffer to avoid data
uploaded at the wrong time stamp.
Because there is no built-in clock on the AKI-
H8/3069F board, time information for every packet
uploaded to the database server will be added on the
server side. Because the packet size is small, the
delay due to data transmission on the Internet is less
than 10ms and ignored.
The detailed flowchart of uploading data packets
to the database server is showed in Figure 3.
Figure 3: Procedure for uploading data from the bedside
box to the database server.
2.2 Database Server
The database server can receive the data packets sent
from the bedside box, extract relevant information
from the packets, store the data into the database and
provide the accumulated raw data to an application
server for advanced functions such as data analysis
and visualization. The database was implemented by
using an open source MySQL.
A data reception application was developed on
the Apache Tomcat platform which is an open
source software implementation of the Java Servlet
and Java Server Pages technologies. The data
reception application keeps listening to the prescript
DevelopmentofanAutomaticSystemforPersistentCollectionofPhysiologicalInformation-TowardLong-Term
ApplicationinBiorhythmMonitoringandHealthcare
291

socket port. Once a packet coming from the bedside
box arrives, the data reception application will
acquire and unpack the packet with the protocol
described above. The decoded data will be saved
into the database.
2.3 Data Collection
Physiological data collected during sleep by the user
terminal include pulse rate and SpO
2
, as illustrated
in Figure 1. When the subject goes to bed, wears the
wrist-type sensor device and inserts a fingertip into
the sensor probe, the sensor device will be triggered
off and start searching the nearby bedside box which
is in a stand-by state waiting for the connection
request signal from the sensor device. The Bluetooth
wireless connection between the bedside box and the
sensor device is established automatically. Pulse rate
and SpO
2
data are collected from the sensor device
via the Bluetooth connection and are transmitted
continuously to the database server by the bedside
box during sleep automatically. When the subject
gets up and removes the sensor probe in the
morning, the Bluetooth connection is closed, the
bedside box goes into stand-by mode again, and the
data collection procedure is terminated.
After an informed consent was obtained from a
female volunteer at her thirties of age, we collected
daily physiological data from the subject during her
daily sleep. The female volunteer collected data for
442 days over a period of 475 days across
2007/12/13 to 2009/3/31. Data collection rate is
93.1%. Comparing with many allied devices or
systems which is usually about 25% or even less,
data collection rate by this system is fairly high due
to its convenient usage and full automation in daily
utilization.
2.4 Data Processing
To demonstrate the performance in estimating
female’s menstrual cycles using such kind of data
accumulated over a long-term period, the following
three steps are applied.
The daily pulse rate mode value is calculated in
the first step from the noise-suppressed pulse rate
data which has about 20,000 data points during a 6-
7-hour sleep episode.
The second step has two tasks: (1) to smooth the
daily mode value profile using a Savitzky–Golay
filter, and (2) to remove a slower baseline wandering
(which may imply seasonal biorhythmic change and
remain to be studied in further deep data mining in
the future) using a multi-rate filter.
The rhythmicity is estimated in the third step
from the detrended profile of the daily mode value
using the cosinor analysis method.
Figure 4: Upper subplot: PR mode value and standard deviation profile; Lower subplot: menstrual cycle estimation
procedure. Red horizontal bars denote the menses periods that were recorded by the subject.
BIODEVICES2014-InternationalConferenceonBiomedicalElectronicsandDevices
292

3 RESULTS
The cosinor analysis method is often used to
estimate biorhythms with regular cycle length from
biological time series data (Nelson et al., 1979). We
determine the optimal parameter set (M, A, ω, φ) to
approximate the detrended mode data using a cosine
function f(t
i
), as showed in the equation (1), by
minimizing the residual sum of squared (RSS) errors
between the detrended mode data and the
corresponding value generated by the function f(t
i
).
ii
tAMtf cos
(1)
where t
i
represents the time of measurement of the i
th
data, M is the mean level (MESOR) of the cosine
curve, A is the amplitude of the function, ω is the
angular frequency (reciprocal of the cycle length) of
the curve, and φ is the acrophase (horizontal shift) of
the curve.
The optimal length of the average menstrual
cycle is estimated 24.9 days. This compares with the
average self-recorded menstrual cycle length of
27.5±1.3 days which is derived from total 16 cycles
ranging from 25 to 30 days during the data
collection period. The estimated length has an error
about 9.5%.
The estimation procedure and its outcomes with
overlapped self-record are showed in Figure 4. The
upper subplot shows daily mode value and its
standard deviation profiles, the markers “o” and
vertical bars “|”, terminated at the upper and lower
ends by short horizontal lines “-”, show the mode
values and standard deviation of the pulse rate data
in daily sleep episodes. The lower subplot
demonstrates the menstrual cycle estimation
procedure, the bold blue line shows the smoothed
profile of the daily mode values, and the black
dotted line shows the detrended result of the
smoothed mode profile. The cyan line is the cosinor-
fitting result to the black dotted line. Red horizontal
bars denote the menses periods that were recorded
by the subject.
Data are plotted on the day-by-day basis along
the x-axis. The y-axis denotes pulse rate in the unit
of beat per minute (bpm). Some sporadic
discontinuities can be seen, as no data were collected
during those days.
4 DISCUSSION
Purposes of this study aim mainly at developing a
user-friendly and convenient system available for
daily physiological information collection over long-
term period, and providing more reliable data for
further analysis.
Data collection rate can be used as one of the
indicators for evaluating the usability of the system.
It seems promising to achieve fairly high rate in data
collection over 15 months. We examined the
reliability of these data by applying the cosinor
analysis method to estimate the menstrual cycle, and
achieved reasonable accuracy with estimation error
smaller than 10%.
Although the cosinor analysis method does not
require that the data be sampled at equal intervals,
and it also tolerates incidents of missing data, it
provides an accessible means of estimating the
periodic signature in physiological data. However,
the cosinor analysis method postulates that the data
should be reasonably represented in a deterministic
cyclic form with a constant period. This prerequisite
is not always suitable in female menstrual cycles. To
deal with irregular cycle cases and explore other
intrinsic biorhythms, more data mining methods will
be conducted to extract various features in time
domain, frequency domain and chaotic domain in
the future.
Further interpretation for the physiological
significance such as health condition change and
biorhythmic fluctuation from these long-term data
will be one of the most important tasks in the
coming data analysis. Deep data mining on different
temporal scales, such as daily, weekly, monthly,
seasonal and even yearly, will be conducted to
reveal the statistical links among health condition
change and various data signatures over a long-term
period.
5 CONCLUSIONS
The system was examined by a female volunteer in
more than 15 months and confirmed its friendly
usability, performance and reliability in systematic
aspects such as data collection and data analysis.
Higher rate in data collection over a long-term
period, and more reliable outcome from the long-
term data were confirmed and achieved. This study
is expected to be served as a part of SHIP (Scalable
Healthcare Integrated Platform) project (Chen et al.,
2008).
ACKNOWLEDGEMENTS
The authors thank the volunteer for her cooperative
DevelopmentofanAutomaticSystemforPersistentCollectionofPhysiologicalInformation-TowardLong-Term
ApplicationinBiorhythmMonitoringandHealthcare
293

participation in data collection over a long-term
period. This study was supported in part by MEXT
Grants-In-Aid for Scientific Research No. 20500601
and the University of Aizu Competitive Research
Funding P-24.
REFERENCES
Kim, K. K., Lim, Y. G., Kim, J.S., Park, K. S., 2007.
Effect of missing RR-interval data on heart rate
variability analysis in the time domain, Physiol. Meas.
28:1485-1494.
Kim, K. K., Kim, J. S., Lim, Y.G., Park, K. S., 2009.
Effect of missing RR-interval data on heart rate
variability analysis in the frequency domain, Physiol.
Meas. 30:1039-1050.
Kim, K. K., Baek, H. J., Lim, Y. G., Park, K. S., 2012.
Effect of missing RR-interval data on nonlinear heart
rate variability analysis, Computer Methods and
Programs in Biomedicine, 106(3):210–218.
Chen, W., Zhu, X., Nemoto, T., Kanemitsu, Y., Kitamura,
K., Yamakoshi, K., 2005. Unconstrained detection of
respiration rhythm and pulse rate with one under-
pillow sensor during sleep, Medical & Biological
Engineering & Computing, 43(2):306-312.
Lim, Y. G., Kim, K. K., Park, K. S., 2007. ECG recording
on a bed during sleep without direct skin-contact,
IEEE Trans. Biomed. Eng., 54:718–725.
Lim, Y. G., Kim, K. K., Park, K. S., 2006. ECG
measurement on a chair without conductive contact.
IEEE Trans Biomed Eng., 53(5):956-959.
Tamura, T., Togawa, T., Ogawa, M., Yoda, M., 1998.
Fully automated health monitoring system in the home,
Medical Engineering & Physics, 20:573-579.
Tamura, T., Yoshimura, T., Nakajima, K., Miike, H.,
Togawa, T., 1997. Unconstrained heart-rate
monitoring during bathing. Biomed Instrum Technol.,
31(4):391-396.
Ishijima, M., 1993. Monitoring of Electrocardiograms in
Bed without Utilizing Body Surface Electrodes, IEEE
Trans Biomed Eng. 40(6):593-594.
Watanabe, K., Tasaki, T., Nemoto, T., Yamakoshi, K.,
Chen, W., 2003. Development of Biometry System in
the Sleep by Pillow Cuff Installed on the Occiput,
Proc. of 42
nd
Japan Soc. ME & BE, 41:168.
Nelson, W.; Tong, Y.L.; Lee, J.K., Halberg, F., 1979.
Methods for cosinor-rhythmometry. Chronobiologia,
6(4):305-323.
Chen, W., Zhu, X., Nemoto, T., Wei, D., Togawa, T.,
2008. A Scalable Healthcare Integrated Platform
(SHIP) and Key Technologies for Daily Application,
Chapter 11 in “Data Mining in Medical and Biological
Research”, 177-208, ISBN 978-953-7619-30-5, IN-
TECH, Vienna, Austria.
BIODEVICES2014-InternationalConferenceonBiomedicalElectronicsandDevices
294
