
ProRank+
A Method for Detecting Protein Complexes in Protein Interaction Networks
Eileen Marie Hanna and Nazar Zaki
College of Information Technology, United Arab Emirates University, Al-Ain, Abu Dhabi, United Arab Emirates
Keywords: Google PageRank Algorithm, PPI, Protein Complex, Essential Protein, ProRank Algorithm.
Abstract: The course of developing effective medical treatments is typically based on the identification of disease-
triggering protein complexes. In this paper, we present ProRank+, an effective method for detecting protein
complexes in protein interaction networks. By assuming that complexes may overlap, the method uses a
ranking algorithm to order proteins based on their importance in the network. In addition, a novel merging
procedure is introduced to refine the predicted complexes in terms of their members. The experimental
studies and results showed that ProRank+ outperforms several state-of-the-art methods in terms of the
number of correctly-detected protein complexes using numerous quality measures.
1 INTRODUCTION
Cellular functions are often executed through
collaborations of protein groups referred to as
protein complexes (Gavin et al., 2006). Accordingly,
identifying protein complexes in protein interaction
networks is an essential step towards understanding
normal cellular processes as well as defining and
treating possible diseases induced by their
malfunctions. The biological methods employed for
the detection of protein complexes often face
drawbacks, mainly in high time and cost
requirements. Therefore, many computational
methods were designed in order to complement the
experimental efforts by highlighting protein groups
which could potentially delineate various cellular
functions. In a computational context, a protein
interaction network is usually modeled as an
interaction graph in which vertices represent the
proteins and edges represent their interactions. In
this setting, it is generally assumed that protein
complexes correspond to dense subgraphs within the
graph. Among the recent methods, we herein
highlight: Markov Clustering (MCL) (Dongen,
2000) which uses random walks in protein
interaction networks, the molecular complex
detection (MCODE) algorithm (Bader and Hogue,
2003) which identifies complexes as dense regions
grown from highly-weighted vertices, the clustering
based on maximal cliques (CMC) method (Guimei
et al., 2009), the Affinity Propagation (AP)
algorithm (Frey and Dueck, 2007), ClusterONE
(Nepusz et al., 2012) which identifies protein
complexes through clustering with overlapping
neighborhood expansion, the restricted
neighborhood search (RNSC) algorithm (King et al.,
2004; Przulj et al., 2004), the RRW algorithm which
generates complexes by using repeated random
walks (Macropol et al., 2009), CFinder (Adamcsek
et al., 2006) which is based on the clique percolation
method. These methods, among several ones,
showed relatively good performance in detecting
protein complexes. However, by assuming that
protein complexes correspond to dense subgraphs in
the interaction network limits, the detection process
is limited since it does not usually allow the
identification of complexes with few members
and/or few interactions. ProRank (Zaki et al., 2012a)
is a recent method developed to detect protein
complexes from protein interaction networks based
on a protein ranking algorithm. When compared
with previous methods, the experimental studies
showed a good performance of the ProRank
algorithm in terms of the number of detected protein
complexes as well as precision, recall and accuracy
levels. In spite of that, ProRank does not take into
account possible overlaps among the detected
complexes. In fact, a protein can exhibit many
functions by being part of different complexes
(Hodgkin, 1998). Therefore, it is beneficial to reflect
this fact when searching for protein complexes in
239
Hanna E. and Zaki N..
ProRank+ - A Method for Detecting Protein Complexes in Protein Interaction Networks.
DOI: 10.5220/0004910802390244
In Proceedings of the International Conference on Bioinformatics Models, Methods and Algorithms (BIOINFORMATICS-2014), pages 239-244
ISBN: 978-989-758-012-3
Copyright
c
2014 SCITEPRESS (Science and Technology Publications, Lda.)
interaction networks. Moreover, ProRank computes
a similarity matrix consisting of the similarity scores
among all the proteins in the interaction network.
This step can be discarded since it is
computationally-expensive and has a comparatively
small effect on the final results (Zaki et al., 2012b).
In this paper, we present ProRank+, an enhanced
protein-complex detection algorithm which detects
possibly-overlapping complexes. Additionally, the
method includes a novel merging procedure,
Merging by Cohesiveness, used to refine the
detected protein complexes. In this setting,
complexes are viewed as entities of highly-
interconnected members that are well-separated
from the rest of the interaction network. The
experimental studies and results greatly favor our
approach.
2 THE PRORANK+ METHOD
ProRank (Zaki et al., 2012a,b) is a recently-
introduced method designed to detect protein
complexes in protein interaction networks. It mainly
consists of a protein ranking algorithm inspired by
Google's PageRank algorithm (Bryan and Leise,
2006; Langville and Meyer, 2006; Ishii and Tempo,
2010) which quantifies and ranks web pages by their
level of importance. Likewise, ProRank applies the
same analogy on protein interaction networks to
rank proteins and pinpoint the "essential" ones
which play key roles in cellular processes. Those
proteins are then considered as starting points to
form the detected complexes. Five main steps
outline the ProRank algorithm:
a. Pruning: removing unreliable interactions that
could negatively affect the detection process
using the AdjustCD method (Hon et al., 2006;
Chua et al., 2008), a weighting scheme that
iteratively calculates the reliability of protein
interactions based on the topology of the
interaction network and considers as unreliable
those whose weights are less than a specified
threshold.
b. Filtering: a protein interaction network usually
contains noisy proteins which may belong to one
of the following types: bridge proteins which
have a disconnected subgraph of neighbors; fjord
proteins whose neighbors have a small number
of interactions among each other; and shore
proteins which have at least one neighbor with
significantly few interactions with other proteins.
Proteins in the network are examined for
possible belonging to these types.
c. Protein Similarity Calculating: Based on the
assumption by which proteins belonging to the
same complex most likely have evolutionary
relationships, the similarity scores among all the
proteins in the network are calculated using their
pairwise alignment scores.
d. Protein Ranking: a ranking algorithm is used to
rank proteins based on the number of
interactions in which they participate and the
similarity levels among them.
e. Complex Detection: protein complexes are
detected using the spoke model. Essential
proteins are considered by their decreasing
ranking order and each of them is along with its
neighbors form a protein complex. It is assumed
here that every protein in the network can belong
to one complex only.
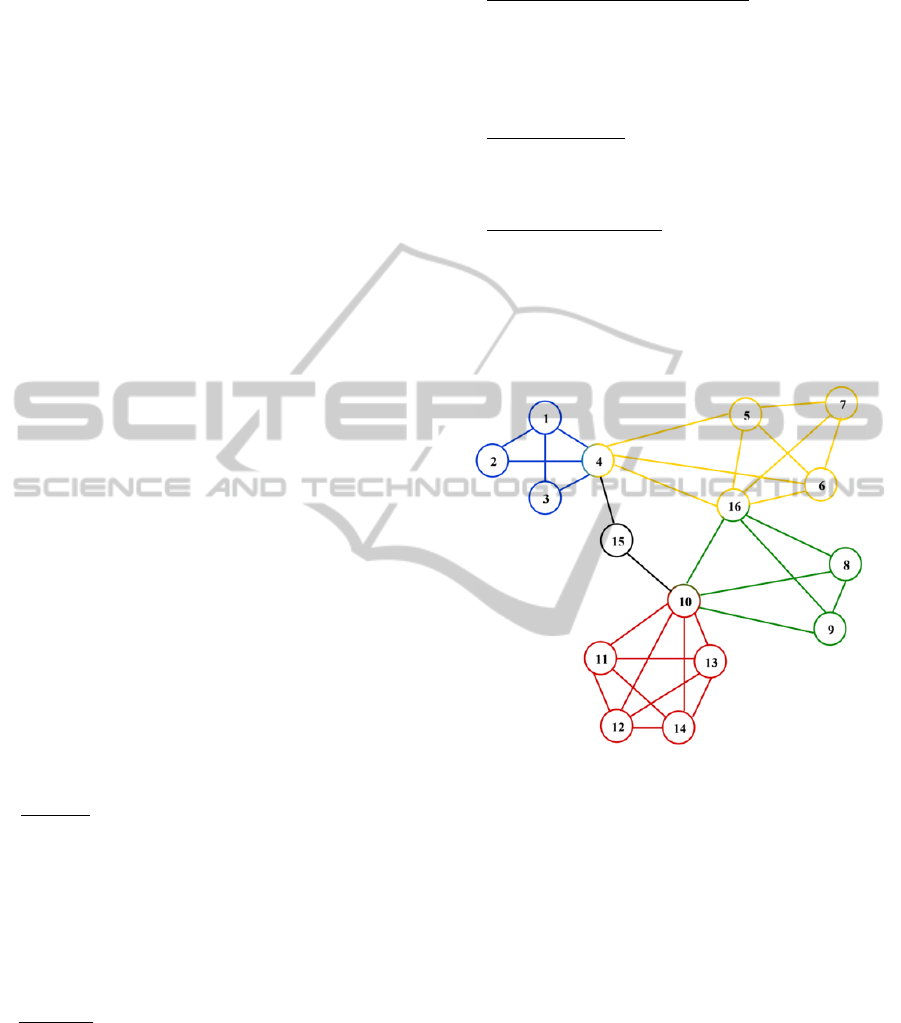
Figure 1: A hypothetical protein interaction network
consisting of 16 proteins (numbered from 1 to 16) and 4
complexes: Cmplx1 = {1,2,3,4} colored in blue, Cmplx2 =
{4,5,6,7,16} colored in yellow, Cmplx3 = {8,9,10,16}
colored in green, and Cmplx4 = {10,11,12,13,14} colored
in red.
A hypothetical protein interaction network is
presented in Figure 1. The steps of the ProRank
method when applied on this network are
summarized in Table 1. For simplicity, all the
interactions are considered reliable and the similarity
among all the proteins is assumed to be uniform.
Three complexes are detected: C1 = {6,4,5,7,16},
C2 = {14,10,11,12,13} and C3 = {1,2,3}. They
correspond to essential proteins 6, 14 and 1 and their
direct neighbors consecutively.
A protein can participate in multiple cellular
functions by being part of several protein complexes
(Hodgkin, 1998). For instance, among the 1189
proteins contained in the MIPS catalog of protein
BIOINFORMATICS2014-InternationalConferenceonBioinformaticsModels,MethodsandAlgorithms
240

Table 1: Types, ranking scores, and assigned complexes
given by the ProRank method applied on the protein
interaction network presented in Figure 1.
Protein Type Ranking Complex
6 Essential 0.0625 C1
5 Essential 0.0625 C1
14 Essential 0.0596 C2
13 Essential 0.0596 C2
12 Essential 0.0596 C2
11 Essential 0.0596 C2
1 Essential 0.0539 C3
7 Essential 0.0478 C1
9 Essential 0.0468 -
8 Essential 0.0468 -
3 Essential 0.0368 C3
2 Essential 0.0368 C3
10 Fjord 0.1167 C2
4 Fjord 0.1124 C1
16 Fjord 0.1044 C1
15 Bridge 0.0338 -
complexes (Mewes et al., 2004), 820 proteins
(approx. 69%) belong to more than one complex.
Similarly, among the 1279 covered by the SGD
complex set (Hong et al., 2008), 332 proteins
(approx. 26%) belong to multiple complexes. Hence,
accounting for this biological fact would most likely
increase the reliability of complex-detection
algorithms. Accordingly, we start out from this
notion to introduce ProRank+. For instance, we
applied this notion on the network presented in
Figure 1 knowing that only the complex-detection
step is modified. Thus, the types and the ranking
scores of the proteins remain the same since the
steps used to generate them, including the ranking
algorithm, are unchanged. Table 2 summarizes the
iterations in this case.
The results of applying ProRank+ on the given
hypothetical example uphold the improvement
added by the overlap extension which could
potentially lead to a more correct detection of
protein complexes. However, it can be noticed that
some of the detected complexes are generated more
than once. This was anticipated. Actually, since all
essential proteins are now seeds for forming protein
complexes, the ones that share the same set of
neighbors will produce identical copies of the same
complex. In order to overcome this limitation and to
further improve the quality of the predicted
complexes, the algorithm is modified as follows:
Table 2: The complex-detection iterations corresponding
to the modified complex-detection step.
Complex-
Detection
Iteration
Essential
Protein
Complex
1 6 {6,4,5,7,16}
2 5 {5,4,6,7,16}
3 14 {14,10,11,12,13}
4 13 {13,10,11,12,14}
5 12 {12,10,11,13,14}
6 11 {11,10,12,13,14}
7 1 {1,2,3,4}
8 7 {7,5,6,16}
9 9 {9,8,10,16}
10 8 {8,9,10,16}
11 3 {3,1,4}
12 2 {2,1,4}
a. The set of detected complexes is filtered in such
a way to remove duplicates generated due to the
added overlap supposition.
b. Next, a merging procedure referred to as
Merging by Cohesiveness, is applied in the
direction of exploring more variations of the
detected complexes. All the produced complexes
are matched against each other for possible
merging. Two entities, C1 and C2, whose
percentage of overlapping essential proteins is
above a merging threshold, merging_threshold,
are merged along with their interconnections to
form a larger complex C. Then, the process
adopts the cohesiveness measure introduced in
(Nepusz et al., 2012) to assess the quality of the
resulting complex and its iteratively-extended
variants defined hereafter. The cohesiveness of a
complex C is given by equation (1):
(1)
where w
C
is the sum of the weights of edges
that are entirely contained in C, w
C is the
sum of the weights of edges that connect the
proteins belonging to C to the rest of the
network, and p is a penalty term reflecting
uncertainties in the protein interaction network.
A protein complex is viewed as an entity with
strongly-interconnected members that is well-
separated from the rest of the network. For each
protein, prot, contained in C, the set of its
neighbors, N
prot
, is formed. Then, for each
neighbor protein, n
prot
, in N
prot
, the complex
C’=C
{n
prot
} is constructed. And, if the
cohesiveness of C’ is greater or equal to the
cohesiveness of C, n
prot
is added to C. The final
complex is added to the final list of detected
ProRank+-AMethodforDetectingProteinComplexesinProteinInteractionNetworks
241

complexes. The pseudocode of merging two
complexes is presented in Table 3.
Table 3: Merging by Cohesiveness Algorithm.
Merge_by_Cohesiveness (C1, C2, merging_threshold)
ep1 = (set of essential proteins in C1)
ep2 = (set of essential proteins in C2)
if size(ep1) > size(ep2) then
larger_set = ep1
else larger_set = ep2
end if
ep = ep1 ∪ ep2
if size(ep)>size(larger_set)*merging_threshold then
C = C1 ∪ C2
for prot in C do
N_prot = (set of neighbors of prot)
for n_prot in N_prot do
C’ = C ∪ {n_prot}
if Cohesive(C’) ≥ Cohesive(C) then
C = C ∪ {
n_prot}
end if
end for
end for
end if
3 EXPERIMENTS AND RESULTS
3.1 Datasets and Evaluation Criteria
ProRank+ was tested on five large-scale protein-
protein interaction datasets associated to the yeast
microorganism. Four of the datasets consist of
weighted protein interactions, they are: Collins
(Collins et al., 2007), Krogan core and Krogan
extended (Krogan et al., 2006), and Gavin (Gavin et
al., 2006). The fifth dataset, BioGRID (Stark et al.,
2006), contains unweighted interactions. The set of
predicted complexes was matched against the MIPS
catalog of protein complexes (Mewes et al., 2000).
The datasets and the reference set of complexes
were used to evaluate the ClusterONE method and
to compare its performance with other approaches.
We also adopted the same quality scores applied in
(Nepusz et al., 2012) to assess the quality of our
algorithm. It is important to note that in their study,
the parameters of the compared algorithms were
optimized in such a way to produce best possible
outcomes. The quality scores cover: (a) the number
of complexes in the reference catalog that are
matched with at least one of the predicted complexes
with an overlap score, , greater than 0.25; (b) the
clustering-wise sensitivity (
) and (c) the
clustering-wise positive predictive value ()
which were originally introduced in (Brohée and van
Helden, 2006) to calculate the matching quality,
mainly in terms of the correctly-matched protein
members among the detected complexes; (d) the
geometric accuracy () which is the geometric
mean of
and ; and (e) the maximum
matching ratio () which reflects how
accurately the predicted complexes represent the
reference complexes by dividing the total weight of
the maximum matching by the number of reference
complexes. Given predicted complexes and
references complexes, the corresponding formulae
are given by the following equations where
represents the number of proteins that are found
in both predicted complex and reference complex
.
,
|
∩
|
|
||
|
(2)
i
n
i
ij
m
j
n
i
n
tmax
1=
1=
1=
(3)
ij
n
i
m
j
ij
n
i
m
j
t
tmax
1=1=
1=
1=
(4)
(5)
3.2 Experimental Settings of ProRank+
The steps of applying and testing ProRank+ on a
given dataset, D, and their experimental settings are:
a. Pruning: removing unreliable protein
interactions from D using the AdjustCD method
(Hon et al., 2006; Chua et al., 2008). We
experimentally set the threshold to 0.2 for
weighted datasets and to 0.45 for unweighted
datasets.
b. Filtering: identifying bridge, fjord, and shore
proteins which could add noise to the network,
as defined in (Zaki et al., 2012a).
c. Protein Ranking: a ranking algorithm, analogous
to the PageRank algorithm, is used to order the
proteins.
d. Complex Detection: all the essential proteins, i.e.
not assigned to any of the types in step b, are
seeds based on which detected complexes are
formed using the spoke model. Here, a protein
can belong to more than one complex.
BIOINFORMATICS2014-InternationalConferenceonBioinformaticsModels,MethodsandAlgorithms
242
e. Pre-processing: The set of predicted complexes
is filtered to remove possible duplicates
generated due to the overlap supposition.
f. Merging by Cohesiveness: Two detected
complexes whose overlap is above a merging
threshold of 75% are merged. The subsequent
complex is iteratively extended based on the
introduced merging procedure.
g. Post-processing: the refined set of predicted
complexes is finally filtered to remove possibly
replicated copies of complexes.
3.3 Comparison with Other Methods
The performance of ProRank+ was then compared to
other methods, applied on the same datasets and
evaluated based on the same quality scores. These
methods include ProRank (Zaki et al., 2012a) to
highlight the attained improvement, MCL (Dongen,
2000), MCODE (Bader and Hogue, 2003), CMC
(Guimei et al., 2009), AP algorithm (Frey and
Dueck, 2007), ClusterONE (Nepusz et al., 2012),
RNSC (King et al., 2004), RRW (Macropol et al.,
2009), and CFinder (Adamcsek et al., 2006). The
corresponding results scored by these approaches
(Nepusz et al., 2012) and those scored by ProRank+
are displayed in Figures 2 and 3. Note that not all the
algorithms can be applied to unweighted datasets
which explains the fewer methods that were applied
on the BioGRID dataset.
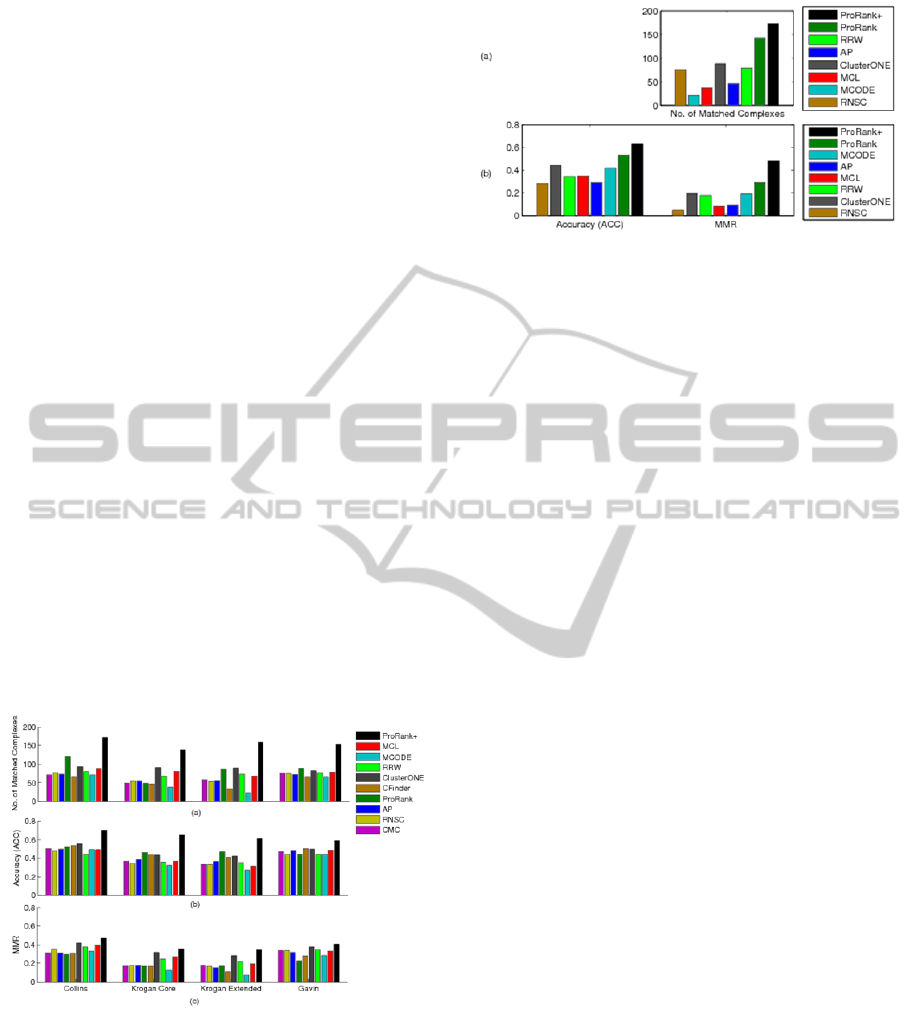
Figure 2: ProRank+ compared to ProRank, MCL,
MCODE, CMC, AP, ClusterONE, RNSC, RRW, and
CFinder using three weighted yeast datasets: Collins,
Krogan core, and Krogan extended. The comparison is in
terms of (a) the number of clusters that match the
reference complexes, (b) the geometric accuracy (Acc)
which reflects the clustering-wise sensitivity (Sn) and the
clustering-wise positive predictive value (PPV), and (c)
the maximum matching ratio (MMR).
Figure 3: ProRank+ compared to ProRank, MCL,
MCODE, AP, ClusterONE, RNSC, and RRW using the
un-weighted BioGRID dataset. The comparison is in terms
of (a) the number of clusters that match reference
complexes, and (b) the geometric accuracy (Acc) which
reflects the clustering-wise sensitivity (Sn) and the
clustering-wise positive predictive value (PPV), and the
maximum matching ratio (MMR).
The experimental results show that ProRank+
was able to detect a higher number of protein
complexes when matched with the reference set.
ProRank+ achieved higher clustering-wise
sensitivity (
), geometric accuracy () and
maximum matching ratio () for all the
considered datasets. However, it could not surpass
the clustering-wise positive predictive value ()
of ProRank which was the highest for all datasets.
This can be justified by the fact that tends to be
lower when the overlaps among the detected
complexes are substantial. values may not
always reflect the competence of a certain method
and the geometric accuracy () can be negatively
affected by the predicted complexes that do not
match any of the reference complexes. Accordingly,
the measure (Nepusz et al., 2012) was
introduced to overcome such limitations by dividing
the total weight of the maximum matching with the
number of reference complexes. The values
achieved by ProRank+ are in the favor of the
proposed algorithm.
4 CONCLUSIONS
In this paper, we presented ProRank+, an effective
method for detecting overlapping protein complexes
in protein interaction networks. A ranking algorithm
is used to identify key proteins in the network and a
merging procedure is introduced in the direction of
refining the detected complexes. When tested on
weighted and unweighted datasets, ProRank+ was
able to detect more complexes than several state-of-
the-art methods with higher quality scores. As future
ProRank+-AMethodforDetectingProteinComplexesinProteinInteractionNetworks
243

work, we plan to test the method on various
biological networks. In addition, we look to extend
the approach in such a way to reflect the dynamic
nature of protein interaction networks.
ACKNOWLEDGEMENTS
The authors would like to acknowledge the
assistance provided by the National Research
Foundation (NRF Grant Ref. No. 21T021) and the
Research Support and Sponsored Projects Office at
the United Arab Emirates University (UAEU).
Thanks to Dr. Jose Berengueres for his helpful
information regarding the ProRank software.
REFERENCES
Adamcsek, B., Palla, G., Farkas, I. J., et al. 2006. CFinder:
locating cliques and overlapping modules in biological
networks. Bioinformatics 22:8, 1021-1023.
Bader, G. D., and Hogue, C. W. V. 2003. An automated
method for finding molecular complexes in large
protein interaction networks. BMC Bioinformatics 4:2.
Brohée, S., and van Helden, J., 2006. Evaluation of
clustering algorithms for protein-protein interaction
networks. BMC Bioinformatics 7:488.
Bryan, K., and Leise, T. 2006. The $25,000,000,000
eigenvector: the linear algebra behind Google. SIAM
Review 48:3, 569-581.
Chua, H. N., Ning, K., Sung, W. K., et al. 2008. Using
indirect protein-protein interactions for protein
complex prediction. J. Bioinformatics and
Computational Biology 6:3, 435-466.
Collins, S. R., Kemmeren, P., Zhao, X. C., et al. 2007.
Toward a comprehensive atlas of the physical
interactome of saccharomyces cerevisiae. Mol. Cell.
Proteomics 6:3, 439-450.
Dongen, S. 2000. Graph clustering by flow simulation
[Ph.D. dissertation]. University of Utrecht,
Amsterdam.
Frey, B. J., and Dueck, D. 2007. Clustering by passing
messages between data points. Science 315: 5814,
972-976.
Gavin, A. C., Aloy, P., Grandi, P., et al. 2006. Proteome
survey reveals modularity of the yeast cell machinery.
Nature 440, 631-636.
Guimei, L., Wong, L., and Chua, H.N. 2009. Complex
discovery from weighted PPI networks.
Bioinformatics 25:15, 1891-1897.
Hodgkin, J. 1998. Seven types of pleiotropy. Int. J. Dev.
Biol. 42:3, 501-505.
Hon, N. C., Sung, W. K., and Wong, L. 2006. Exploiting
indirect neighbours and topological weight to predict
protein function from protein-protein interactions.
Bioinformatics 22:13, 1623-1630.
Hong, E. L., Balakrishnan, R., Dong, Q., et al. 2008. Gene
ontology annotations at SGD: new data sources and
annotation methods. Nucleic Acids Res. 36:suppl. 1,
577-581.
Ishii, H., and Tempo, R. 2010. Distributed randomized
algorithms for the Pagerank computation. IEEE Trans.
Automatic Control 55:9, 1987-2000.
King, A. D., Przulj, N., and Jurisica, I. 2004. Protein
complex prediction via cost-based clustering.
Bioinformatics 20:17, 3013-3020.
Kopp, F., Dahlmann, B., and Kuehn, L. 2001.
Reconstitution of hybrid proteasomes from purified
pa700-20 S complexes and pa28alphabeta activator:
ultrastructure and peptidase activities. J. Mol. Biol.
313:3, 465-471.
Krogan, N. J., Cagney, G., Yu, H., et al. 2006. Global
landscape of protein complexes in the yeast
saccharomyces cerevisiae. Nature 440, 637-643.
Langville, A. N., and Meyer, C. D. 2006. Google's
PageRank and Beyond: The Science of Search Engine
Rankings. Princeton University Press, USA.
Liou, A. K., and Willison, K. R. 1997. Elucidation of the
subunit orientation in cct (chaperonin containing tcp1)
from the subunit composition of cct micro-complexes.
EMBO J. 16, 4311-4316.
Macropol, K., Can, T., and Singh, A. K. 2009. RRW:
repeated random walks on genome-scale protein
networks for local cluster discovery. BMC
Bioinformatics 10: 283.
Mewes, H. W., Frishman, D., Gruber, C., et al. 2000.
MIPS: a database for genomes and protein sequences.
Nucleic Acids Res. 28:1, 37-40.
Mewes, H. W., Amid, C., Arnold, R., et al. 2004. MIPS:
analysis and annotation of proteins from whole
genomes. Nucleic Acids Res. 32:suppl. 1, 41-44.
Nakao, A., Yoshihama, M., and Kenmochi, N. 2004. Rpg:
the ribosomal protein gene database. Nucleic Acids
Res. 32:suppl. 1, D168-D170.
Nepusz, T., Yu, H., and Paccanaro, A. 2012. Detecting
overlapping protein complexes in protein-protein
interaction networks. Nature Methods 9, 471-472.
Przulj, N., Wigle, D. A., and Jurisica, I. 2004. Functional
topology in a network of protein interactions.
Bioinformatics 20:3, 340-348.
Shain, A. H., and Pollack, J. R. 2013. The spectrum of
SWI/SNF mutations, ubiquitous in human cancers.
PLosONE 8:1:e55119.
Stark, C., Breitkreutz, B.J., Reguly, T., et al. 2006.
BioGRID: A general repository for interaction
datasets. Nucleic Acids Res. 34:suppl. 1, D535-D539.
Zaki, N. M., Berengueres, J., and Efimov, D. 2012(a).
Detection of protein complexes using a protein
ranking algorithm. Proteins: Structure, Function, and
Bioinformatics 80:10, 2459-2468.
Zaki, N. M., Berengueres, J., and Efimov, D. 2012(b).
Prorank: A method for detecting protein complexes.
Proceedings of the 14th international conference on
Genetic and Evolutionary Computation Conference
(GECCO '12), 209-216.
BIOINFORMATICS2014-InternationalConferenceonBioinformaticsModels,MethodsandAlgorithms
244
