
Fuzzy-based Routing Metrics Combination for RPL
Patrick Olivier Kamgueu
1,2
, Emmanuel Nataf
2,3
, Thomas Djotio
1
and Olivier Festor
2,3
1
University of Yaound´e I, LIRIMA - Masecness project, Yaound´e, Cameroon
2
Universit´e de Lorraine, Nancy, France
3
INRIA - Madynes project, Nancy, France
1 INTRODUCTION
The routing protocol is a key functionality of any
communication network, it must support effective
transport of data from one point to another in the net-
work. Due to the many opportunities that they offer,
these recent years, Wireless Sensor Networks (WSN)
are the subject of a growing interest for industrial and
scientific communities. Such environment must face
with severe constraints, such as fragile nodes with
low energy capabilities, low data rate over a sharing
medium with unstable and lossy transmission links.
WSN protocol designers must take into account many
parameters and challenges different from those of tra-
ditional wired networks.
It is in this context that the Internet Engineering
Task Force
roll
working group was chartered a few
years ago, to design a routing protocol for Low-Power
and Lossy Network (Winter et al., 2012). Very re-
cently, the later has started to provide their results:
the IPv6 Routing Protocol for Low-Power and Lossy
Network (RPL) and other companiondocuments. The
protocol was designed with the purpose of separating
the packet processing and forwarding from the rout-
ing optimization goal. A number of metrics (Vasseur
et al., 2012) are intended to be included by the pro-
tocol during the network topology building phase,
implemented as an objective function. So far, only
two objective functions are specified: one using the
hop-count as routing metric also called
of0
(Thubert,
2012), the other making use of the expected number
of transmission needed to successfully send a packet
to its destination (ETX) namely
Minimum Rank with
Hysteresis Objective Function
(Gnawali and
Levis, 2012). Use of other defined criteria are left
to implementer, also the possibility of combining sev-
eral metrics into one, to ensure quality of service or
meet application requirements, is not well-addressed.
This problem, including for RPL protocol has al-
ready been investigated in the literature (Karkazis
et al., 2012), and falls into two forms of combina-
tion: additive and lexicographic. In this paper we
propose to take advantage of fuzzy logic to solve
it. This approach is motivates by the fact that, us-
ing this paradigm, with a small memory footprint,
we can seek for a halfway between several criteria,
even antagonistic. Contrary, with the two aforemen-
tioned method, metrics must follow the same direc-
tion (growing or decreasing).
The remainder of the paper is organized as fol-
lows. Section 2 presents related works on combining
metrics for routing in WSN, as well as works that use
fuzzy inference system for routing design. Section 3
describes an overview of RPL protocol. In section
4, we detail the proposed objective function design,
followed by implementation parameters, experiment
results and discussions in section 5. Finally, we con-
clude and discusses future directions in section 6.
2 RELATED WORK
The diversity of applications that WSN are called to
support imposes different requirements on the under-
lying network with respect to delay, loss and energy
criteria. That is why (Karkazis et al., 2012) propose
to use additive and lexicographic composition to op-
timize more than one performance aspect. In the ad-
ditive approach, the composite metric is written as a
linear combination of basic metrics (M =
∑
i
α
i
m
i
).
The main shortcoming of this scheme is that the basis
metrics must necessarily be defined on the same order
relation, thereby restricting the type of metrics to be
considered. The lexicographic approach overcomes
this, but its drawback is that basic metrics are evalu-
ated sequentially, the next is taken into account only
to break the tie. So that, some metrics are frequently
not take into consideration.
For instance, Link Estimation and Parent Selec-
tion protocol (Yan and Sun, 2007) uses hop-count and
Link Quality Indicator (LQI) in lexicographic man-
ner to select the next hop. The source node selects
the neighbouring node which has the minimum hop
to the sink node as its next hop node. If there is more
11
Kamgueu P., Nataf E., Djotio T. and Festor O..
Fuzzy-based Routing Metrics Combination for RPL.
Copyright
c
2014 SCITEPRESS (Science and Technology Publications, Lda.)

than one node having the minimum hops, the one
which has the largest LQI is chosen. The main dis-
advantage of this protocol is the early death of nodes
and the unbalanced energy dissipation. To overcome
this, RPLRE (Yan et al., 2009) based as the previ-
ous on LQI and hop-count, suggests to take into ac-
count probability selection and additionally residual
energy when choosing next hop node. This improves
the latter by avoiding to select the same node more
often. The result is a more balanced energy consump-
tion among potential parent of a given node, and the
network lifetime is thereby extended.
(Aslam et al., 2004) propose a composite metric
that uses multiple parameters to find optimal route,
given the QoS constraints for Optimized Link State
Routing (OLSR) protocol. This routing is natively
based on hop-count. The objective of this composite
metric is to find an optimal path with maximum avail-
able bandwidth and minimum delay and jitter. The
latter is computed as a linear combination of the given
parameters.
In (Heo et al., 2009), authors proposed EARQ, a
novel routing protocol for wireless industrial sensor
networks. The protocol provides real-time, reliable
delivery of a packet while considering energy aware-
ness. The path with the lower energy cost is selected
according to a probabilistic model, in addition only
paths that may deliver packets in time are selected to
achieve real-time requirement. Source node may send
a redundant packet via alternate path if the reliabil-
ity is not meet. Contrary to previous methods, EARQ
consider these three criteria (energy, latency and relia-
bility) separately, instead of a single combined metric.
Moreover, protocol supposes that every node knows
it location and rely on a GPS mechanism or location
process for that, but this not always the case for many
WSN deployment.
There are many growing interest of integration
of artificial intelligence technologies like fuzzy rule-
based systems to design protocols for WSN. GAFO
(Ghataoura et al., 2009) uses a genetic adaptive fuzzy
hop selection scheme, to make optimal choices for ro-
bust packet transmission in WSN involved in varying
channel conditions. The paper describes a fuzzy sys-
tem engine that takes signal to noise ratio and outage
probability as input, to determine the possibility of a
neighbour node to be selected as the next hop for data
forwarding. Experiments show that in the same con-
ditions, this protocol outperforms the crisp approach
on average by 20% for reliability and 15% for total
energy consumption.
A cluster head election method using fuzzy logic
has been introduced by (Gupta et al., 2005) to over-
come the defect of LEACH (Heinzelman et al., 2000),
a popular cluster head selection technique. The main
idea of LEACH protocol is that node are elected de-
pending on a stochastic model and uses localized
clustering. The consequence is that some cluster
heads may be very close to each other or may be
located in the edge of the WSN. This careless clus-
ter heads distribution could not maximize energy ef-
ficiency. Other schemes (Basirnezhad and Torshiz,
2011; Ran et al., 2010) were proposed to improve
election process involved on LEACH. Those have
proved that the network lifetime can be efficiently
prolonged using fuzzy variables (concentration, en-
ergy and node centrality). Unfortunately, LEACH is
not applicable to networks deployed in large regions,
since it uses single-hop routing where node can trans-
mit data directly to cluster head, afterwards the latter
transmit data to the sink.
EDARP (Zeynali et al., 2009) is another work tar-
geting the routing plane. Contrary to LEACH were
each cluster head directly sends data to sink, proto-
col establishes a Fuzzy Spanning Tree that uses the
energy and distance to construct a routing path over
all cluster heads. These two criteria is used to gener-
ate a fuzzy election number and lead to the selection
of the best parent into the routing tree. EDARP bal-
ance energy consumption among all nodes by keeping
rotation in cluster head election, and parent’s node se-
lection in whole lifespan of the network.
Unlike the previous protocols that uses a clus-
tering mechanism to build a hierarchical topology,
FEAR (Almomani and Saadeh, 2011), directly build
a logical tree topology between network nodes. They
aim to enhance the existing tree-based routing in
terms of reducing the number of hops and solving
the problem of node/link failure. The protocol uses
a ranking system based on fuzzy inference so that
nodes rank their neighbours considering both neigh-
bours depth and power. The fuzzy ranking system
is used to construct and maintain the tree topology.
Compared to RPL, FEAR generates more control
messages which implies a greater power consump-
tion, since communication operations are the more
power consumer. In addition, the protocol uses a node
identification (ID) construction model where a node’s
ID is computed based on the node’s parent ID. Thus
when a parent node dead, all nodes in its subtree must
recomputed their ID as soon as a new parent is found,
involving more processing and communication oper-
ations.
SENSORNETS2014-DoctoralConsortium
12

3 RPL OVERVIEW
RPL (Winter et al., 2012) is a distance vector rout-
ing protocol optimized for low power and lossy net-
work where multipoint-to-pointis the dominant traffic
pattern. The protocol also support point-to-multipoint
traffic pattern using destination advertisement mecha-
nism, and provide a basic structure for point-to-point
route. The network topology is organized as one
or more Destination Oriented Direct Acyclic Graph
(DODAG) each rooted at a single point, that act as
sinks for the topology. Three new types of ICMP mes-
sages are defined and manipulated:
• DODAG Information Object (DIO) used to create
and maintain upwards routes.
• DODAG Destination Advertisement Object
(DAO) used to install downwards routes.
• DODAG Information Solicitation (DIS) actively
used by a node wishing to join the network or ask-
ing for more recent informations.
The topology building starts at the root (initially, the
only router which is part of a DODAG), that sends
DIO messages in its neighbourhood. This message
contains all common configuration parameters, in-
cluding root ID, mode of operation, timers values, etc.
Upon receipt of a number of such messages, neigh-
bour nodes may participate in the DODAG according
to the objectivefunction (
OF
), select theirs parents and
then start emitting their own DIO messages. This pro-
cess spreads gradually to cover the whole network as
new nodes join the DODAG. Only one node among
parent’s nodes (the preferred parent) acts as the next-
hop on the path towards the root.
RPL pro-actively creates and maintains the topol-
ogy, by regularly sending ICMP control messages
in the vicinity. The frequency of these exchanges
are governed by the trickle algorithm (Levis et al.,
2011), that reduce the overhead induced by control
messages. This is done by sending DIO less often
when the topology is steady, but reacts and propagates
rapidly informations on topology change or when in-
consistencies are detected.
An important point is when a node received more
than one consistent DIO, each from a different neigh-
bour and must choose which is the preferred parent.
This choice is governed by the objective function that
specifies how the node selects the best parent into the
parent set, and calculates its own rank (the relative po-
sition with respect to the root) from the parent’s rank.
Different criteria also called routing metrics are de-
fined (Vasseur et al., 2012) to capture link or node
characteristics on the path for parent selection. The
rank calculation is derived from the set of these se-
lected metrics, and must monotonically decrease as
we move toward the root. This last property enables
the routing structure to maintain its acyclic nature and
helps to avoid routing loops.
Unlike existing
OF
s (Gnawali and Levis, 2012;
Thubert, 2012) that use only one metric to construct
the DODAG, we want to integrate QoS into RPL by
taking into account more than one performance as-
pect. The next section shows how we design such
OF
using fuzzy inference system.
4 ROUTING METRIC DESIGN
4.1 Fuzzy Inference System
Fuzzy logic reasoning allows us to transform sev-
eral input variables (delay, ETX and energy) into one
(Quality). The fuzzy inference system consists on
several steps.
• Fuzzification: take a crisp value input and deter-
mine its degree of membership (fuzziness) for the
appropriate fuzzy sets.
• Fuzzy inference: Apply combination rules to
fuzzified inputs and compute a fuzzy output.
• Aggregation: If an output depends on more than
one rule, this step unifies all values into one.
• Defuzzification: Convert the fuzzy output ob-
tained at the previous step into a crisp value.
In this paper, due to its simplicity and efficiency, we
use the most common fuzzy inference method named
Mamdani model (Mamdani, 1977).
4.2 Composite Metric Design
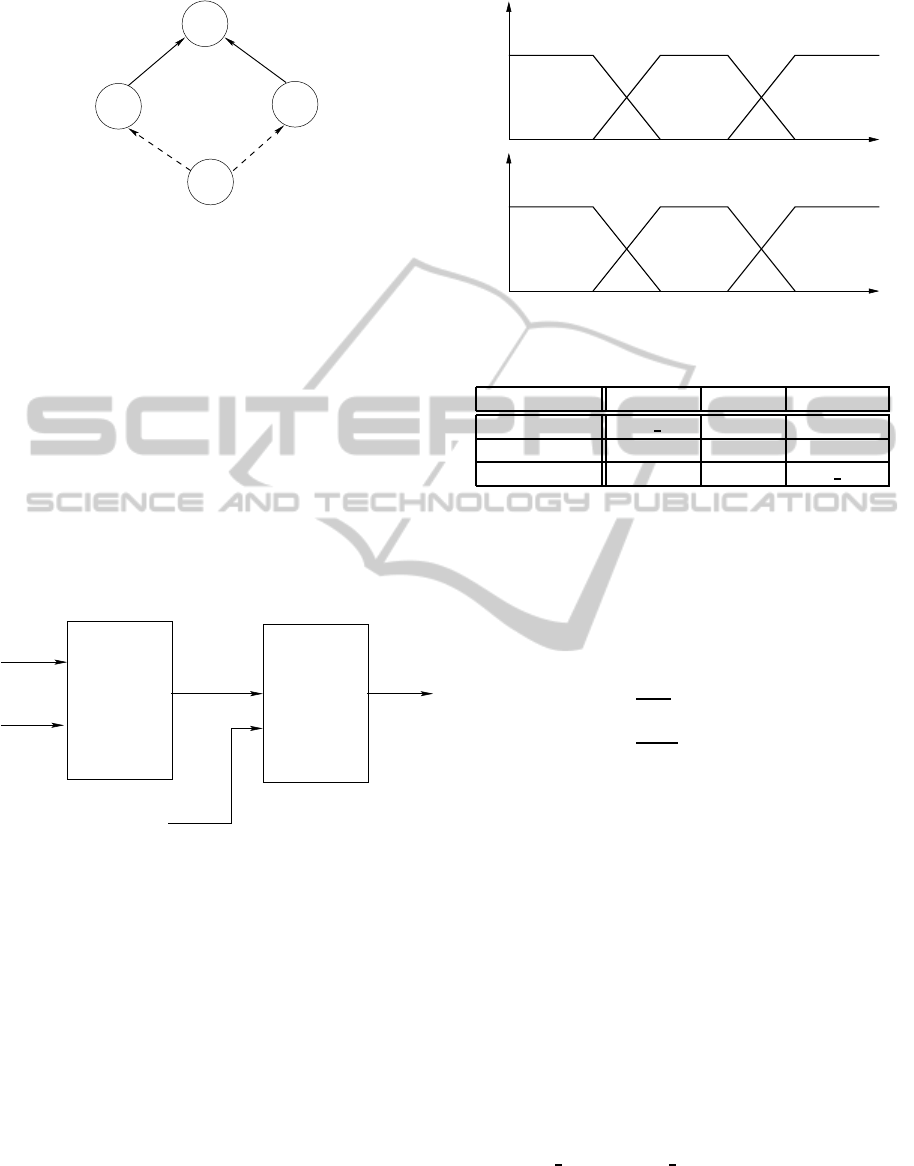
In order to illustrate the mechanism of fuzzy logic
composition, we consider the network topology de-
picted in the figure 1. Node N, in order to send data to
the destination S, must select the next hop (between
P1 and P2) as parent. This choice is governed by re-
ceived informations as shown, according to the fuzzy
inference engine.
4.2.1 Linguistic Variables
Node’s performances knowledge are represented as
linguistic variables:
• ETX - The expected number of required transmis-
sions before a packet reaches the destination.
• Delay - The average time for a packet to reach its
destination.
Fuzzy-basedRoutingMetricsCombinationforRPL
13
ETX=4
ENERGY=75%
ETX=2
ENERGY=70%
N
?
S
DELAY=1000
DELAY=700
P2
P1
Figure 1: Parent Selection Process.
• Energy - The energy cost of the path, also energy
of the node having the smallest remaining battery
level on the path.
We use cross-layer mechanisms to retrieve ETX and
delay from data link and network layers. Node’s en-
ergy is estimated based on the real-time energy es-
timation model described by (Rahm´e and Fourthy,
2010) and implemented by (Nataf and Festor, 2013).
4.2.2 Fuzzification Process
To avoid the complexity of combining directly three
variables into one, we perform the fuzzification pro-
cess in two stages, as shown in the figure 2.
Second Stage
Fuzzy Inference
Engine
First Stage
Fuzzy Inference
Engine
Delay
ETX
Quality
QoS
Energy
Figure 2: Fuzzy Inference Engine.
First Stage Fuzzification
On the first stage, we combine delay and ETX as in-
put to compute QoS which is taken in its turn as in-
put for the next stage. The linguistic variables used
to represent delay are divided into
small, average
and
high
membership functions, and ETX fall into
short, average
and
long
. Figure 3 depicts their
membership functions parameterized by the number
of hops (hc) upwards to the sink, as delays (respec-
tively ETX) are comparable only at the same hop
count.
Table 1 illustrates the relationship between these
two linguistic variables for the computation of QoS.
So, short is the ETX and small is the delay, better is
the QoS to consider.
ETX
short longaverage
0.5
1
Delay
0.5
1
small average high
0
0
3*hc 6*hc 9*hc 12*hc
600*hc 1200*hc 1800*hc 2400*hc
Figure 3: Membership functions.
Table 1: QoS Output Metric.
ETX / Delay small average high
short very fast fast average
average fast average slow
long average slow very slow
For instance, considering a crisp value ETX, for-
mula 1 indicates how is its the level of membership
in the
average
fuzzy set, for one hop (ie. hc = 1).
Similar formulas establish the level of membership
for others ETX fuzzy sets, as well as delay and en-
ergy linguistic variables.
average(etx) =
0 if etx ≤ 3
etx−3
6−3
if 3 < etx < 6
1 if 6 ≤ etx ≤ 9
etx−12
9−12
if 9 < etx < 12
0 if etx ≥ 12
(1)
For the example given in figure 1, node N com-
putes as level of membership
short(etx)=0.66,
average(etx)=0.33
, and
long(etx)=0
for the
parent node P1. Same types of computations for P1’s
delay allow us to determine as respective fuzzy sets
small
,
average
and
high
, the values
0.83, 0.16
and
0
.
Since QoS relates to ETX and delay, the previously
computed membership functions are combined ac-
cording to table 1. The Mamdani model allows
us to use the minimum operator as the composition
function, and maximum as the aggregation operator.
For instance, formula 2 indicates how to compute
average(QoS)
fuzzy set from inputs. In the same
way, we establish formulas for fuzzy sets ranging
from
very fast
to
very slow
.
avg(QoS) = max
min(long(etx), small(dly)
min(avg(etx),avg(dly))
min(short(etx,high(dly))
(2)
SENSORNETS2014-DoctoralConsortium
14

For the topology in figure 1, node N computes
three non-zero QoS membership functions con-
cerning neighbour P1:
very fast(QoS)=0.66,
fast(QoS)=0.33
, and
average(QoS)=0.16
. These
values are defuzzified (following procedure in §4.2.3)
into a single QoS output (
QoS=0.78
), and then used
in the next fuzzification stage.
Second Stage Fuzzification
As the second stage of the fuzzy inference system,
we combine the previously computed QoS with the
energy linguistic variable to provide Quality. For a
given node, energy could be
low
,
medium
or
full
,
and the output values for Quality is divided into seven
levels ranging from
awful
to
excellent
. Table 2
shows how to derive Quality based on QoS and en-
ergy.
Table 2: Quality Output Metric.
QoS / Energy low medium full
very slow awful bad average
slow bad degraded average
average degraded average acceptable
fast average acceptable good
very fast average good excellent
4.2.3 Defuzzification Process
88
80
746660
52
4638
32
24
18
10
0.5
1
0
awful
accept.
good
excellentbad
degr.
avg
Figure 4: Quality defuzzification.
All fuzzy values obtained after aggregation step
are converted into a single crisp output. The most
common and accurate defuzzication method uses
the centroid, where the result is the center of gravity
of the polygon drawn using fuzzy values of the
output membership function. Figure 4 illustrates the
defuzzification process for Quality linguistic variable.
Output values range from 0 to 100 and indicate how
is the level of quality to choose a neighbour as the
next hop, according to the selected metrics.
For the proposed topology, three member-
ship functions are fired as P1 Quality output,
accept(Quality)=0.25
,
good(Quality)=0.70
,
and
excellent(Quality)=0.30
. The center of
gravity for the depicted region is
77
. Similar compu-
tations produce the value
70
for P2. So, the best next
hop for N according to three criteria (ETX, delay and
energy) is P1.
5 EXPERIMENTS RESULTS
5.1 Network Model and Assumptions
To evaluate the proposed combined metric, sim-
ulations were performed on Cooja (Osterlind and
Dunkels, 2006) that emulate real nodes running Con-
tiki OS code. Twenty nodes are randomly scattered
in the environment of interest (60 × 60 m
2
2D-grid)
without any isolation. All sensor nodes have the same
capabilities, the same transmission range set to 20 m,
with 30 m of interference range, and limited power
resources. Sensor nodes, located in fixed places with-
out mobility, sense data and transmit it to the sink for
processing at regular time interval. Sink node is as-
sumed to have unconstrained resources. We use as
layer 2, ContikiMAC (Dunkels, 2011) that operated
on top of IEEE 802.15.4 with non-persistent CSMA
and provides power efficiency by nodes keeping their
radios turned off for roughly 99% of the time. Table 3
summarizes other setups parameters.
Table 3: Network Setups.
Settings Value
Wireless channel model Unit Disk Graph Medium w/ Distance Loss
Communication range 20 m (Tx/Rx), 30 m (Interf.)
Mote type Tmote sky
Transport Layer UDP
Network Layer µIPv6 + 6LoWPAN
MAC Layer non-persistent CSMA + ContikiMAC
PHY + Radio Layer IEEE 802.15.4 w/ CC2420
5.2 Performance Evaluation
We have performed a data collection application. Two
scenarios are developed, in the first the RPL routing
topology is organized according to the native ETX
metric, while the second scenario uses the proposed
combined metric according to the fuzzy inference en-
gine. Data are sent to the sink periodically, several
tests are launch at various data emission rates, rang-
ing from one to twenty application data packets per
minute. Collect application is run for 48 hours, all
sensor nodes start with the same battery level. We are
interested in the network lifetime by looking at energy
depletion of nodes. So the latter is considered as the
time on which the first node has completely exhausted
its battery (Dietrich and Dressler, 2009). We also es-
timate the packet reception rate at the sink node, as it
measures the transmission accuracy.
Fuzzy-basedRoutingMetricsCombinationforRPL
15
5
10
15
20
25
30
62 63 64 65 66 67 68 69 70 71 72 73 74 75 76 77 78 79 80 81 82 83 84 85 86 87 88 89
Nodes (%)
Remaining Energy (%)
Throughput: 12pkts/min
ETX
Fuzzy
5
10
15
20
25
30
72 73 74 75 76 77 78 79 80 81 82 83 84 85 86 87 88 89 90 91 92
Nodes (%)
Remaining Energy (%)
Throughput: 5pkts/min
ETX
Fuzzy
(a) (b)
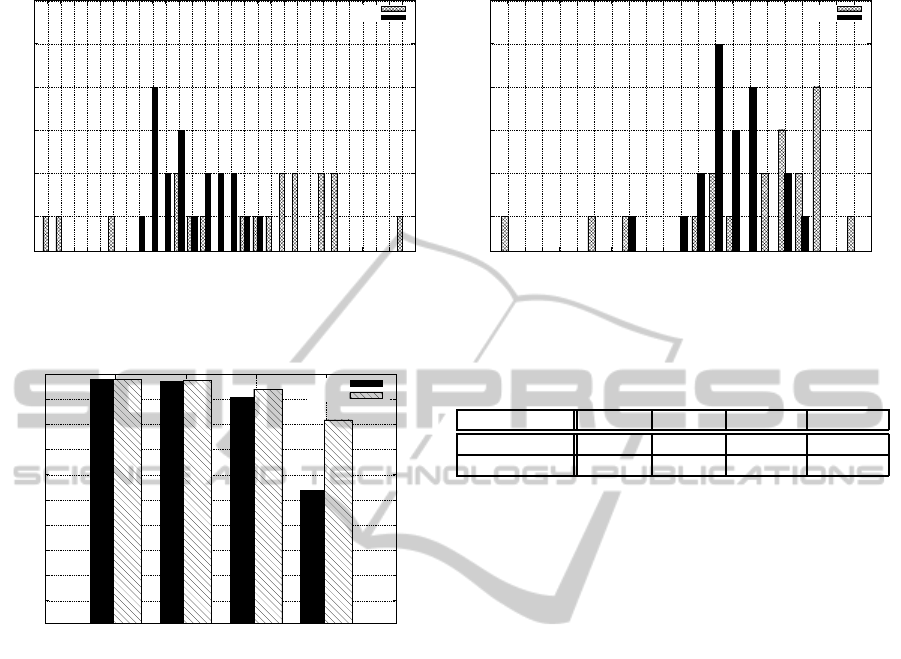
Figure 6: Battery Distribution.
10
20
30
40
50
60
70
80
90
100
1 5 12 20
Receive ratio (%)
Emission interval (pkt/min)
ETX
Fuzzy
Figure 5: Reception ratio at sink node.
5.2.1 Packet Reception Ratio
Experiments show that for high transmission rates,
the combined metric scenario obtain better reception
ratio, as depicted by figure 5 at a rate of 12 and 20
packets per minute. When transmission rate is low
(one or five packets per minute), both scenarios be-
have roughly in the same way, although the combined
metric scenario obtain slightly better results. This
is justified by the fact that, at high transmission rate
nodes are faced with more data traffic, thus there is
more noise and contention in the network. The com-
bined metric scenario, as ETX scenario, selects nodes
with high expected transmission count, but in addition
the former favors the least overloaded nodes, since la-
tency takes into account buffer size and contention
at the MAC layer. To see this observation in more
details, table 4 presents packet loss rates for various
emission interval. One can note that, at 20 packets per
minute, the single metric scenario loses packets more
than twice compared to the combined metric scenario.
Table 4: Packet Loss Ratio.
Scenario / Freq. 1pkt/min 5pkt/min 12pkt/min 20pkt/min
ETX 2.32% 3.05% 9.40% 46.26%
Fuzzy combined 2.20% 2.64% 6.06% 18.29%
5.2.2 Energy Exhaustion
We assess the energy distribution on the network dur-
ing the routing topology construction. Ideally, we
would like to delay as much as possible when the
first network node dies, this means for the routing
protocol to better balance the energy distribution of
nodes (Kamgueu et al., 2013). As shown by the fig-
ure 6, at 12pkts/min (fig. 6-a) the combined metric
scenario have nodes whose batteries levels range be-
tween 69% − 78%, while the same range is 62% −
89%. Furthermore, 15% of nodes in the single met-
ric routing have their remaining power lower than the
weakest node in the second scenario. These obser-
vations are roughly the same at 5pkts/min (fig. 6-b).
The combined metric routing achieved the goal, since
node’s energy dispersion is lower than the native ETX
scenario, also it better delay the first node death. This
observation is more accentuated for higher packet
emission rates, as nodes exhaust their battery more
quickly. This result is not surprising since the combi-
nation in addition to others criteria, takes energy into
account while the native objective function don’t care
about that.
6 CONCLUSIONS
In this paper we designed and implemented a new
objective function for IPv6 routing protocol for low
power and lossy network. The proposed solution aims
SENSORNETS2014-DoctoralConsortium
16

to optimize more than one network performance as-
pects. We used fuzzy inference system to combined
expected transmission count, delay and node’s re-
maining power into one unique value. Experiment
results show that the combined metric objective func-
tion obtains better results, compared to the ETX sce-
nario, both for network energy distribution and packet
reception rates. These results are more highlighted as
soon as the data traffic is heavy in the network.
Currently we perform intensive simulations for
longer durations, we aim to measure more precisely
the influence of latency and jitter on the routing. In
our future work, we envision to parameterize the con-
tribution of each metric to fuzzy combination and as-
sess its impacts on the routing. Moreover we plan
to implement other forms of metric combinations
(namely lexicographic and additive approaches) and
compare their simulation results with those obtained
with the fuzzy logic.
REFERENCES
Almomani, I. M. and Saadeh, M. K. (2011). Fear: fuzzy-
based energy aware routing protocol for wireless sen-
sor networks. International Journal of Communica-
tions, Network and System Sciences, 4:403–415.
Aslam, N., Phillips, W., and Robertson, W. (2004). Com-
posite metric for quality of service routing in olsr. In
Proc. of Canadian Conference on Electrical and Com-
puter Engineering, pages 759 – 762, Niagara Falls
Ontario, Canada.
Basirnezhad, M. and Torshiz, M. N. (2011). Energy effi-
cient cluster head election using fuzzy logic in wire-
less sensor networks. International Journal of Com-
puter Science and Information Security, 9(5):255–
260.
Dietrich, I. and Dressler, F. (2009). On the lifetime of wsn.
ACM: Trans. on Sensor Networks, 5.
Dunkels, A. (2011). The contikimac radio duty cycling pro-
tocol. Technical Report ISBN 1100-3154, SICS.
Ghataoura, D. S., Yang, Y., and Matich, G. (2009). Gafo:
genetic adaptive fuzzy hop selection scheme for wire-
less sensor network. In Proc. of 5th IEEE Interna-
tional Wireless Communication and Mobile Comput-
ing conference (IWCMC), Leipzig, Germany.
Gnawali, O. and Levis, P. (2012). The Minimum Rank with
Hysteresis Objective Function. RFC 6719 (Proposed
Standard).
Gupta, I., Riordan, D., and Sampalli, S. (2005). Cluster-
head election using fuzzy logic for wireless sensor
networks. In Proc. of 3rd IEEE Annual Communi-
cation Networks and Services Research Conference,
Halifax, Canada.
Heinzelman, W., Chandrakasan, A., and Balakrishnan, H.
(2000). Energy-efficient communication protocol for
wireless microsensor networks. In Proc. of 33rd
Hawaii International Conference on System Sciences
(HICSS), pages 3005–3014.
Heo, J., Hong, J., and Cho, Y. (2009). Earq: Energy aware
routing for real-time and reliable communication in
wireless industrial sensor networks. IEEE Trans. on
Industrial Informatics, 5(1):3 – 11.
Kamgueu, P., Nataf, E., Djotio, T., and Festor, O. (2013).
Energy-based metric for the routing protocol in low-
power and lossy network. In Proc. of 2nd Sensornets,
Barcelona, Spain.
Karkazis, P., Leligou, H. C., Trakadas, P., and Velivas-
saki, T. H. (2012). Design of primary and compos-
ite routing metrics for rpl-compliant wireless sensor
networks. In Proc. of International Conference on
Telecommunications and Multimedia (TEMU), pages
13 – 18, Chania, Greece.
Levis, P., Clausen, T., Hui, J., Gnawali, O., and Ko, J.
(2011). The Trickle Algorithm. RFC 6206 (Proposed
Standard).
Mamdani, E. H. (1977). Application of fuzzy logic to ap-
proximate reasoning using linguistic synthesis. IEEE
Transaction on Computing, C-26(12):1182 – 1191.
Nataf, E. and Festor, O. (2013). Online estimation of battery
lifetime for wireless sensors network. In Proc. of 2nd
Sensornets, Barcelona, Spain.
Osterlind, F. and Dunkels, A. (2006). Cross-level sensor
network simulation with cooja. In Proc. of 31st IEEE
Conf. SenseApp, pages 641 – 648, Tampa, Florida.
Rahm´e, J. and Fourthy, N. (2010). Energy management for
battery-powered embedded systems. In Proc. of IEEE
WCNC, pages 277 – 324, Sydney.
Ran, G., Zhang, H., and Gong, S. (2010). Improving on
leach protocol of wireless sensor networks using fuzzy
logic. Journal of Information & Computational Sci-
ence, 7(3):767–775.
Thubert, P. (2012). Objective Function Zero for the Routing
Protocol for Low-Power and Lossy Networks (RPL).
RFC 6552 (Proposed Standard).
Vasseur, J., Kim, M., Pister, K., Dejean, N., and Barthel,
D. (2012). Routing Metrics Used for Path Calcula-
tion in Low-Power and Lossy Networks. RFC 6551
(Proposed Standard).
Winter, T., Thubert, P., Brandt, A., Hui, J., Kelsey, R.,
Levis, P., Pister, K., Struik, R., Vasseur, J., and
Alexander, R. (2012). RPL: IPv6 Routing Protocol
for Low-Power and Lossy Networks. RFC 6550 (Pro-
posed Standard).
Yan, C., Hu, J., Shen, L., and Song, T. (2009). Rplre: A
routing protocol based on lqi and residual energy for
wireless sensor networks. In Proc. of International
Conference on Information Science and Engineering
(ICISE), pages 2714 – 2717, Nanjing, China.
Yan, T. and Sun, L. (2007). Principle and performance eval-
uation of routing protocol in tinyos. Trans. on Com-
puter Engineering, 33(1):112 – 114.
Zeynali, M., Khanli, L. M., and Mollanejad, A. (2009).
Edarp : novel energy and distance-aware routing pro-
tocol in wireless sensor network. In IEEE, editor, 2nd
ICIS : Information Technology, Culture and Human,
Seou, Korea.
Fuzzy-basedRoutingMetricsCombinationforRPL
17
