
Student Course Evaluation
Class Size, Class Level, Discipline and Gender Bias
Jacob Kogan
Department of Mathematics and Statistics, UMBC, Baltimore, MD 21250, U.S.A.
Keywords:
World Wide Web, Student Course Evaluation Questionnaire, Instructor Mean, Level Mean, Discipline Mean.
Abstract:
Based on approximately 25,000 Student Course Evaluation Questionnaires (SCEQ) covering 16 semesters
from Spring 2005 through Fall 2012 and publicly available at the University of Maryland, Baltimore County’s
website http://www.umbc.edu/oir/sceq/index.html, we analyze the effect of class level and discipline on stu-
dent responses. We compare the results obtained and conclusions drown with those already reported in the
literature.
1 INTRODUCTION
The standard assumption is that Student Course Eval-
uation Questionnaires are a basic tool for instruc-
tor’s teaching effectiveness evaluation as well as for
institutional improvements of teaching and learning.
While more often than not administrators rather con-
fidently believethat the responses to end-of-courseas-
sessments represent an accurate description of teacher
effectiveness, as a rule, faculty are more skeptical in
this regard (Morgan et al., 2003), (Centra, 2003) The
following is a summary of the most significant obser-
vations concerning teaching evaluations found in the
literature:
1. Courses with fewer students receive more positive
evaluations than large courses.
2. Humanities courses tend to get better evaluations
than science courses.
3. Courses at the advanced level get slightly better
evaluations than those at the basic level.
4. Optional courses are better appreciated than
mandatory ones.
In a study conducted at the Hong Kong Polytech-
nic University that focused on the above observations
(Kwan, 1999) reached the conclusion that students
base their answers on factors external to the course.
In a similar line, (Karlsson and Lundberg, 2012) ana-
lyzed ninety-eight assessments of faculty from across
Swedish universities and concluded that the ratings
involve a clear gender and age bias. Younger teachers
tend to obtain lower marks in comparison with more
senior faculty. Women teachers also consistently re-
ceive poorer ratings in comparison with their male
counterparts. The effects are worse if the two factors
are combined: if you are a young female teacher your
evaluations are likely to be significantly below those
of a senior male teacher. Gender effect on teaching
evaluations is also addressed by (Sprague and Mas-
soni, 2005) with similar conclusions. (Dutceac, 2012)
notes: “If a teacher is assigned a mandatory first-year
course with one hundred students, she is very likely
to get poorer results on the course evaluations than a
male colleague teaching a smaller, optional course for
the third-year students. And this is regardless of the
actual pedagogical skills and competence of the per-
sons in question!”
In this paper we examine some of the aboveclaims
by analyzing 24,862 University of Maryland Balti-
more County (UMBC) questionnaires generated over
16 semesters. UMBC numerical data supports some
of the above observations, and contradicts others. To
the best of our knowledge this is the first study cover-
ing teaching evaluation data of this magnitude.
2 INSTRUCTOR’S AND UNIT’S
RATINGS
Student Course Evaluation Questionnaires (SCEQs)
are a basic tool for instructor’s teaching effective-
ness evaluation. The Student Evaluation of Education
Quality (SEEQ) was developed in 1976 by Dr. Her-
bert Marsh, University of Western Sydney. Marsh
221
Kogan J..
Student Course Evaluation - Class Size, Class Level, Discipline and Gender Bias.
DOI: 10.5220/0004861802210225
In Proceedings of the 6th International Conference on Computer Supported Education (CSEDU-2014), pages 221-225
ISBN: 978-989-758-021-5
Copyright
c
2014 SCITEPRESS (Science and Technology Publications, Lda.)

is an internationally recognized expert in the area of
psychometrics.
By now various versions of SCEQs have been
serving institutions of higher learning around the
globe for a long time (Abrami and Cohen, 1990).
Course evaluations are incorporated in the process
by which Universities seek to improve teaching and
learning, and to consider faculty for merit raises, pro-
motion and tenure. The UMBC questionnaireconsists
of seven sets of items. One set contains general ques-
tions that should be applicable to almost all courses.
The remaining sets are designed for lectures, discus-
sion, mathematics and science laboratories, seminars,
field experience, and self-paced courses. Six ques-
tions permit separate evaluation of as many as four in-
structors. The instructor has the option of administer-
ing whichever sets of questions are applicable. This
study focuses on general question 9 (G9) “How would
you grade the overall teaching effectiveness.”
UMBC has been using information collected
through SCEQs for a variety of purposes for about
forty years. UMBC Student Course Evaluation Ques-
tionnaires contain student ratings ranging from 1
(worst) to 5 (best) per each question asked. The
SCEQ administration protocol is described in writ-
ing, and the Instructor is charged with the responsi-
bility of conducting the survey. The quality of SCEQ
scores depends on students’ competence to evaluate
an instructor and may vary, but a student’s evaluation
is independent, for example, of the student’s GPA. In
other terms, ratings assigned by “F” students are as
important for instructor’s teaching evaluation as those
assigned by “A” students.
The ratings per question are averaged out, i.e., the
ratings per question are added up and the sum is di-
vided by the number of students who responded to the
question (see e.g. (Hardy et al., 1934) where mean
evaluations are discussed). This average is named
“Instructor Mean.”
Along with individual instructor statistics per
class/question, SCEQ provides additional statistical
indicators, among them “Org Mean” representing a
discipline. UMBC computed org means are actually
mean averages of the instructor’s means. The aver-
age scores for a class with one response are weighted
equally to a class with numerous responses when “av-
eraging the averages.” Instructor Means for classes
of different size contribute equally to the Org Mean.
Hence the input of large student groups (students in
large classes) to the computation of Org Mean is iden-
tical to that of small student groups (students in small
classes).
To make this point clear we consider a hypothet-
ical “Org” with just two instructors, A and B. While
A teaches a small class with one student, B teaches
a large class with one hundred students. The single
student in the small class rates the “overall teaching
effectiveness” (question G9 of the questionnaire, and
the main focus of this paper) of the instructor by 5,
while each of the one hundred students in the large
class responds to the same question with 3. Hence the
Instructor A mean is 5, the Instructor B mean is 3, and
the Department Mean is (5 + 100 × 3)/101 = 3.02.
However the Org Mean reported by on the UMBC
SCEQ forms for this hypothetical “Org” would be
(3+ 5)/2 = 4.
There are two major deficiencies of the org mean
computation currently in place at UMBC:
1. The current method reports instructor B rating 3
significantly below the Org Mean 4, while in fact
the Org Mean is only 3.02. The reporting distorts
reality.
2. As the example above shows, the opinion of a
single student in the small class carries the same
weight as that of the 100 students in the large
class. In other terms, the voice of one student in
the large class worth just 0.01 of the voice of the
one student in the small class.
There is no reason for discrimination based solely on
the class size.
The results reported in this paper provide means
computed in accordance with standard mathematical
definition of the arithmetic mean (see e.g. (Hardy
et al., 1934), (Hodges and Lehmann, 1964)). The
same way means are computed by the University of
Maryland College Park (UMCP). Each reference to
means computed by UMBC is specifically indicated
in the text below.
3 LEVEL MEANS
The UMBC website provides information about 82
different disciplines (“orgs”). We remove 11 “non
academic” orgs (with classes such as “Aerobics,”
“Walking/Jogging,” etc.), and focus on students rat-
ings for undergraduate classes (those are 100, 200,
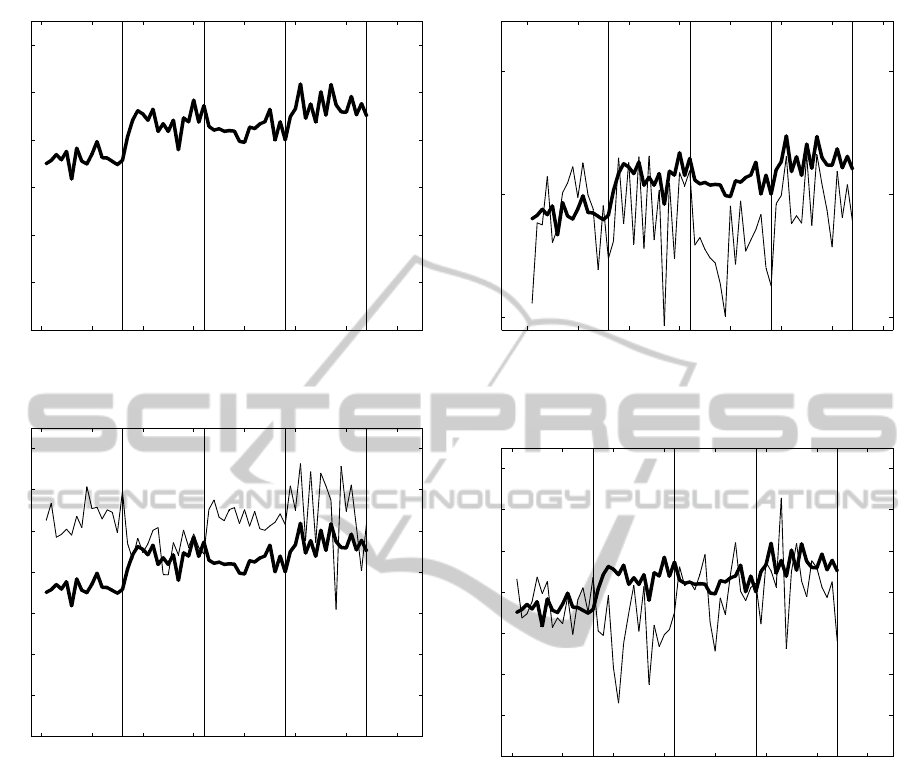
300, and 100 level courses). We compute and graph
means for undergraduate courses covering 71 aca-
demic disciplines over 16 semesters (Spring 2005-
Fall 2012, total of 64 semesters, see Figure 1). The
graph shows that the means slowly climb up as levels
advance from 100 to 400.
We now partition 71 academic disciplines into 6
clusters:
1. Arts,
2. Engineering & Technology,
CSEDU2014-6thInternationalConferenceonComputerSupportedEducation
222
0 10 20 30 40 50 60 70
3.2
3.4
3.6
3.8
4
4.2
4.4
Spring 2005−Fall 2012, UMBC 4 level means
semester
level mean by semester
100 level 200 level 300 level 400 level
UMBC
Figure 1: UMBC four level means.
0 10 20 30 40 50 60 70
3.2
3.4
3.6
3.8
4
4.2
4.4
4.6
Spring 2005−Fall 2012, UMBC vs DISCIPLINE CLUSTER−1, 4 level means
semester
level mean by semester
100 level 200 level 300 level 400 level
UMBC
C1
Figure 2: UMBC means vs Arts means.
3. Humanities,
4. Mathematical Sciences,
5. Natural Sciences,
6. Social Sciences.
The means for cluster 1 (Arts) vs. UMBC are shown
on Figure 2. The graph reveals that Arts means are
higher than the means for the entire university. On
the other hand cluster 2 (Engineering & Technology)
means, although oscillating around the UMBC means
for 100 level classes, clearly fall below the university
means as class level grows to 400 (Figure 3). We note
that the general trend preserves itself if UMBC means
are used as a benchmark, i.e., Humanities and So-
cial Sciences means are above the benchmark, Math-
ematical Sciences and Natural Sciences are below the
benchmark.
The Mathematical Sciences cluster that consists
of MATH (mathematics), PHYS (physics), and STAT
0 10 20 30 40 50 60 70
3.5
4
4.5
Spring 2005−Fall 2012, UMBC vs DISCIPLINE CLUSTER−2, 4 level means
semester
level mean by semester
100 level 200 level 300 level 400 level
UMBC
C2
Figure 3: UMBC means vs Engineering & Technology
means.
0 10 20 30 40 50 60 70
3.2
3.4
3.6
3.8
4
4.2
4.4
4.6
Spring 2005−Fall 2012, UMBC vs DISCIPLINE CLUSTER−4, 4 level means
semester
level mean by semester
100 level 200 level 300 level 400 level
UMBC
C4
Figure 4: UMBC means vs Mathematical Sciences means.
(statistics) “orgs” exhibits a peculiar behavior (Fig-
ure 4). While generally this cluster’s means fall under
the university means this is not the case for 100 level
classes where we observe oscillations around UMBC
means, similar to the Engineering & Technology clus-
ter means.
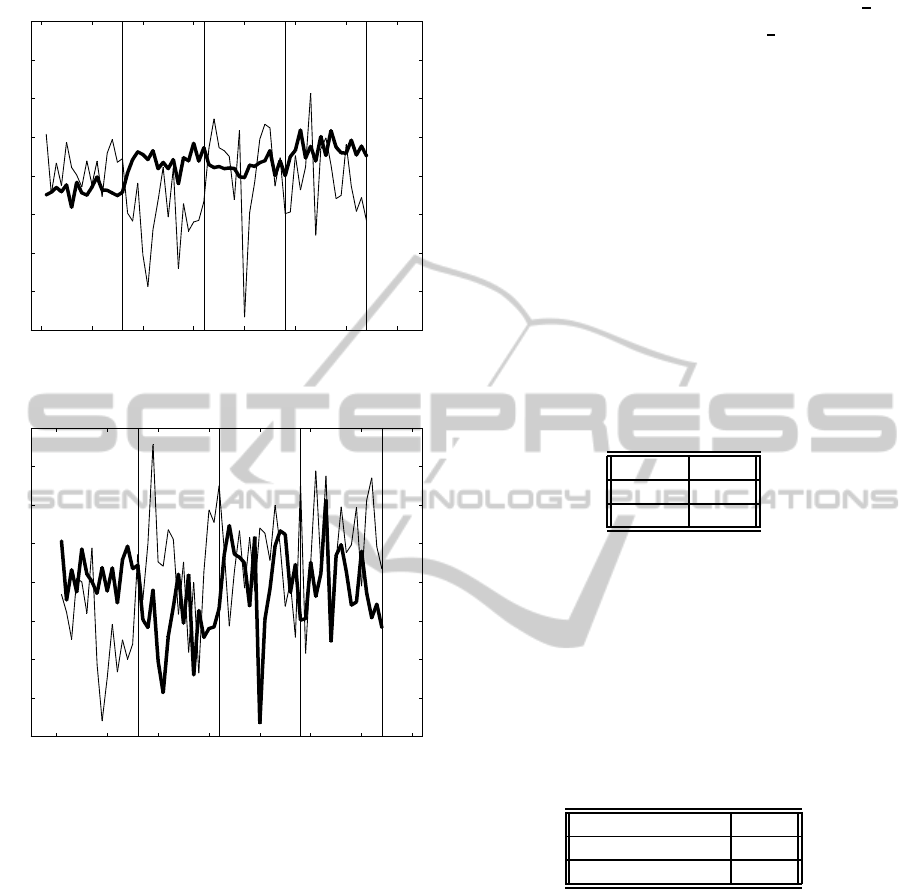
Examination of MATH alone (see Figure 5) shows
that MATH 100 level means are higher than the uni-
versity means. MATH 100 level classes are usually
mandatory and of large size, yet student ratings of
“the overall teaching effectiveness” of instructors are
very high. We note that student ratings for MATH
200, 300, and 400 level classes generally fall under
the corresponding UMBC means (Figure 5). Finally
we focus on Physics, the “sister” subject of Mathe-
matics. The means of students’ ratings Physics vs.
Mathematics are shown in Table 6. While at the 100
level classes students rate MATH instruction higher
StudentCourseEvaluation-ClassSize,ClassLevel,DisciplineandGenderBias
223
0 10 20 30 40 50 60 70
3.2
3.4
3.6
3.8
4
4.2
4.4
4.6
Spring 2005−Fall 2012, UMBC vs MATH 4 level means
semester
level mean by semester
100 level 200 level 300 level 400 level
UMBC
MATH
Figure 5: UMBC means vs Mathematics means.
0 10 20 30 40 50 60 70
3.2
3.4
3.6
3.8
4
4.2
4.4
4.6
Spring 2005−Fall 2012, MATH vs PHYS 4 level means
semester
level mean by semester
100 level 200 level 300 level 400 level
MATH
PHYS
Figure 6: Physics means vs Mathematics means.
than that of Physics, at appears as students mature
the ratings abruptly flip at the 200 level. For the rest
of students undergraduate life the MATH ratings are
generally struggle under the PHYS ratings.
UMBC questioners do not provide data for in-
structor’s gender and rank. In the next section we con-
sider a single “org” for which instructor’s gender and
rank are available to us.
4 MATH AT UMBC: GENDER
AND RANK BIAS
In this section we focus on a single org that manages
to generate superior student evaluation results at the
100 level classes. We shall consider one semester
only. In Fall of 2012 the Department of Mathemat-
ics and Statistics at UMBC was comprised of 31 full
time faculty and one post-doc. Approximately
2
3
of
the faculty are Mathematicians, and
1
3
is made up by
Statisticians. Typically (but not always) Mathemati-
cians teach only MATH classes, and Statisticians are
involved in STAT instruction only. Five of the fac-
ulty are Lecturers (with no mathematical/statistical
research responsibilities). For the sake of techni-
cal convenience the term “Research Faculty” will
denote faculty other than Lecturers (i.e. “Research
Faculty” are tenured/tenure–track instructors and the
post–doc). The typical teaching work load for Re-
search Faculty is 2 classes per semester, and the teach-
ing workload for Lecturers is 4 classes per semester.
There are 7 female and 25 male faculty.
Fall 2012 G9 (“overall teaching effectiveness”)
rating clearly indicates better evaluations received by
female instructors (see Table 1).
Table 1: Mean vs. sex.
sex mean
male 3.87
female 4.11
At the same time students’ ratings of Lecturers
and “Research Faculty” show even larger gap in spite
of the fact of the heavier teaching load for Lecturers
usually conducting instructions in large (100 to 190
students) mandatory 100 level classes. The UMBC
Faculty Handbook statement “Effective teaching is
absolutely dependent on an active engagement in
scholarly efforts” is not supported by the statistics
based on SCEQs and provided in Table 2.
Table 2: Lecturers vs. Research Faculty.
rank mean
Lecturer 4.17
Research Faculty 3.56
5 CONCLUSIONS AND FUTURE
STUDY
This paper presents a preliminary analysis of Student
Course Evaluations at the University of Maryland
Baltimore County. Data provided by the University
shows that, contrary to general belief, in some cases
student evaluations in large classes are much better
than those in small classes, and results of student eval-
uations of female faculty are better than those of male
faculty. The surprise does not stop here. In some of
the disciplines teaching evaluation rating for each fac-
ulty exceeds the “org” mean reported by the university
CSEDU2014-6thInternationalConferenceonComputerSupportedEducation
224

(see, for example, Fall 2005, LATN
1
). Clearly there
are not that many colleges that can demonstrate a sim-
ilar result. It should be clear that not everything is
rosy. There are still disciplines where the “org” mean
reported by the university exceeds all faculty ratings
(see, for example, Spring 2012, ARBC
2
).
Future research should investigate gender and fac-
ulty rank influence on student ratings. We would like
to investigate data pertaining to additional Maryland
colleges, and, perhaps, nationwide data. While disci-
pline clustering reported in this study was performed
manually in the future studies we intend to apply
modern clustering techniques that automatically dis-
cover the number of clusters as well as clusters in a
given dataset (Kogan, 2007), (Mirkin, 2005).
ACKNOWLEDGEMENTS
The author thanks German Westphal for his input and
help with preparation of the manuscript. Insightful
conversations with Bradford Sobakewitz are greatly
appreciated.
REFERENCES
Abrami, P.C. d’Apollonia, S. and Cohen, P. (1990). Validity
of student ratings of instruction: What we know and
what we do not. Journal of Educational Psychology,
82:2.
Centra, J. (2003). Will teachers receive higher student eval-
uations by giving higher grades and less course work?
Research in Higher Education, 44:5.
Dutceac, A. (2012). Evaluate the evaluation: Course evalu-
ations and external biases. Inside Higher Ed.
Hardy, G., J.E., L., and Polya, G. (1934). Inequalities. Cam-
bridge University Press, Cambridge.
Hodges, J. J. and Lehmann, E. L. (1964). Basic Concepts
of Probability and Statistics. Holden-Day, San Fran-
cisco.
Karlsson, M. and Lundberg, E. (2012). I betraktarens
¨ogon betydelsen av k¨on och ˚alder f¨or studenters
l¨araromd¨omen. H¨ogre utbildning, 2:1.
Kogan, J. (2007). Introduction to Clustering Large
and High–Dimensional Data. Cambridge University
Press, New York.
Kwan, K.-p. (1999). How fair are student ratings in assess-
ing the teaching performance of university teachers?
Assessment & Evaluation in Higher Education, 24:2.
Mirkin, B. (2005). Clustering for Data Mining: A Data Re-
covery Approach. Chapman & Hall/CRC, Boca Ra-
ton.
1
http://oir.umbc.edu/files/2013/02/LATN
−
F05.pdf
2
http://oir.umbc.edu/files/2013/02/ARBC
−
S12.pdf
Morgan, D. A., Sneed, J., and Swinney, L. (2003). Are
student evaluations a valid measure of teaching effec-
tiveness: perceptions of accounting faculty members
and administrators. Management Research News, 26
(7):17–32.
Sprague, J. and Massoni, K. (2005). Student evaluations
and gendered expectations: What we cant count can
hurt us. Sex Roles: A Journal of Research, 53, 11-
12:779–793.
StudentCourseEvaluation-ClassSize,ClassLevel,DisciplineandGenderBias
225
