
Graph Cut and Image Segmentation using Mean Cut by Means of an
Agglomerative Algorithm
Elaine Ayumi Chiba
1
, Marco Antonio Garcia de Carvalho
1
and Andr´e Lu´ıs da Costa
2
1
Computing Visual Lab, School of Technology - FT, University of Campinas - UNICAMP, Limeira - SP, Brazil
2
Department of Computer Engineering and Industrial Automation, School of Electrical and Computer Engineering -
FEEC, University of Campinas - UNICAMP, Campinas-SP, Brazil
Keywords:
Image Segmentation, Graph Partitioning, Cut, Mean Cut, Hierarchical Clustering.
Abstract:
Graph partitioning, or graph cut, has been studied by several authors as a tool for image segmentation. It refers
to partitioning a graph into several subgraphs such that each of them represents a meaningful object of interest
in the image. In this work we propose a hierarchical agglomerative clustering algorithm driven by the cut and
mean cut criteria. Some preliminary experiments were performed using the benchmark of Berkeley BSDS500
with promising results.
1 INTRODUCTION
Image segmentation is an important task in computer
vision and image processing domains. It aims at parti-
tioning an image into regions of interest for later anal-
ysis (Gonzalez and Woods, 2010).
There are several graph theory based techniques
which are used in image segmentation. In particular,
the graph cut techniques perform the segmentation by
dividing a graph into disjoint subgraphs according to
a given measure that takes in account the removed
edges (Peng et al., 2013). There are different met-
rics to evaluate the graph’s cut quality. Wu and Leahy
(1993) proposed the first graph cut technique for im-
age segmentation, where the graph cut value must be
minimized in order to determine the optimal graph
partition. However, the cut metric has the bias of find-
ing small components. To address this problem other
metrics were introduced, such as the normalized cut
(Shi and Malik, 2000) and the mean cut (Wang and
Siskind, 2001). The optimization of these metrics are
problems with complexity NP-complete for general
graphs. Therefore, Shi and Malik (2000) employed
spectral graph teory (Cvetkovi´c et al., 2010) concepts
for finding a graph cut with small normalized cut
value, but not optimal. Wang and Siskind (2001) pre-
sented an algorithm capable of finding the graph cut
with optimal mean cut value, but is restricted to planar
graphs.
In a recent work, Costa (2013) proposed a novel
algorithm for finding graph partitions with small nor-
malized cut values. This new algorithm uses the nor-
malized cut metric to guide the hierarchical cluster-
ization of the graph nodes, until a given number of
clusters are reached. The Costa’s algorithm ensures
that the subgraphs are connected and achieves a nor-
malized cut value about 40 times smaller than the al-
gorithm proposed by Shi and Malik. Furthermore, the
computational performance of the new algorithm has
inverse relation and is less dependent on the number
of desired region than the former algorithm, which
has increasing cost as raises the number of desired re-
gions.
In this paper we utilize the Costa’s (Costa, 2013)
algorithm structure to create a hierarchical agglomer-
ative clustering algorithm driven by the cut and the
mean cut metrics. Although this new algorithm is
not able to find the graph partition with optimal mean
cut value, it is applicable to general graphs. Indeed,
the algorithm’s goal is not to optimize the cut mea-
sures but, instead, use them for directing the cluster-
ing process. Preliminary segmentations of the im-
ages from the Berkeley’s segmentation benchmark
BSDS500 (Arbel´aez et al., 2011) are being presented.
The next sections are organizedas follows: in Sec-
tion 2 an overview of the general process of image
segmentation by graph cut is given; in Section 3 we
introduce the algorithm proposed in this work; the
preliminary results obtained with the proposed algo-
rithm are shown in Section 4; finally, in Section 5 are
outlined some conclusions and perpectives for future
works.
708
Chiba E., Carvalho M. and Costa A..
Graph Cut and Image Segmentation using Mean Cut by Means of an Agglomerative Algorithm.
DOI: 10.5220/0004858207080712
In Proceedings of the 9th International Conference on Computer Vision Theory and Applications (VISAPP-2014), pages 708-712
ISBN: 978-989-758-003-1
Copyright
c
2014 SCITEPRESS (Science and Technology Publications, Lda.)
2 IMAGE SEGMENTATION BY
GRAPH CUT
The general problem of image segmentation using
graph cut techniques assumes an image graph repre-
sentation G = (V, E, W) as an undirected graph, where
V is the set of nodes, E is the set of edges and W is the
set of weights associated with the edges. Two nodes
u, v ∈ V are adjacent, represented by u ∼ v, if there
exist an edge {u, v} ∈ E linking u and v (Wilson and
Watkins, 1990). The graph nodes are associated to
the pixels or to groups of pixels, i. e., image regions.
In the problem of minimization of the graph cut mea-
sures, a weight w
{u,v}
∈W must reflect the similarity
between the image elements associated to the nodes u
and v ∈ V. Thus we refer to this image graph repre-
sentation as a similarity graph.
Let G = (V, E, W) be a similarity graph and A =
(V
a
, E
a
, W
a
) be a subgraph of G. The cut metric is
defined as (Wu and Leahy, 1993; Peng et al., 2013)
cut(A) =
∑
u∈V
a
,v∈V\Va
w
{u,v}
. (1)
And the meancut metric is defined as (Wang and
Siskind, 2001; Peng et al., 2013)
meancut(A) =
cut(A)
∑
u∈V
a
,v∈V\Va
1
. (2)
It is assumed that the best graph partition is the
one with the minimal graph cut value (Wu and Leahy,
1993; Shi and Malik, 2000; Wang and Siskind, 2001;
Peng et al., 2013). However,such partitions are nearly
impossible to find in most cases. There are also sev-
eral issues related to the graph cut metrics, such as the
bias for small regions presented by the cut metric.
3 CUT AND MEAN CUT DRIVEN
HIERARQUICAL CLUSTERING
The proposed hierarchical agglomerative algorithm
works in a similar fashion to the classical linkage al-
gorithms (Gower and Ross, 1969; Sibson, 1973) in
the sense that on each iteration both aims at defin-
ing the edge {u, v} ∈E whose nodes will be merged.
However, while the linkage algorithms rely on the
edge weights to define such edge, Costa’s algorithm
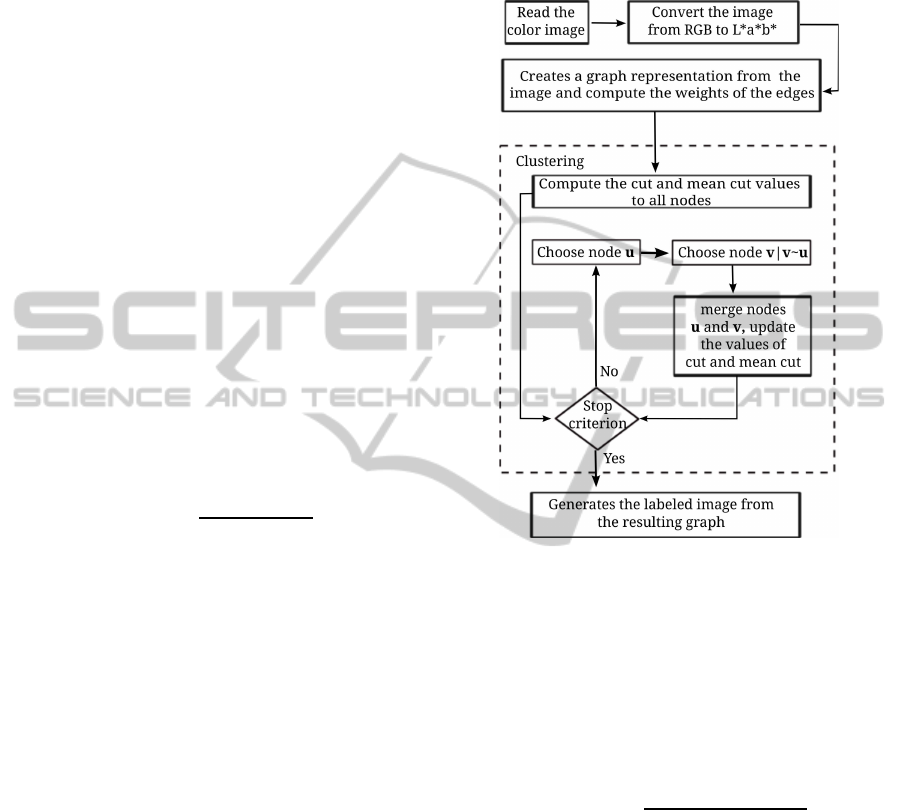
rely on the node attributes. The dashed area in the
block diagram shown in Figure 1 outline the steps in-
volved on each iteration of the proposed clustering al-
gorithm. Note that one node u ∈V is defined first and
only after a second node v ∈ V|v ∼ u is determined.
The criteria for defining the nodes u and v are distinct.
Another difference to the linkage algorithms is that
the edges incident to the merged node, and their cor-
respondent nodes, must be updated after each merge
in order to keep weights and attributes consistencies.
Figure 1: Outline of the image segmentation process using
the proposed hierarchical agglomerative algorithm.
Let G
n
= (V
n
, E
n
, W
n
, D
n
) be the graph used in
the iteration n ∈ N
0
, where the sets V
n
, E
n
, and W
n
are defined similarly to the sets V, E, and W from G,
and D
n
is a set of degrees d
{u,v}
∈ D
n
associated to
the graph edges. The edge degree set is used in the
computation of the mean cut values for the nodes u ∈
V
n
, as follow
meancut(u) =
cut(u)
∑
u∈V
n
,v∈V
n
\{u}
d
{u,v}
, (3)
where cut(u) =
∑
u∈V
n
,v∈V
n
\{u}
w
{u,v}
. The definition
of the mean cut for a single node may be confusing at
first, but remember that a node u ∈V
n
corresponds to
a whole subgraph A ∈G.
3.1 Heuristic
The main difference from the Costa’s algorithm to the
algorithm proposed in this paper lies on the heuris-
tic employed to determine the edge whose nodes are
merged on each iteration. While the former uses the
normalized cut, the second uses a combination of the
cut and mean cut metrics.
GraphCutandImageSegmentationusingMeanCutbyMeansofanAgglomerativeAlgorithm
709
First Rule: this rule define the first node u ∈V
n
. At
the begining of the clustering process the node u is
defined such that
argmax
u
(meancut(u)). (4)
The reason for this criterion is that the node with high-
est mean cut value will have better chances to have its
mean cut value decreased when merged with one of its
neighbors. However, we observed that this criterion
alone has the tendency to generate regions with un-
balanced area, leading to partitions with very small re-
gions along with very big ones. To address this prob-
lem the rule is switched when the number of nodes in
the graph G
n
reaches a given threshold t ∈ N
+
. The
new rule selects a node u ∈V
n
such that
argmin
u
(cut(u)). (5)
The new rule causes the smaller regions to be merged
with one of its neighbors, yielding to a more balanced
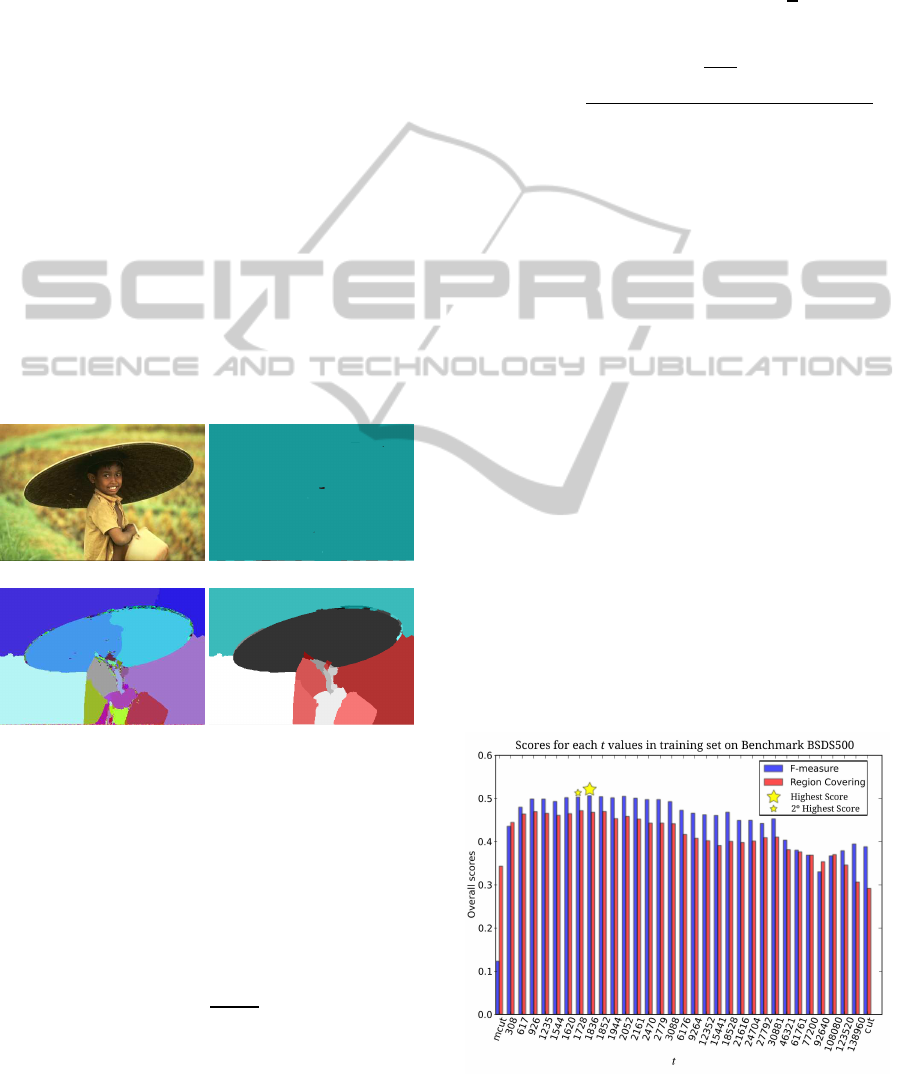
segmentation. Figure 2 show the unbalanced regions
produced by the mean cut rule, as well as the more
balanced result produced by mixing the two rules with
t = 1836.
(a) Original image (b) 30 regions (mean cut)
(c) 1836 regions (mean cut) (d) 30 regions (t = 1836)
Figure 2: Segmentations produced using the mean cut rule
and the mixing of the mean cut and cut rules. (b) segmen-
tation by using the mean cut rule until 30 regions. (c) seg-
mentation by using the mean cut rule until 1836 regions.
(d) segmentation by mixing the mean cut and cut rules with
t = 1836.
Second Rule: this rule define the second node v ∈V
n
,
which must be adjacent to the node u already chosen.
The node v ∈V
n
|v ∼u is selected such that
argmin
v
cut(v)
w
{u,v}
. (6)
This criterion selects the neighbor of u with best rela-
tion of having the smallest cut value and the greatest
similarity to u.
4 EXPERIMENTS
Firstly, we create an image graph representation by
using the pixel grid model (Shi and Malik, 2000),
where each graph node is associated to a pixel, and
two nodes are connected by an edge if their associ-
ated pixels are within the radius r =
√
2. The edge
weights are given by
w
{u,v}
= e
−
∆C
σ(∆C)
, (7)
where ∆C =
p
(L
u
−L
v
)
2
+ (a
u
−a
v
)
2
+ (b
u
−b
v
)
2
is
the color difference, in L*a*b* color space calibrated
in D50, between the pixels associated to the nodes u
and v. This color space was chosen because of its
ability to mimic the nonlinear responses of the human
eye (Gonzalez and Woods, 2010).
We used the Berkeley’s segmentation benckmark
BSDS500 (Arbel´aez et al., 2011) to evaluate the re-
sults. In the BSDS500 dataset, the images are di-
vided into a training set with 200 images, a valida-
tion set with 100 images and a test set with 200 im-
ages. The metrics F-measure and Region covering,
that respectively evalute the segmentation boundary
and the overlapping of regions, were used to com-
pute the scores of each segmentation produced. The
implementation of these metrics are available in the
BSDS500 benchmark. The segmentation were per-
formed in exactly 20 regions. This number was cho-
sen after an analysis of the number of regions in the
human segmentations from the training set.
The prelimirary experiments were conducted on
the training set, and the goal was to find the threshold
t that produced the best overall F-measure and Region
Covering scores. Figure 3 show the scores obtained
with different values for t.
The sizes of all tested images were 481x321,
which give us a total of 154401 nodes in the graph G
0
.
t
Scores for each t values in training set on Benchmark BSDS500
Figure 3: Experiment to find the appropriate parameter for
the proposed algorithm.
VISAPP2014-InternationalConferenceonComputerVisionTheoryandApplications
710
The first search for the adequated threshold t divided
the range [0, 154401] in 10 evenly distributed. The t
with the best scores was chosen as a pivot
ˆ
t, then the
same process was recursively performed in the range
[0,
ˆ
t] until the best parameter was found.
The t = 1836 had the highest scores, this rep-
resents more than 90% of the clusterization process
driven by the mean cut metric. However, using 100%
of mean cut or using 100% cut yields to unsatisfac-
tory results. Thus the combination of the two metrics
is more suitable.
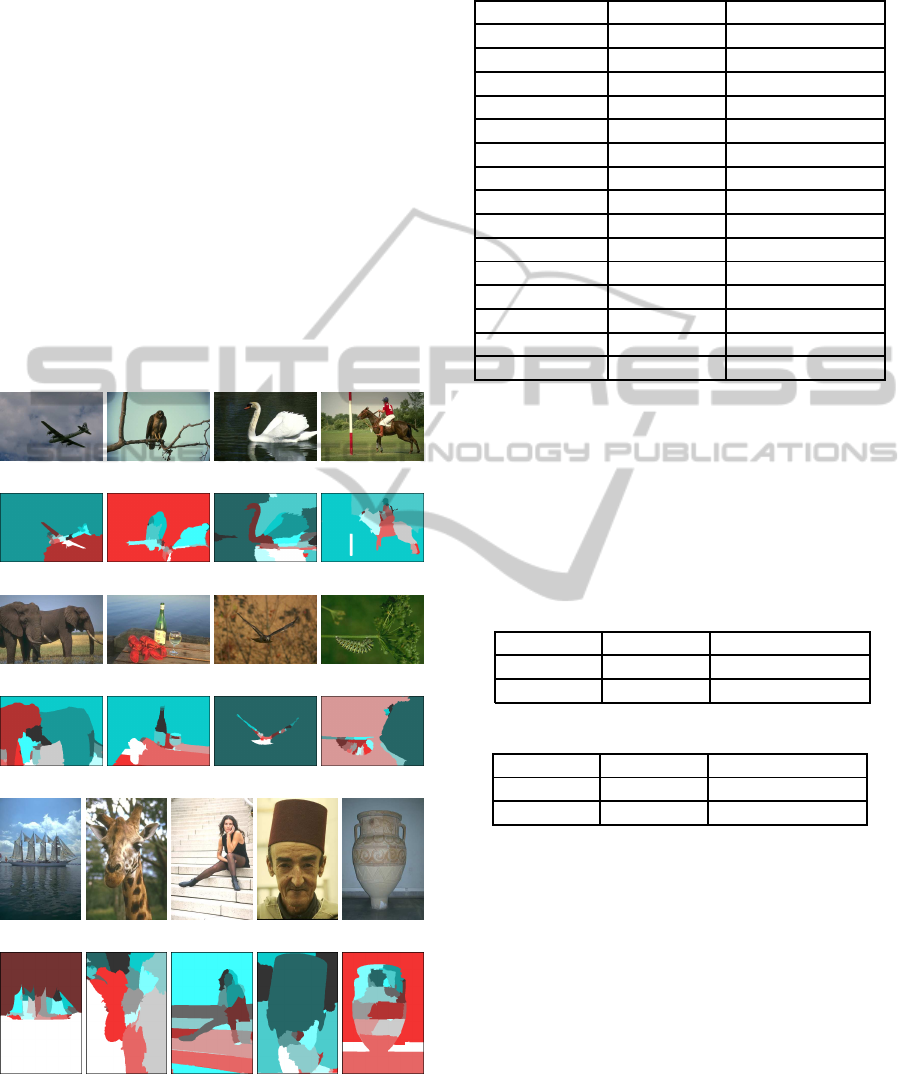
Figure 4 show a small sample of individual image
segmentation into 20 regions using t = 1836.
Table 1 shows the overall scores for validation and
test set of images, respectively first and second lines,
and the scores for the images shown in Figure 4.
Even that the images 35028 and 227092 had low
scores, as shown in Table 1, the segmentations shown
(a) (b) (c) (d)
(e) 3096 (f) 42049 (g) 8068 (h) 206062
(i) (j) (k) (l)
(m) 296059 (n) 157032 (o) 70011 (p) 35028
(q) (r) (s) (t) (u)
(v) 257098 (w) 253092 (x) 181021 (y) 189080 (z) 227092
Figure 4: The images (a)-(d), (i)-(l), (q)-(u) are original
images from the validation and test sets of the BSDS500
dataset. Images (e)-(h), (m)-(p) and (v)-(z) are the respec-
tive segmentation results using the proposed algorithm with
t = 1836.
Table 1: Overall scores for validation and test set and the
individual score for small sample os images
Images F - measure Region Covering
Validation set 0.482 0.433
Test set 0.493 0.431
2960591 0.746 0.601
8068 0.727 0.544
3096 0.713 0.701
257098 0.704 0.655
253092 0.699 0.404
42049 0.697 0.378
181021 0.679 0.405
157032 0.634 0.574
206062 0.636 0.445
70011 0.561 0.821
189080 0.590 0.391
35028 0.376 0.407
227092 0.444 0.297
in Figures 4(p) and 4(z) are visually good.
In a First Comparison Study: we have segmented
the BSDS500 images from the test and validation sets
into 20 regions with both the algorithm proposed in
this paper with t = 1836, and Costa’s normalized cut
algorithm. The overall results are shown in Table 2
for the test set and in Table 3 for the validation set.
Table 2: Overall scores for test set.
Algorithm F-measure Region Covering
Costa’s 0.487 0.350
Proposed 0.492 0.430
Table 3: Overall scores for validation set.
Algorithm F-measure Region Covering
Costa’s 0.479 0.344
Proposed 0.481 0.432
Table 2 and 3 shown that the proposed algorithm
scores were higher than the scores from Costa’s algo-
rithm for this particular experiment. Remarkable, the
score difference was greater for the region covering
metric.
5 CONCLUSIONS AND FUTURE
WORKS
In this paper we proposed a novel approach of hi-
erarchical agglomerative clustering algorithm guided
by mean cut and cut criteria to segment images. We
showed the general structure and the heuristic of our
algorithm. After many experiments, we found a
GraphCutandImageSegmentationusingMeanCutbyMeansofanAgglomerativeAlgorithm
711

threshold t that resulted in good segmentations. How-
ever, a fixed threshold may not be suitable for all im-
ages. Therefore, as future work we plan on defining
an adaptative threshold that could be more adequated
and lead to better segmentations.
The preliminary results were promising. How-
ever, other experiments and studies need to be per-
formed in order to obtain more information about the
algorithm behavior. This is an ongoing work and
many related issues are not even being mentioned. We
hope to give more contributions to the field in future
publications.
ACKNOWLEDGEMENTS
This work is supported by CAPES Brazilian Agency.
REFERENCES
Arbel´aez, P., Maire, M., Fowlkes, C., and Malik, J. (2011).
Contour detection and hierarchical image segmenta-
tion. IEEE Transactions on Pattern Analysis and Ma-
chine Intelligence, 33(5):898–916.
Costa, A. L. (2013). Normalized cut on graphs : an aglom-
erative algorithm for bacterial colonies image segmen-
tation (in portuguese). Master’s thesis, mentation (in
portuguese). Masters thesis, School of Technology -
FT, University of Campinas - UNICAMP, Brazil.
Cvetkovi´c, D., Rowlinson, P., and Simi´c, S. (2010). An In-
troduction to the Theory of Graph Spectra. Cambridge
University Press, UK.
Gonzalez, R. and Woods, R. (2010). Digital Image Process-
ing. Addison–Wesley, 3nd edition.
Gower, J. C. and Ross, G. J. S. (1969). Minimum spanning
trees and single linkage cluster analysis. Journal of the
Royal Statistical Society. Series C (Applied Statistics),
18(1):54–64.
Peng, B., Zhang, L., and Zhang, D. (2013). A survey of
graph theoretical approaches to image segmentation.
Pattern Recognition, 46(3):1020–1038.
Shi, J. and Malik, J. (2000). Normalized cuts and image
segmentation. IEEE Transactions on Pattern Analysis
and Machine Intelligence, 1:888–905.
Sibson, R. (1973). Slink: An optimally efficient algorithm
for the single-link cluster method. The Computer
Journal, 16(1).
Wang, S. and Siskind, J. (2001). Image segmentation with
minimum mean cut. Proceedings of the Eighth In-
ternational Conference on Computer Vision, 1:517 –
524.
Wilson, R. J. and Watkins, J. J. (1990). Graphs, an intro-
ductory approach. John Wiley & Sons.
Wu, Z. and Leahy, R. (1993). An optimal graph the-
oretic approach to data clustering. IEEE Transac-
tions on Pattern Analysis and Machine Intelligence,
15(11):1101–1113.
VISAPP2014-InternationalConferenceonComputerVisionTheoryandApplications
712
